Estimated zip code population in 2022: 5,040 Zip code population in 2010: 5,033 Zip code population in 2000: 5,429
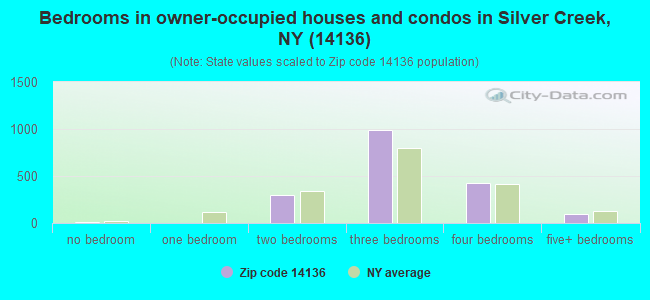
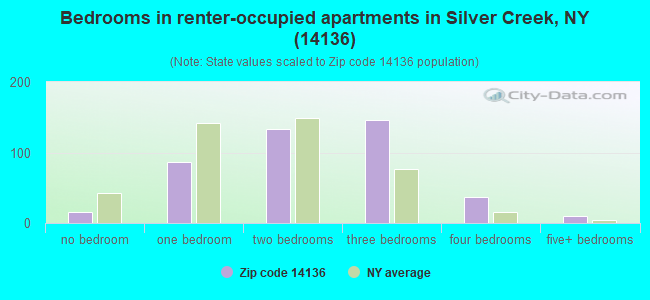
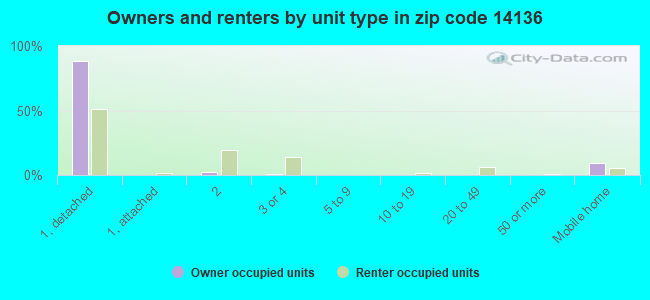
Houses and condos: 2,657 Renter-occupied apartments: 432
% of renters here:
19%
State:
46%
March 2022 cost of living index in zip code 14136: 82.4 (low, U.S. average is 100)
Land area: 23.2 sq. mi. Water area: 4.2 sq. mi.
Population density: 218 people per square mile
(very low).
OSM Map
General Map
Google Map
MSN Map
OSM Map
General Map
Google Map
MSN Map
OSM Map
General Map
Google Map
MSN Map
OSM Map
General Map
Google Map
MSN Map
Please wait while loading the map...
Real estate property taxes paid for housing units in 2022:
This zip code:
2.3% ($3,014)
New York:
1.5% ($6,180)
Median real estate property taxes paid for housing units with mortgages in 2022: $3,445 (2.6%) Median real estate property taxes paid for housing units with no mortgage in 2022: $2,290 (1.8%)
Business Search- 14 Million verified businesses
Males: 2,395
(47.5%)
Females: 2,645
(52.5%)
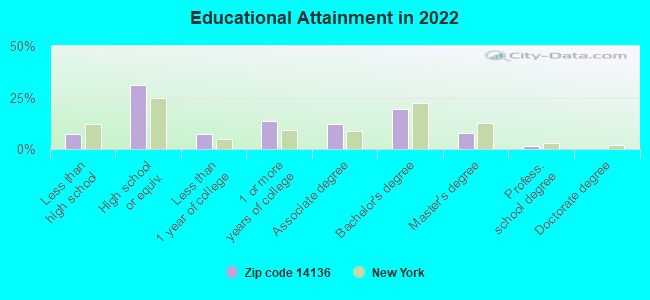
For population 25 years and over in 14136:
High school or higher: 92.0%
Bachelor's degree or higher: 28.1%
Graduate or professional degree: 9.1%
Unemployed: 4.0%
Mean travel time to work (commute): 28.0 minutes
For population 15 years and over in 14136:
Never married: 27.5%
Now married: 46.0%
Separated: 2.7%
Widowed: 8.3%
Divorced: 15.6%
Zip code 14136 compared to state average:
Median house value significantly below state average.
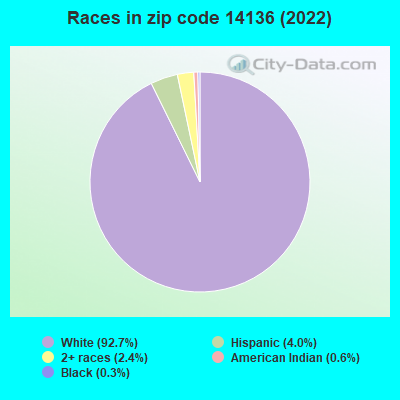
Black race population percentage significantly below state average.
Hispanic race population percentage significantly below state average.
Median age above state average.
Foreign-born population percentage significantly below state average.
Renting percentage significantly below state average.
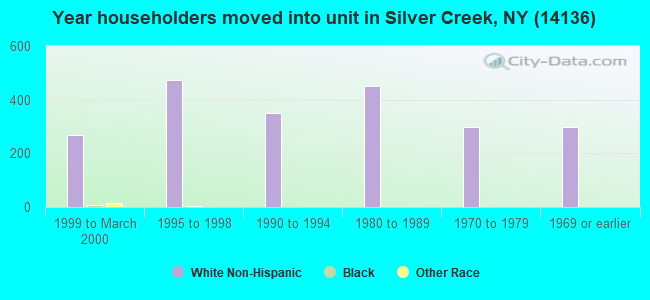
Length of stay since moving in significantly above state average.
Averages for the 2020 tax year for zip code 14136, filed in 2021:
Average Adjusted Gross Income (AGI) in 2020: $53,923 (Individual Income Tax Returns)
Here:
$53,923
State:
$90,930
Salary/wage: $45,808 (reported on 83.0% of returns)
Here:
$45,808
State:
$72,104
(% of AGI for various income ranges: 1173.3% for AGIs below $25k, 3221.8% for AGIs $25k-50k, 5835.4% for AGIs $50k-75k, 8778.8% for AGIs $75k-100k, 14078.9% for AGIs $100k-200k)
Taxable interest for individuals: $708 (reported on 32.3% of returns)
This zip code:
$708
New York:
$3,075
(% of AGI for various income ranges: 18.8% for AGIs below $25k, 14.1% for AGIs $25k-50k, 27.9% for AGIs $50k-75k, 35.9% for AGIs $75k-100k, 26.7% for AGIs $100k-200k)
Ordinary dividends: $4,364 (reported on 17.9% of returns)
Here:
$4,364
State:
$11,095
(% of AGI for various income ranges: 25.1% for AGIs below $25k, 36.4% for AGIs $25k-50k, 52.9% for AGIs $50k-75k, 77.6% for AGIs $75k-100k, 131.1% for AGIs $100k-200k)
Net capital gain/loss in AGI: +$7,632 (reported on 13.2% of returns)
Here:
+$7,632
State:
+$44,925
(% of AGI for various income ranges: 15.1% for AGIs below $25k, 17.1% for AGIs $25k-50k, 46.8% for AGIs $50k-75k, 120.0% for AGIs $75k-100k, 538.9% for AGIs $100k-200k)
Profit/loss from business: +$5,605 (reported on 8.9% of returns)
Here:
+$5,605
State:
+$14,940
(% of AGI for various income ranges: 43.2% for AGIs below $25k, 15.7% for AGIs $25k-50k, 16.4% for AGIs $50k-75k, 2.4% for AGIs $75k-100k, 440.6% for AGIs $100k-200k)
Taxable individual retirement arrangement distribution: $15,746 (reported on 10.2% of returns)
14136:
$15,746
New York:
$19,609
(% of AGI for various income ranges: 41.2% for AGIs below $25k, 112.1% for AGIs $25k-50k, 160.0% for AGIs $50k-75k, 323.5% for AGIs $75k-100k, 1065.6% for AGIs $100k-200k)
Total itemized deductions: $27,200 (reported on 2.6% of returns)
Here:
$27,200
State:
$39,326
(% of AGI for various income ranges: 227.9% for AGIs $50k-75k, 552.2% for AGIs $100k-200k)
Charity contributions: $5,850 (reported on 1.7% of returns)
Here:
$5,850
State:
$15,420
(% of AGI for various income ranges: 130.0% for AGIs $100k-200k)
Taxes paid: $7,733 (reported on 2.6% of returns)
14136:
$7,733
State:
$9,183
(% of AGI for various income ranges: 81.4% for AGIs $50k-75k, 131.1% for AGIs $100k-200k)
Earned income credit: $2,221 (reported on 16.2% of returns)
Here:
$2,221
State:
$2,138
(% of AGI for various income ranges: 85.8% for AGIs below $25k, 63.4% for AGIs $25k-50k)
Percentage of individuals using paid preparers for their 2020 taxes: 97.0%
Here:
97%
State:
95%
(% for various income ranges: 96.1% for AGIs below $25k, 98.5% for AGIs $25k-50k, 97.1% for AGIs $50k-75k, 95.8% for AGIs $75k-100k, 96.4% for AGIs $100k-200k, 100.0% for AGIs over 200k)
Averages for the 2012 tax year for zip code 14136, filed in 2013:
Average Adjusted Gross Income (AGI) in 2012: $44,797 (Individual Income Tax Returns)
Here:
$44,797
State:
$77,088
Salary/wage: $38,179 (reported on 85.3% of returns)
Here:
$38,179
State:
$60,593
(% of AGI for various income ranges: 72.6% for AGIs below $25k, 76.8% for AGIs $25k-50k, 77.5% for AGIs $50k-75k, 78.5% for AGIs $75k-100k, 69.7% for AGIs $100k-200k, 50.5% for AGIs over 200k)
Taxable interest for individuals: $753 (reported on 38.8% of returns)
This zip code:
$753
New York:
$3,125
(% of AGI for various income ranges: 0.8% for AGIs below $25k, 0.7% for AGIs $25k-50k, 0.3% for AGIs $50k-75k, 0.7% for AGIs $75k-100k, 1.0% for AGIs $100k-200k, 0.3% for AGIs over 200k)
Ordinary dividends: $3,029 (reported on 20.7% of returns)
Here:
$3,029
State:
$10,299
(% of AGI for various income ranges: 1.6% for AGIs below $25k, 1.3% for AGIs $25k-50k, 0.8% for AGIs $50k-75k, 0.3% for AGIs $75k-100k, 3.8% for AGIs $100k-200k)
Net capital gain/loss in AGI: +$2,121 (reported on 12.1% of returns)
Here:
+$2,121
State:
+$42,474
(% of AGI for various income ranges: 0.2% for AGIs $25k-50k, 0.4% for AGIs $50k-75k, 0.7% for AGIs $75k-100k, 1.7% for AGIs $100k-200k)
Profit/loss from business: +$7,967 (reported on 10.3% of returns)
Here:
+$7,967
State:
+$16,168
(% of AGI for various income ranges: 4.6% for AGIs below $25k, 1.7% for AGIs $25k-50k, 1.4% for AGIs $50k-75k, 1.8% for AGIs $75k-100k, 1.7% for AGIs $100k-200k)
Taxable individual retirement arrangement distribution: $11,283 (reported on 9.9% of returns)
14136:
$11,283
New York:
$17,621
(% of AGI for various income ranges: 2.3% for AGIs below $25k, 2.3% for AGIs $25k-50k, 2.6% for AGIs $50k-75k, 2.2% for AGIs $75k-100k, 4.2% for AGIs $100k-200k)
Total itemized deductions: $17,148 (19% of AGI, reported on 22.4% of returns)
Here:
$17,148
State:
$34,985
Here:
19.0% of AGI
State:
21.3% of AGI
(% of AGI for various income ranges: 5.9% for AGIs below $25k, 5.8% for AGIs $25k-50k, 8.2% for AGIs $50k-75k, 9.2% for AGIs $75k-100k, 11.2% for AGIs $100k-200k, 11.9% for AGIs over 200k)
Charity contributions: $2,287 (reported on 19.4% of returns)
Here:
$2,287
State:
$5,572
(% of AGI for various income ranges: 0.4% for AGIs below $25k, 0.5% for AGIs $25k-50k, 1.1% for AGIs $50k-75k, 1.1% for AGIs $75k-100k, 1.4% for AGIs $100k-200k, 1.4% for AGIs over 200k)
Taxes paid: $8,408 (reported on 22.4% of returns)
14136:
$8,408
State:
$18,656
(% of AGI for various income ranges: 2.0% for AGIs below $25k, 2.1% for AGIs $25k-50k, 3.3% for AGIs $50k-75k, 4.1% for AGIs $75k-100k, 6.3% for AGIs $100k-200k, 8.9% for AGIs over 200k)
Earned income credit: $2,180 (reported on 19.0% of returns)
Here:
$2,180
State:
$2,230
(% of AGI for various income ranges: 5.8% for AGIs below $25k, 1.2% for AGIs $25k-50k)
Percentage of individuals using paid preparers for their 2012 taxes: 57.3%
Here:
57%
State:
66%
(% for various income ranges: 51.0% for AGIs below $25k, 59.3% for AGIs $25k-50k, 58.8% for AGIs $50k-75k, 68.2% for AGIs $75k-100k, 68.8% for AGIs $100k-200k, 66.7% for AGIs over 200k)
Averages for the 2004 tax year for zip code 14136, filed in 2005:
Average Adjusted Gross Income (AGI) in 2004: $35,952 (Individual Income Tax Returns)
Here:
$35,952
State:
$59,519
Salary/wage: $33,313 (reported on 85.4% of returns)
Here:
$33,313
State:
$50,673
(% of AGI for various income ranges: 118.6% for AGIs below $10k, 75.1% for AGIs $10k-25k, 81.7% for AGIs $25k-50k, 85.5% for AGIs $50k-75k, 80.3% for AGIs $75k-100k, 65.9% for AGIs over 100k)
Taxable interest for individuals: $924 (reported on 50.8% of returns)
This zip code:
$924
New York:
$2,377
(% of AGI for various income ranges: 4.7% for AGIs below $10k, 1.9% for AGIs $10k-25k, 1.0% for AGIs $25k-50k, 0.7% for AGIs $50k-75k, 1.7% for AGIs $75k-100k, 1.4% for AGIs over 100k)
Taxable dividends: $1,857 (reported on 27.4% of returns)
Here:
$1,857
State:
$5,394
(% of AGI for various income ranges: 3.7% for AGIs below $10k, 1.8% for AGIs $10k-25k, 1.0% for AGIs $25k-50k, 0.8% for AGIs $50k-75k, 0.5% for AGIs $75k-100k, 2.9% for AGIs over 100k)
Net capital gain/loss: +$1,906 (reported on 17.7% of returns)
Here:
+$1,906
State:
+$23,581
(% of AGI for various income ranges: -4.0% for AGIs below $10k, 0.6% for AGIs $10k-25k, 0.1% for AGIs $25k-50k, 0.7% for AGIs $50k-75k, 0.0% for AGIs $75k-100k, 3.6% for AGIs over 100k)
Profit/loss from business: +$6,414 (reported on 11.9% of returns)
Here:
+$6,414
State:
+$13,809
(% of AGI for various income ranges: 2.7% for AGIs below $10k, 4.8% for AGIs $10k-25k, 1.8% for AGIs $25k-50k, 1.5% for AGIs $50k-75k, 0.1% for AGIs $75k-100k, 2.9% for AGIs over 100k)
IRA payment deduction: $3,044 (reported on 3.0% of returns)
14136:
$3,044
New York:
$3,115
(% of AGI for various income ranges: 0.2% for AGIs $10k-25k, 0.4% for AGIs $25k-50k, 0.2% for AGIs $50k-75k, 0.3% for AGIs over 100k)
Total itemized deductions: $13,979 (21% of AGI, reported on 26.8% of returns)
Here:
$13,979
State:
$25,864
Here:
20.8% of AGI
State:
21.9% of AGI
(% of AGI for various income ranges: 7.6% for AGIs below $10k, 7.6% for AGIs $10k-25k, 8.5% for AGIs $25k-50k, 11.4% for AGIs $50k-75k, 13.0% for AGIs $75k-100k, 12.1% for AGIs over 100k)
Charity contributions deductions: $1,866 (3% of AGI, reported on 24.4% of returns)
Here:
$1,866
State:
$4,439
Here:
2.7% of AGI
State:
3.6% of AGI
(% of AGI for various income ranges: 1.0% for AGIs $10k-25k, 0.9% for AGIs $25k-50k, 1.5% for AGIs $50k-75k, 1.4% for AGIs $75k-100k, 1.7% for AGIs over 100k)
Total tax: $4,563 (reported on 72.9% of returns)
14136:
$4,563
State:
$11,730
(% of AGI for various income ranges: 2.5% for AGIs below $10k, 4.1% for AGIs $10k-25k, 6.4% for AGIs $25k-50k, 8.1% for AGIs $50k-75k, 10.1% for AGIs $75k-100k, 17.9% for AGIs over 100k)
Earned income credit: $1,580 (reported on 15.8% of returns)
Here:
$1,580
State:
$1,757
Percentage of individuals using paid preparers for their 2004 taxes: 63.6%
Here:
64%
State:
67%
(% for various income ranges: 55.5% for AGIs below $10k, 61.3% for AGIs $10k-25k, 64.3% for AGIs $25k-50k, 71.3% for AGIs $50k-75k, 71.8% for AGIs $75k-100k, 76.2% for AGIs over 100k)
Household received Food Stamps/SNAP in the past 12 months: 244 Household did not receive Food Stamps/SNAP in the past 12 months: 2,005
Women who had a birth in the past 12 months: 30 (6 now married, 25 unmarried) Women who did not have a birth in the past 12 months: 937 (396 now married, 538 unmarried)
Housing units in zip code 14136 with a mortgage: 958 (77 second mortgage, 73 both second mortgage and home equity loan) Houses without a mortgage: 67
Median monthly owner costs for units with a mortgage: $1,122 Median monthly owner costs for units without a mortgage: $463
Residents with income below the poverty level in 2022:
This zip code:
12.0%
Whole state:
14.3%
Residents with income below 50% of the poverty level in 2022:
This zip code:
5.6%
Whole state:
6.8%
Median number of rooms in houses and condos:
Here:
6.6
State:
6.3
Median number of rooms in apartments:
Here:
4.9
State:
3.8
Notable locations in this zip code not listed on our city pages
Notable locations in zip code 14136: Rose Brook Golf Course (A), Hamlet Farm (B), Concord Nurseries Farm (C), Anderson-Lee Library (D), Saint Columban's on the Lake Assisted Living Facility (E), Hanover Town Hall (F), Hanover Center Fire Department (G), Silver Creek Volunteer Fire Department (H). Display/hide their locations on the map
Churches in zip code 14136 include: Zion Lutheran Church (A), Trinity Lutheran Church (B), Saint Alban's Episcopal Church (C), Silver Creek Assembly of God Church (D), Our Lady of Mount Carmel Church (E), First United Church (F), First Baptist Church (G), Christ Chapel Wesleyan Church (H), Sheridan United Methodist Church (I). Display/hide their locations on the map
Cemeteries: Smith Mills Cemetery (1), Glenwood Cemetery (2), Evergreen Lawn Cemetery (3), Mount Carmel Cemetery (4). Display/hide their locations on the map
In group quarters: 106 (-1 institutionalized population)
Size of family households: 749 2-persons, 281 3-persons, 250 4-persons, 93 5-persons, 19 6-persons, 13 7-or-more-persons
Size of nonfamily households: 719 1-person, 113 2-persons, 28 3-persons
588 married couples with children.
210 single-parent households (79 men, 131 women).
97.3% of residents of 14136 zip code speak English at home.
1.4% of residents speak Spanish at home (88% very well, 6% well, 6% not well).
1.2% of residents speak other Indo-European language at home (88% very well, 12% not well).
0.2% of residents speak other language at home (100% very well).
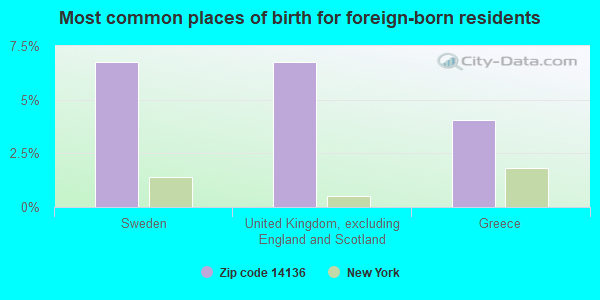
Foreign born population: 74 (1.5%) (59.9% of them are naturalized citizens)
This zip code:
1.5%
Whole state:
22.7%
7%Sweden
7%United Kingdom, excluding England and Scotland
4%Greece
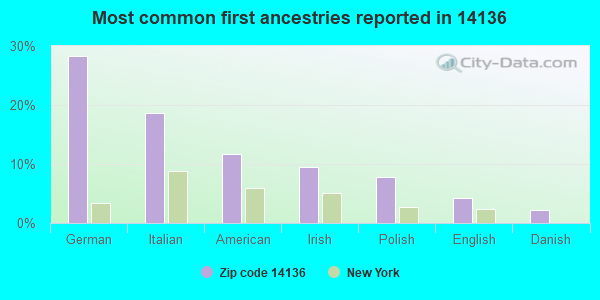
28%German
19%Italian
12%American
9%Irish
8%Polish
4%English
2%Danish
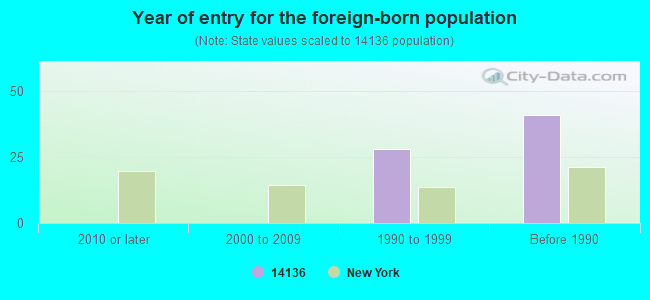
Year of entry for the foreign-born population
02010 or later
02000 to 2009
281990 to 1999
41Before 1990
Facilities with environmental interests located in this zip code:
AMERICAN MASSAGE SLS MFG CORP (341 CENTRAL AVE in SILVER CREEK, NY)
(Resource Conservation and Recovery Act (tracking hazardous waste)) Business NAICS classification: ELECTRIC HOUSEWARES AND HOUSEHOLD FAN MANUFACTURING.
Housing units lacking complete plumbing facilities: 2.1% Housing units lacking complete kitchen facilities: 3.9%
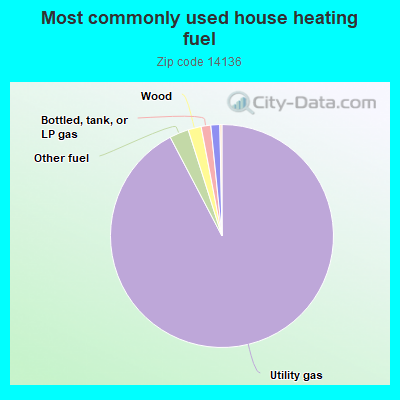
92.6%Utility gas
2.8%Other fuel
1.9%Wood
1.4%Bottled, tank, or LP gas
1.3%Electricity
Population in 1990: 5,768.
Place of birth for U.S.-born residents:
This state: 4,430
Northeast: 151
Midwest: 118
South: 138
West: 116
67% of the 14136 zip code residents lived in the same house 5 years ago. Out of people who lived in different houses, 47% lived in this county. Out of people who lived in different counties, 50% lived in New York.
94% of the 14136 zip code residents lived in the same house 1 year ago. Out of people who lived in different houses, 43% moved from this county. Out of people who lived in different houses, 56% moved from different county within same state.
Private vs. public school enrollment:
Students in private schools in grades 1 to 8 (elementary and middle school):
Here:
0.0%
New York:
15.6%
Students in private schools in grades 9 to 12 (high school): 29
Here:
9.5%
New York:
15.0%
Students in private undergraduate colleges: 28
Here:
26.4%
New York:
39.2%
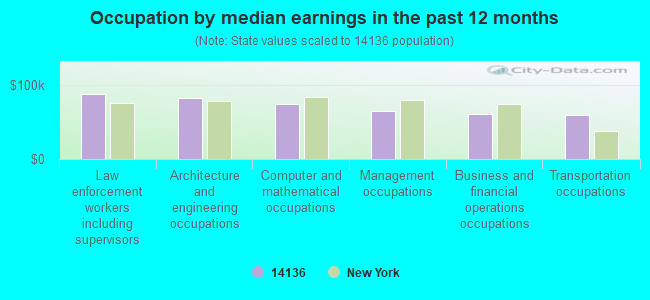
Occupation by median earnings in the past 12 months ($)
88,885Law enforcement workers including supervisors
82,866Architecture and engineering occupations
74,205Computer and mathematical occupations
64,813Management occupations
61,778Business and financial operations occupations
59,848Transportation occupations
Companies with federal contracts located in this zip code:
EXCELCO DEVELOPMENTS INC (65 MAIN ST in SILVER CREEK, NY; small business) : $124,666 in 2 contractsin 2004
$81,356 with Navy for Miscellaneous Items. Taking place in MD. Signed on 2004-07-23. Completion date: 2004-08-17.
$43,310, same as above.Signed on 2004-08-26. Completion date: 2004-09-02.
NEWBROOK MACHINE CORP (16 MECHANIC ST in SILVER CREEK, NY; small business) : $82,083 in 4 contractsin 2005
$27,968 with Navy for Hand Tools, Nonedged, Nonpowered. Signed on 2005-03-21. Completion date: 2005-06-09.
$26,280, same as above.Signed on 2005-03-21. Completion date: 2005-06-09.
$24,163 with Navy for Nuclear Reactors. Signed on 2005-08-24. Completion date: 2005-12-28.
$3,672 with Navy for Hand Tools, Nonedged, Nonpowered. Signed on 2005-10-26. Completion date: 2006-01-16.
Top industries in this zip code by the number of employees in 2005:
Health Care and Social Assistance: Residential Mental Retardation Facilities (10-19 employees: 3 establishments)
Health Care and Social Assistance: Offices of Physicians (except Mental Health Specialists) (20-49: 1, 5-9: 1)
Health Care and Social Assistance: Homes for the Elderly (20-49: 1)
Wholesale Trade: Petroleum and Petroleum Products Merchant Wholesalers (except Bulk Stations and Terminals) (20-49: 1)
People in group quarters in 2010:
56 people in nursing facilities/skilled-nursing facilities
56 people in group homes intended for adults
People in group quarters in 2000:
19 people in homes for the mentally retarded
12 people in homes or halfway houses for drug/alcohol abuse
10 people in other noninstitutional group quarters
Fatal accident statistics in 2012:
Fatal accident count: 1
Vehicles involved in fatal accidents: 1
Fatal accidents caused by drunken drivers: 1
Fatalities: 1
Persons involved in fatal accidents: 2
Pedestrians involved in fatal accidents: 0
Home Mortgage Disclosure Act Aggregated Statistics For Year 2003 (Based on 6 partial tracts)
A) FHA, FSA/RHS & VA Home Purchase Loans
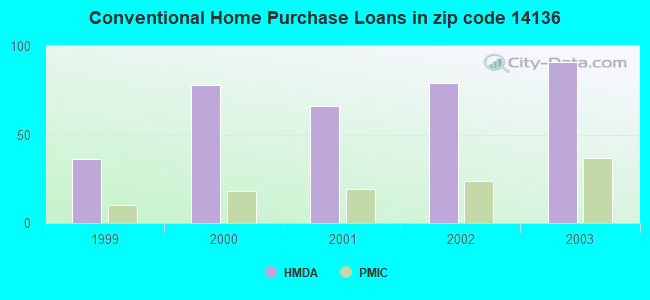
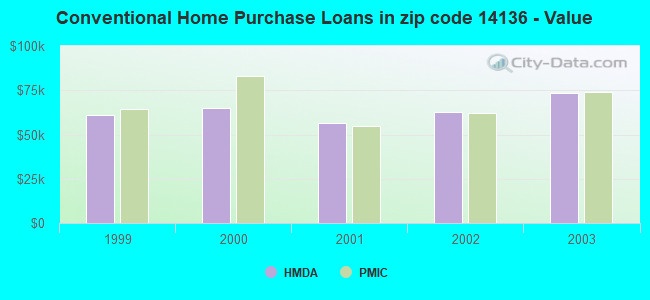
B) Conventional Home Purchase Loans
C) Refinancings
D) Home Improvement Loans
F) Non-occupant Loans on < 5 Family Dwellings (A B C & D)
Number
Average Value
Number
Average Value
Number
Average Value
Number
Average Value
Number
Average Value
LOANS ORIGINATED
42
$68,541
91
$73,696
238
$70,625
52
$14,820
27
$75,126
APPLICATIONS APPROVED, NOT ACCEPTED
1
$133,360
8
$77,314
35
$66,694
12
$16,949
1
$77,920
APPLICATIONS DENIED
3
$51,010
24
$56,175
157
$66,477
43
$17,127
8
$48,714
APPLICATIONS WITHDRAWN
0
$0
8
$65,955
101
$87,575
8
$11,969
2
$47,515
FILES CLOSED FOR INCOMPLETENESS
0
$0
4
$101,890
7
$73,921
0
$0
3
$54,443
Aggregated Statistics For Year 2002 (Based on 6 partial tracts)
A) FHA, FSA/RHS & VA Home Purchase Loans
B) Conventional Home Purchase Loans
C) Refinancings
D) Home Improvement Loans
F) Non-occupant Loans on < 5 Family Dwellings (A B C & D)
Number
Average Value
Number
Average Value
Number
Average Value
Number
Average Value
Number
Average Value
LOANS ORIGINATED
56
$71,334
79
$62,675
150
$63,095
52
$18,210
31
$50,001
APPLICATIONS APPROVED, NOT ACCEPTED
1
$23,250
12
$75,355
29
$80,431
3
$8,507
1
$75,410
APPLICATIONS DENIED
4
$78,138
19
$48,544
123
$76,564
33
$17,866
5
$35,872
APPLICATIONS WITHDRAWN
7
$61,657
5
$66,046
96
$73,948
12
$17,619
2
$30,760
FILES CLOSED FOR INCOMPLETENESS
0
$0
5
$68,952
10
$76,287
0
$0
0
$0
Aggregated Statistics For Year 2001 (Based on 6 partial tracts)
A) FHA, FSA/RHS & VA Home Purchase Loans
B) Conventional Home Purchase Loans
C) Refinancings
D) Home Improvement Loans
E) Loans on Dwellings For 5+ Families
F) Non-occupant Loans on < 5 Family Dwellings (A B C & D)
Number
Average Value
Number
Average Value
Number
Average Value
Number
Average Value
Number
Average Value
Number
Average Value
LOANS ORIGINATED
25
$63,975
66
$56,451
138
$64,194
66
$21,132
1
$628,400
18
$48,379
APPLICATIONS APPROVED, NOT ACCEPTED
0
$0
12
$43,728
39
$78,874
12
$18,822
0
$0
1
$5,030
APPLICATIONS DENIED
2
$51,140
40
$32,020
137
$65,792
35
$14,838
0
$0
1
$43,140
APPLICATIONS WITHDRAWN
1
$98,890
2
$56,390
97
$69,296
9
$15,339
0
$0
2
$44,155
FILES CLOSED FOR INCOMPLETENESS
0
$0
0
$0
9
$52,071
1
$9,430
0
$0
0
$0
Aggregated Statistics For Year 2000 (Based on 6 partial tracts)
A) FHA, FSA/RHS & VA Home Purchase Loans
B) Conventional Home Purchase Loans
C) Refinancings
D) Home Improvement Loans
F) Non-occupant Loans on < 5 Family Dwellings (A B C & D)
Number
Average Value
Number
Average Value
Number
Average Value
Number
Average Value
Number
Average Value
LOANS ORIGINATED
24
$61,814
78
$64,976
89
$56,634
53
$21,214
16
$51,968
APPLICATIONS APPROVED, NOT ACCEPTED
0
$0
18
$48,002
30
$56,393
8
$19,714
3
$19,980
APPLICATIONS DENIED
8
$42,200
57
$48,398
106
$46,713
46
$21,473
3
$29,363
APPLICATIONS WITHDRAWN
0
$0
9
$56,324
52
$51,316
6
$21,908
1
$44,950
FILES CLOSED FOR INCOMPLETENESS
0
$0
2
$98,410
5
$62,922
3
$12,987
1
$191,800
Aggregated Statistics For Year 1999 (Based on 3 partial tracts)
A) FHA, FSA/RHS & VA Home Purchase Loans
B) Conventional Home Purchase Loans
C) Refinancings
D) Home Improvement Loans
F) Non-occupant Loans on < 5 Family Dwellings (A B C & D)

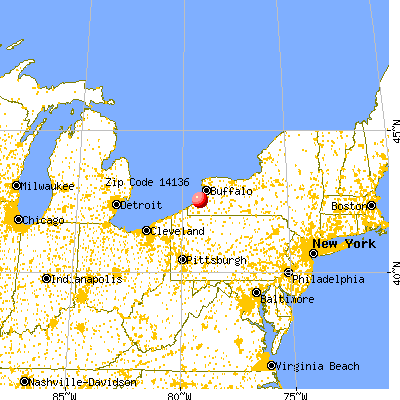


 Nearest zip codes: 14135, 14062, 14081, 14061, 14048, 14129.