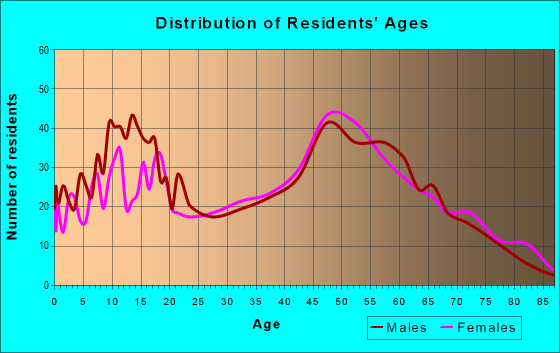
Estimated zip code population in 2022: 4,228 Zip code population in 2010: 4,255 Zip code population in 2000: 4,463
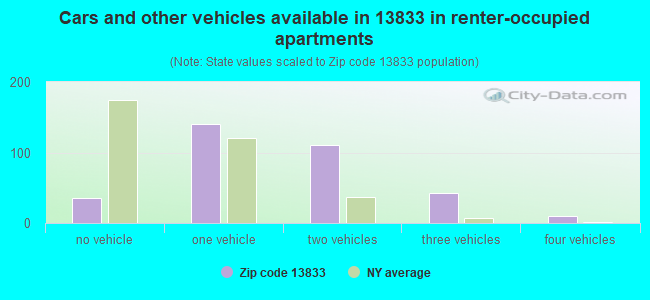
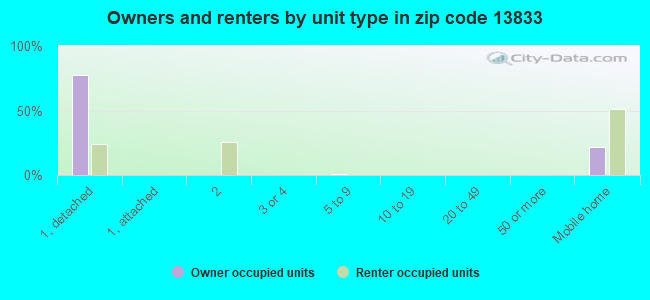
Houses and condos: 1,748 Renter-occupied apartments: 341
% of renters here:
23%
State:
46%
March 2022 cost of living index in zip code 13833: 95.1 (less than average, U.S. average is 100)
Land area: 35.7 sq. mi. Water area: 0.2 sq. mi.
Population density: 118 people per square mile
(very low).
OSM Map
General Map
Google Map
MSN Map
OSM Map
General Map
Google Map
MSN Map
OSM Map
General Map
Google Map
MSN Map
OSM Map
General Map
Google Map
MSN Map
Please wait while loading the map...
Real estate property taxes paid for housing units in 2022:
This zip code:
2.1% ($2,775)
New York:
1.5% ($6,180)
Median real estate property taxes paid for housing units with mortgages in 2022: $2,687 (1.9%) Median real estate property taxes paid for housing units with no mortgage in 2022: $2,885 (2.4%)
Business Search- 14 Million verified businesses
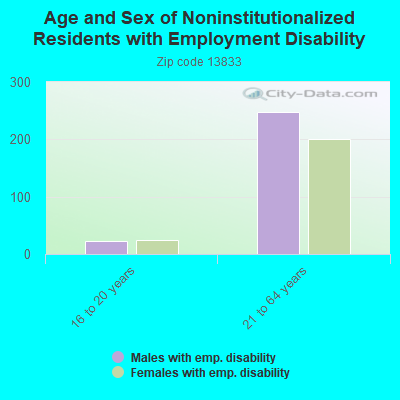
Males: 2,118
(50.1%)
Females: 2,110
(49.9%)
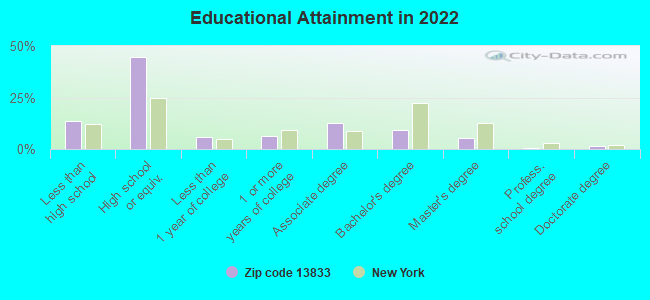
For population 25 years and over in 13833:
High school or higher: 85.3%
Bachelor's degree or higher: 16.7%
Graduate or professional degree: 7.7%
Unemployed: 7.3%
Mean travel time to work (commute): 21.3 minutes
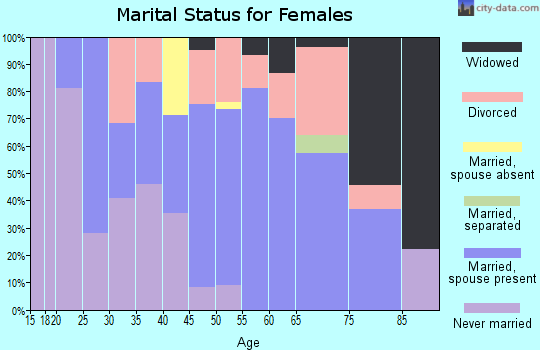
For population 15 years and over in 13833:
Never married: 26.4%
Now married: 57.8%
Separated: 2.5%
Widowed: 5.8%
Divorced: 7.6%
Zip code 13833 compared to state average:
Median household income below state average.
Median house value significantly below state average.
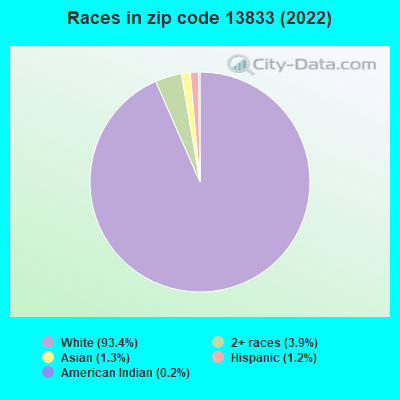
Black race population percentage significantly below state average.
Hispanic race population percentage significantly below state average.
Median age below state average.
Foreign-born population percentage significantly below state average.
Renting percentage below state average.
Length of stay since moving in above state average.
House age below state average.
Percentage of population with a bachelor's degree or higher significantly below state average.
Averages for the 2020 tax year for zip code 13833, filed in 2021:
Average Adjusted Gross Income (AGI) in 2020: $59,973 (Individual Income Tax Returns)
Here:
$59,973
State:
$90,930
Salary/wage: $48,304 (reported on 79.6% of returns)
Here:
$48,304
State:
$72,104
(% of AGI for various income ranges: 1091.1% for AGIs below $25k, 3240.2% for AGIs $25k-50k, 5430.0% for AGIs $50k-75k, 8313.6% for AGIs $75k-100k, 15400.0% for AGIs $100k-200k)
Taxable interest for individuals: $919 (reported on 39.3% of returns)
This zip code:
$919
New York:
$3,075
(% of AGI for various income ranges: 10.7% for AGIs below $25k, 22.9% for AGIs $25k-50k, 23.6% for AGIs $50k-75k, 45.7% for AGIs $75k-100k, 156.4% for AGIs $100k-200k)
Ordinary dividends: $4,071 (reported on 17.3% of returns)
Here:
$4,071
State:
$11,095
(% of AGI for various income ranges: 14.3% for AGIs below $25k, 30.8% for AGIs $25k-50k, 37.6% for AGIs $50k-75k, 98.6% for AGIs $75k-100k, 262.9% for AGIs $100k-200k)
Net capital gain/loss in AGI: +$7,307 (reported on 13.8% of returns)
Here:
+$7,307
State:
+$44,925
(% of AGI for various income ranges: 3.6% for AGIs below $25k, 32.3% for AGIs $25k-50k, 64.4% for AGIs $50k-75k, 145.7% for AGIs $75k-100k, 371.4% for AGIs $100k-200k)
Profit/loss from business: +$13,085 (reported on 10.2% of returns)
Here:
+$13,085
State:
+$14,940
(% of AGI for various income ranges: 72.0% for AGIs below $25k, 116.5% for AGIs $25k-50k, 189.6% for AGIs $50k-75k, 225.0% for AGIs $75k-100k, 680.0% for AGIs $100k-200k)
Taxable individual retirement arrangement distribution: $16,541 (reported on 11.2% of returns)
13833:
$16,541
New York:
$19,609
(% of AGI for various income ranges: 55.2% for AGIs below $25k, 56.7% for AGIs $25k-50k, 260.4% for AGIs $50k-75k, 373.6% for AGIs $75k-100k, 1392.9% for AGIs $100k-200k)
Total itemized deductions: $24,633 (reported on 3.1% of returns)
Here:
$24,633
State:
$39,326
(% of AGI for various income ranges: 328.4% for AGIs $50k-75k, 469.3% for AGIs $100k-200k)
Charity contributions: $7,233 (reported on 1.5% of returns)
Here:
$7,233
State:
$15,420
(% of AGI for various income ranges: 155.0% for AGIs $75k-100k)
Taxes paid: $6,657 (reported on 3.6% of returns)
13833:
$6,657
State:
$9,183
(% of AGI for various income ranges: 93.6% for AGIs $50k-75k, 165.7% for AGIs $100k-200k)
Earned income credit: $2,300 (reported on 15.3% of returns)
Here:
$2,300
State:
$2,138
(% of AGI for various income ranges: 81.6% for AGIs below $25k, 69.0% for AGIs $25k-50k)
Percentage of individuals using paid preparers for their 2020 taxes: 94.4%
Here:
94%
State:
95%
(% for various income ranges: 93.2% for AGIs below $25k, 94.8% for AGIs $25k-50k, 96.9% for AGIs $50k-75k, 90.0% for AGIs $75k-100k, 95.7% for AGIs $100k-200k, 100.0% for AGIs over 200k)
Averages for the 2012 tax year for zip code 13833, filed in 2013:
Average Adjusted Gross Income (AGI) in 2012: $44,269 (Individual Income Tax Returns)
Here:
$44,269
State:
$77,088
Salary/wage: $39,216 (reported on 84.5% of returns)
Here:
$39,216
State:
$60,593
(% of AGI for various income ranges: 74.2% for AGIs below $25k, 79.0% for AGIs $25k-50k, 75.4% for AGIs $50k-75k, 76.1% for AGIs $75k-100k, 70.8% for AGIs $100k-200k)
Taxable interest for individuals: $728 (reported on 39.2% of returns)
This zip code:
$728
New York:
$3,125
(% of AGI for various income ranges: 1.1% for AGIs below $25k, 0.8% for AGIs $25k-50k, 0.6% for AGIs $50k-75k, 0.3% for AGIs $75k-100k, 0.6% for AGIs $100k-200k)
Ordinary dividends: $2,375 (reported on 18.6% of returns)
Here:
$2,375
State:
$10,299
(% of AGI for various income ranges: 1.4% for AGIs below $25k, 0.5% for AGIs $25k-50k, 0.9% for AGIs $50k-75k, 0.4% for AGIs $75k-100k, 1.6% for AGIs $100k-200k)
Net capital gain/loss in AGI: +$168 (reported on 11.3% of returns)
Here:
+$168
State:
+$42,474
(% of AGI for various income ranges: 0.3% for AGIs $25k-50k, 0.2% for AGIs $100k-200k)
Profit/loss from business: +$10,756 (reported on 9.3% of returns)
Here:
+$10,756
State:
+$16,168
(% of AGI for various income ranges: 3.8% for AGIs below $25k, 0.9% for AGIs $25k-50k, 4.0% for AGIs $50k-75k, 2.7% for AGIs $100k-200k)
Taxable individual retirement arrangement distribution: $11,370 (reported on 10.3% of returns)
13833:
$11,370
New York:
$17,621
(% of AGI for various income ranges: 3.2% for AGIs below $25k, 2.4% for AGIs $25k-50k, 2.1% for AGIs $50k-75k, 2.7% for AGIs $75k-100k, 3.0% for AGIs $100k-200k)
Total itemized deductions: $18,871 (22% of AGI, reported on 21.6% of returns)
Here:
$18,871
State:
$34,985
Here:
21.6% of AGI
State:
21.3% of AGI
(% of AGI for various income ranges: 5.2% for AGIs below $25k, 4.8% for AGIs $25k-50k, 7.6% for AGIs $50k-75k, 10.4% for AGIs $75k-100k, 14.7% for AGIs $100k-200k)
Charity contributions: $2,621 (reported on 14.9% of returns)
Here:
$2,621
State:
$5,572
(% of AGI for various income ranges: 0.4% for AGIs below $25k, 0.4% for AGIs $25k-50k, 0.6% for AGIs $50k-75k, 1.0% for AGIs $75k-100k, 1.6% for AGIs $100k-200k)
Taxes paid: $8,476 (reported on 21.6% of returns)
13833:
$8,476
State:
$18,656
(% of AGI for various income ranges: 1.3% for AGIs below $25k, 1.6% for AGIs $25k-50k, 3.0% for AGIs $50k-75k, 4.6% for AGIs $75k-100k, 7.8% for AGIs $100k-200k)
Earned income credit: $2,122 (reported on 19.1% of returns)
Here:
$2,122
State:
$2,230
(% of AGI for various income ranges: 6.0% for AGIs below $25k, 1.2% for AGIs $25k-50k)
Percentage of individuals using paid preparers for their 2012 taxes: 44.3%
Here:
44%
State:
66%
(% for various income ranges: 37.7% for AGIs below $25k, 42.6% for AGIs $25k-50k, 50.0% for AGIs $50k-75k, 56.2% for AGIs $75k-100k, 58.8% for AGIs $100k-200k)
Averages for the 2004 tax year for zip code 13833, filed in 2005:
Average Adjusted Gross Income (AGI) in 2004: $37,635 (Individual Income Tax Returns)
Here:
$37,635
State:
$59,519
Salary/wage: $35,470 (reported on 87.5% of returns)
Here:
$35,470
State:
$50,673
(% of AGI for various income ranges: 89.8% for AGIs below $10k, 79.0% for AGIs $10k-25k, 83.6% for AGIs $25k-50k, 82.7% for AGIs $50k-75k, 88.8% for AGIs $75k-100k, 76.7% for AGIs over 100k)
Taxable interest for individuals: $813 (reported on 48.9% of returns)
This zip code:
$813
New York:
$2,377
(% of AGI for various income ranges: 4.8% for AGIs below $10k, 1.4% for AGIs $10k-25k, 0.8% for AGIs $25k-50k, 1.3% for AGIs $50k-75k, 0.5% for AGIs $75k-100k, 0.9% for AGIs over 100k)
Taxable dividends: $972 (reported on 22.3% of returns)
Here:
$972
State:
$5,394
(% of AGI for various income ranges: 2.0% for AGIs below $10k, 0.9% for AGIs $10k-25k, 0.6% for AGIs $25k-50k, 0.6% for AGIs $50k-75k, 0.3% for AGIs $75k-100k, 0.5% for AGIs over 100k)
Net capital gain/loss: +$1,477 (reported on 13.8% of returns)
Here:
+$1,477
State:
+$23,581
(% of AGI for various income ranges: -1.7% for AGIs below $10k, 0.5% for AGIs $10k-25k, 0.5% for AGIs $25k-50k, 0.9% for AGIs $50k-75k, 0.6% for AGIs $75k-100k, 0.5% for AGIs over 100k)
Profit/loss from business: +$7,118 (reported on 10.6% of returns)
Here:
+$7,118
State:
+$13,809
(% of AGI for various income ranges: -4.1% for AGIs below $10k, 1.1% for AGIs $10k-25k, 1.9% for AGIs $25k-50k, 2.3% for AGIs $50k-75k, 5.8% for AGIs $75k-100k)
IRA payment deduction: $2,115 (reported on 2.7% of returns)
13833:
$2,115
New York:
$3,115
Total itemized deductions: $15,279 (20% of AGI, reported on 22.6% of returns)
Here:
$15,279
State:
$25,864
Here:
20.2% of AGI
State:
21.9% of AGI
(% of AGI for various income ranges: 5.0% for AGIs below $10k, 4.5% for AGIs $10k-25k, 6.0% for AGIs $25k-50k, 9.3% for AGIs $50k-75k, 13.8% for AGIs $75k-100k, 13.4% for AGIs over 100k)
Charity contributions deductions: $2,091 (3% of AGI, reported on 18.8% of returns)
Here:
$2,091
State:
$4,439
Here:
2.6% of AGI
State:
3.6% of AGI
(% of AGI for various income ranges: 0.5% for AGIs $10k-25k, 0.5% for AGIs $25k-50k, 1.0% for AGIs $50k-75k, 1.5% for AGIs $75k-100k, 1.9% for AGIs over 100k)
Total tax: $4,819 (reported on 72.4% of returns)
13833:
$4,819
State:
$11,730
(% of AGI for various income ranges: 1.9% for AGIs below $10k, 3.4% for AGIs $10k-25k, 6.4% for AGIs $25k-50k, 9.0% for AGIs $50k-75k, 10.1% for AGIs $75k-100k, 17.8% for AGIs over 100k)
Earned income credit: $1,646 (reported on 17.9% of returns)
Here:
$1,646
State:
$1,757
Percentage of individuals using paid preparers for their 2004 taxes: 53.5%
Here:
53%
State:
67%
(% for various income ranges: 45.5% for AGIs below $10k, 51.5% for AGIs $10k-25k, 55.0% for AGIs $25k-50k, 59.3% for AGIs $50k-75k, 55.4% for AGIs $75k-100k, 69.0% for AGIs over 100k)
Household received Food Stamps/SNAP in the past 12 months: 294 Household did not receive Food Stamps/SNAP in the past 12 months: 1,230
Women who had a birth in the past 12 months: 119 (56 now married, 64 unmarried) Women who did not have a birth in the past 12 months: 694 (321 now married, 369 unmarried)
Housing units in zip code 13833 with a mortgage: 642 (44 second mortgage, 44 both second mortgage and home equity loan) Houses without a mortgage: 35
Median monthly owner costs for units with a mortgage: $1,049 Median monthly owner costs for units without a mortgage: $535
Residents with income below the poverty level in 2022:
This zip code:
30.3%
Whole state:
14.3%
Residents with income below 50% of the poverty level in 2022:
This zip code:
15.4%
Whole state:
6.8%
Median number of rooms in houses and condos:
Here:
6.1
State:
6.3
Median number of rooms in apartments:
Here:
5.1
State:
3.8
Notable locations in this zip code not listed on our city pages
Notable locations in zip code 13833: Windy Hill Farms (A), Sheepbrook Farms (B), Russwick Farms (C), Fenton Town Hall (D). Display/hide their locations on the map
Churches in zip code 13833 include: First Baptist Church of Port Crane (A), Living Hope Alliance Church (B), Port Crane United Methodist Church (C), Saint Joseph's Church (D), Sanitaria Springs Methodist Church (E). Display/hide their locations on the map
Size of family households: 451 2-persons, 213 3-persons, 246 4-persons, 84 5-persons, 25 6-persons, 74 7-or-more-persons
Size of nonfamily households: 341 1-person, 74 2-persons
593 married couples with children.
505 single-parent households (374 men, 131 women).
98.1% of residents of 13833 zip code speak English at home.
0.4% of residents speak other Indo-European language at home (100% very well).
1.2% of residents speak Asian or Pacific Island language at home (100% well).
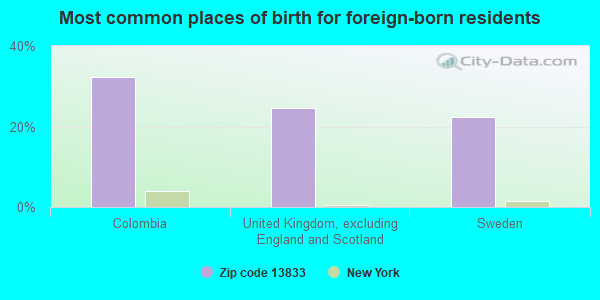
Foreign born population: 131 (3.1%) (69.3% of them are naturalized citizens)
This zip code:
3.1%
Whole state:
22.7%
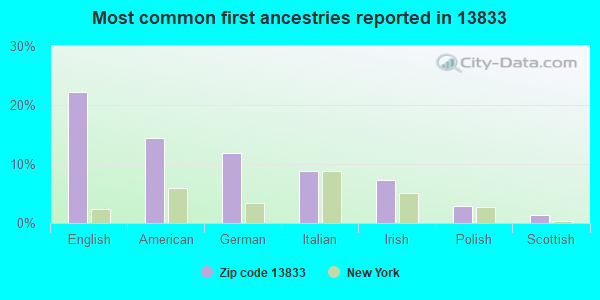
32%Colombia
25%United Kingdom, excluding England and Scotland
22%Sweden
22%English
14%American
12%German
9%Italian
7%Irish
3%Polish
1%Scottish
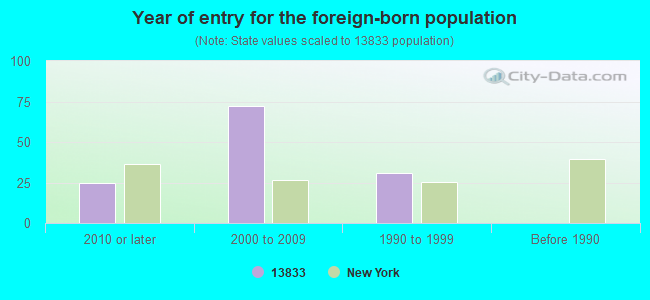
Year of entry for the foreign-born population
252010 or later
722000 to 2009
311990 to 1999
0Before 1990
Facilities with environmental interests located in this zip code:
COUNTRY COURT MOBILE HOME PARK (RD #1, BOX 161A in PORT CRANE, NY)
(Integrated Compliance Information System) - ICIS-02-2000-8109, FORMAL ENFORCEMENT ACTION Business SIC classification: WATER SUPPLY
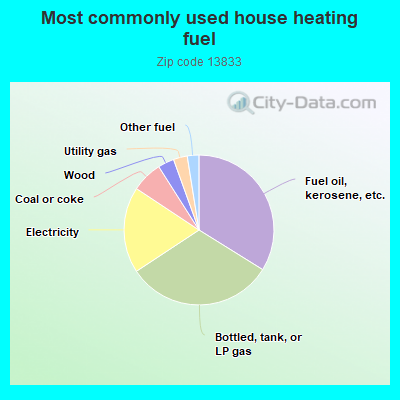
33.9%Fuel oil, kerosene, etc.
31.9%Bottled, tank, or LP gas
18.6%Electricity
6.7%Coal or coke
3.5%Wood
3.0%Utility gas
2.5%Other fuel
Population in 1990: 4,777.
Place of birth for U.S.-born residents:
This state: 3,231
Northeast: 436
Midwest: 120
South: 211
West: 92
66% of the 13833 zip code residents lived in the same house 5 years ago. Out of people who lived in different houses, 70% lived in this county. Out of people who lived in different counties, 50% lived in New York.
91% of the 13833 zip code residents lived in the same house 1 year ago. Out of people who lived in different houses, 48% moved from this county. Out of people who lived in different houses, 34% moved from different county within same state. Out of people who lived in different houses, 18% moved from different state.
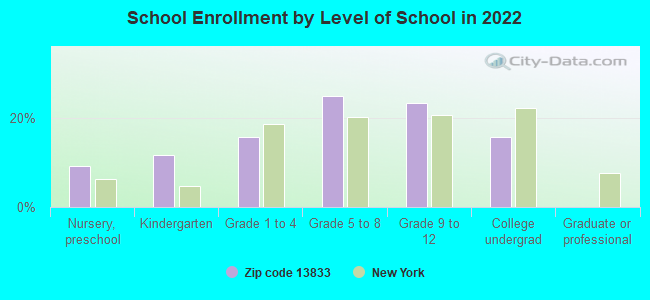
Private vs. public school enrollment:
Students in private schools in grades 1 to 8 (elementary and middle school): 52
Here:
10.7%
New York:
15.6%
Students in private schools in grades 9 to 12 (high school): 10
Here:
3.8%
New York:
15.0%
Students in private undergraduate colleges: 140
Here:
71.8%
New York:
39.2%
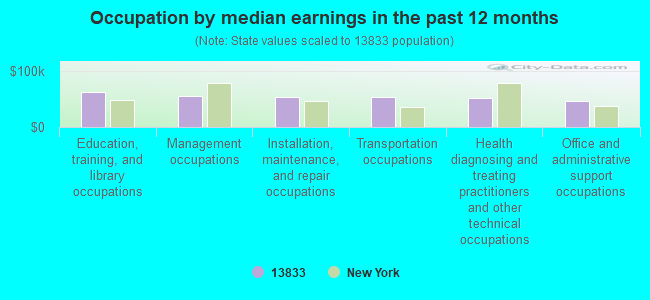
Occupation by median earnings in the past 12 months ($)
62,554Education, training, and library occupations
56,151Management occupations
53,797Installation, maintenance, and repair occupations
52,969Transportation occupations
52,571Health diagnosing and treating practitioners and other technical occupations
46,870Office and administrative support occupations
Companies with federal contracts located in this zip code:
APEX PINNACLE CORP (16 CANAL ST in PORT CRANE, NY; small business) : $17,072,223 in 2510 contractsfrom 1999 to 2006
Contracts for Household Furniture, Brooms, Brushes, Mops, and Sponges, Miscellaneous Items, Safety and Rescue Equipment, and moreby Defense Logistics Agency, Federal Supply Service, Air Force, Navy, and others Signed by year:2000: $185,400; 2001: $123,315; 2002: $1,063,444; 2003: $3,632,098; 2004: $4,006,632; 2005: $5,480,395; 2006: $2,514,394.
Biggest contracts:
$318,000 with Defense Logistics Agency for Household Furniture. Signed on 2002-06-11. Completion date: 2002-07-11.
$278,920, same as above.Signed on 2005-02-18. Completion date: 2005-03-20.
$246,640, same as above.Signed on 2005-09-09. Completion date: 2005-10-10.
$237,660, same as above.Signed on 2004-01-08. Completion date: 2004-02-07.
MAXIMO ENTERPRISES, INC (150 FULLER ROAD in PORT CRANE, NY; small business) : $717,106 in 3 contractsfrom 2000 to 2001
$381,000 with Navy for Armament Training Devices. Signed on 2000-09-27. Completion date: 2001-09-30.
$207,090, same as above.Signed on 2001-10-05. Completion date: 2002-09-30.
$129,016, same as above.Signed on 2000-08-08. Completion date: 2001-01-30.
Top industries in this zip code by the number of employees in 2005:
Wholesale Trade: Automobile and Other Motor Vehicle Merchant Wholesalers (10-19 employees: 1 establishment)
Wholesale Trade: Industrial Machinery and Equipment Merchant Wholesalers (10-19: 1)
Construction: Painting and Wall Covering Contractors (5-9: 1, 1-4: 1)
Administrative and Support and Waste Management and Remediation Services: Solid Waste Collection (5-9: 1)
Construction: All Other Specialty Trade Contractors (1-4: 2)
Other Services (except Public Administration): Religious Organizations (1-4: 2)
Construction: Masonry Contractors (1-4: 2)
Fatal accident statistics in 2014:
Fatal accident count: 1
Vehicles involved in fatal accidents: 1
Fatal accidents caused by drunken drivers: 0
Fatalities: 1
Persons involved in fatal accidents: 2
Pedestrians involved in fatal accidents: 0
Fatal accident statistics in 2013:
Fatal accident count: 1
Vehicles involved in fatal accidents: 2
Fatal accidents caused by drunken drivers: 0
Fatalities: 2
Persons involved in fatal accidents: 5
Pedestrians involved in fatal accidents: 0
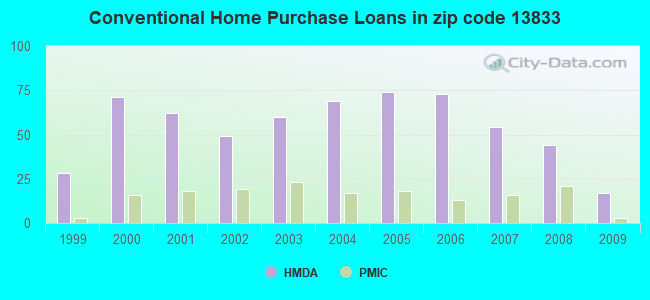
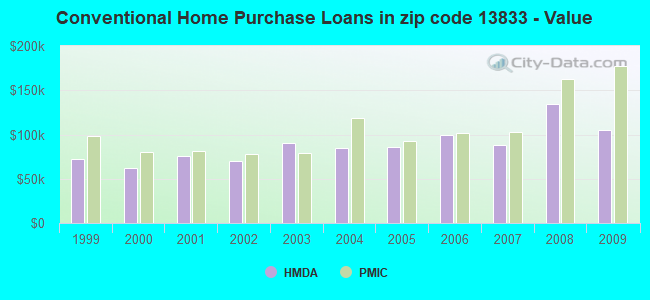
Home Mortgage Disclosure Act Aggregated Statistics For Year 2009 (Based on 4 partial tracts)
A) FHA, FSA/RHS & VA Home Purchase Loans
B) Conventional Home Purchase Loans
C) Refinancings
D) Home Improvement Loans
F) Non-occupant Loans on < 5 Family Dwellings (A B C & D)
G) Loans On Manufactured Home Dwelling (A B C & D)
Number
Average Value
Number
Average Value
Number
Average Value
Number
Average Value
Number
Average Value
Number
Average Value
LOANS ORIGINATED
20
$91,466
17
$105,270
61
$109,062
11
$38,899
1
$60,640
13
$43,634
APPLICATIONS APPROVED, NOT ACCEPTED
4
$89,688
7
$96,843
13
$119,983
2
$23,660
0
$0
3
$21,997
APPLICATIONS DENIED
4
$108,382
15
$84,223
38
$130,082
16
$41,995
3
$109,353
8
$72,270
APPLICATIONS WITHDRAWN
3
$108,300
5
$69,436
24
$110,700
1
$7,540
0
$0
0
$0
FILES CLOSED FOR INCOMPLETENESS
0
$0
2
$93,055
1
$115,710
3
$28,917
0
$0
0
$0
Aggregated Statistics For Year 2008 (Based on 4 partial tracts)
A) FHA, FSA/RHS & VA Home Purchase Loans
B) Conventional Home Purchase Loans
C) Refinancings
D) Home Improvement Loans
F) Non-occupant Loans on < 5 Family Dwellings (A B C & D)
G) Loans On Manufactured Home Dwelling (A B C & D)
Number
Average Value
Number
Average Value
Number
Average Value
Number
Average Value
Number
Average Value
Number
Average Value
LOANS ORIGINATED
13
$113,361
44
$134,698
45
$83,538
36
$20,931
3
$72,443
12
$48,127
APPLICATIONS APPROVED, NOT ACCEPTED
3
$143,240
11
$112,272
18
$61,832
3
$17,507
1
$120,630
6
$63,663
APPLICATIONS DENIED
3
$109,333
20
$79,960
55
$90,247
35
$16,158
4
$44,410
16
$71,445
APPLICATIONS WITHDRAWN
2
$70,640
2
$46,055
17
$106,719
6
$58,630
1
$32,450
3
$48,293
FILES CLOSED FOR INCOMPLETENESS
0
$0
2
$34,905
3
$113,527
2
$47,705
0
$0
0
$0
Aggregated Statistics For Year 2007 (Based on 4 partial tracts)
A) FHA, FSA/RHS & VA Home Purchase Loans
B) Conventional Home Purchase Loans
C) Refinancings
D) Home Improvement Loans
F) Non-occupant Loans on < 5 Family Dwellings (A B C & D)
G) Loans On Manufactured Home Dwelling (A B C & D)
Number
Average Value
Number
Average Value
Number
Average Value
Number
Average Value
Number
Average Value
Number
Average Value
LOANS ORIGINATED
12
$141,628
54
$88,540
78
$89,403
40
$25,609
8
$90,642
23
$55,193
APPLICATIONS APPROVED, NOT ACCEPTED
0
$0
12
$64,827
11
$83,911
9
$72,904
10
$77,660
7
$57,163
APPLICATIONS DENIED
3
$95,760
31
$77,391
63
$90,837
38
$33,488
9
$91,629
23
$53,237
APPLICATIONS WITHDRAWN
1
$94,080
9
$105,283
45
$96,705
15
$61,519
8
$103,129
3
$66,260
FILES CLOSED FOR INCOMPLETENESS
0
$0
3
$88,850
8
$61,958
0
$0
2
$54,415
2
$78,860
Aggregated Statistics For Year 2006 (Based on 4 partial tracts)
A) FHA, FSA/RHS & VA Home Purchase Loans
B) Conventional Home Purchase Loans
C) Refinancings
D) Home Improvement Loans
E) Loans on Dwellings For 5+ Families
F) Non-occupant Loans on < 5 Family Dwellings (A B C & D)
G) Loans On Manufactured Home Dwelling (A B C & D)
Number
Average Value
Number
Average Value
Number
Average Value
Number
Average Value
Number
Average Value
Number
Average Value
Number
Average Value
LOANS ORIGINATED
6
$91,533
73
$99,564
98
$71,523
39
$25,188
0
$0
3
$101,617
12
$55,269
APPLICATIONS APPROVED, NOT ACCEPTED
2
$23,660
7
$114,270
14
$74,835
10
$23,201
0
$0
1
$27,860
2
$56,875
APPLICATIONS DENIED
0
$0
21
$85,126
77
$93,232
39
$14,570
2
$118,290
4
$73,400
15
$39,699
APPLICATIONS WITHDRAWN
0
$0
6
$40,277
76
$72,100
7
$71,597
0
$0
2
$27,150
3
$67,273
FILES CLOSED FOR INCOMPLETENESS
2
$46,525
2
$160,875
8
$110,388
0
$0
0
$0
0
$0
2
$47,315
Aggregated Statistics For Year 2005 (Based on 4 partial tracts)
A) FHA, FSA/RHS & VA Home Purchase Loans
B) Conventional Home Purchase Loans
C) Refinancings
D) Home Improvement Loans
F) Non-occupant Loans on < 5 Family Dwellings (A B C & D)
G) Loans On Manufactured Home Dwelling (A B C & D)
Number
Average Value
Number
Average Value
Number
Average Value
Number
Average Value
Number
Average Value
Number
Average Value
LOANS ORIGINATED
8
$96,784
74
$85,516
90
$78,192
40
$24,920
4
$48,390
14
$39,513
APPLICATIONS APPROVED, NOT ACCEPTED
0
$0
11
$90,291
20
$72,352
9
$35,837
0
$0
6
$62,942
APPLICATIONS DENIED
0
$0
15
$57,028
100
$76,618
24
$33,557
5
$49,606
11
$48,683
APPLICATIONS WITHDRAWN
0
$0
8
$104,888
62
$100,951
14
$291,442
3
$68,020
2
$59,005
FILES CLOSED FOR INCOMPLETENESS
0
$0
3
$131,433
19
$112,972
2
$114,320
0
$0
0
$0
Aggregated Statistics For Year 2004 (Based on 4 partial tracts)
A) FHA, FSA/RHS & VA Home Purchase Loans
B) Conventional Home Purchase Loans
C) Refinancings
D) Home Improvement Loans
F) Non-occupant Loans on < 5 Family Dwellings (A B C & D)
G) Loans On Manufactured Home Dwelling (A B C & D)
Number
Average Value
Number
Average Value
Number
Average Value
Number
Average Value
Number
Average Value
Number
Average Value
LOANS ORIGINATED
9
$83,957
69
$84,435
86
$81,558
41
$36,087
10
$39,475
14
$48,804
APPLICATIONS APPROVED, NOT ACCEPTED
2
$35,890
15
$63,567
10
$58,137
4
$24,685
0
$0
5
$42,444
APPLICATIONS DENIED
1
$60,970
16
$42,278
65
$71,654
29
$20,598
3
$34,700
11
$42,141
APPLICATIONS WITHDRAWN
0
$0
6
$152,535
58
$79,883
5
$55,288
2
$27,910
2
$72,800
FILES CLOSED FOR INCOMPLETENESS
0
$0
2
$63,685
26
$115,848
0
$0
1
$41,960
0
$0
Aggregated Statistics For Year 2003 (Based on 4 partial tracts)
A) FHA, FSA/RHS & VA Home Purchase Loans
B) Conventional Home Purchase Loans
C) Refinancings
D) Home Improvement Loans
F) Non-occupant Loans on < 5 Family Dwellings (A B C & D)
Number
Average Value
Number
Average Value
Number
Average Value
Number
Average Value
Number
Average Value
LOANS ORIGINATED
8
$94,161
60
$90,561
187
$78,158
24
$14,510
10
$55,223
APPLICATIONS APPROVED, NOT ACCEPTED
0
$0
7
$75,011
20
$64,902
2
$63,875
1
$55,400
APPLICATIONS DENIED
3
$51,563
18
$78,981
114
$68,609
13
$18,095
1
$82,610
APPLICATIONS WITHDRAWN
2
$124,155
7
$129,776
42
$78,360
1
$35,070
0
$0
FILES CLOSED FOR INCOMPLETENESS
0
$0
2
$99,585
6
$131,658
1
$70,480
0
$0
Aggregated Statistics For Year 2002 (Based on 4 partial tracts)
A) FHA, FSA/RHS & VA Home Purchase Loans
B) Conventional Home Purchase Loans
C) Refinancings
D) Home Improvement Loans
F) Non-occupant Loans on < 5 Family Dwellings (A B C & D)
Number
Average Value
Number
Average Value
Number
Average Value
Number
Average Value
Number
Average Value
LOANS ORIGINATED
17
$75,280
49
$70,477
111
$76,478
41
$19,055
8
$51,654
APPLICATIONS APPROVED, NOT ACCEPTED
0
$0
16
$53,746
28
$63,809
3
$6,610
5
$53,940
APPLICATIONS DENIED
2
$82,550
21
$38,947
87
$72,612
26
$10,734
0
$0
APPLICATIONS WITHDRAWN
2
$48,895
5
$98,156
31
$64,609
8
$13,682
0
$0
FILES CLOSED FOR INCOMPLETENESS
0
$0
0
$0
9
$86,326
3
$24,710
0
$0
Aggregated Statistics For Year 2001 (Based on 4 partial tracts)
A) FHA, FSA/RHS & VA Home Purchase Loans
B) Conventional Home Purchase Loans
C) Refinancings
D) Home Improvement Loans
F) Non-occupant Loans on < 5 Family Dwellings (A B C & D)
Number
Average Value
Number
Average Value
Number
Average Value
Number
Average Value
Number
Average Value
LOANS ORIGINATED
15
$64,373
62
$75,552
105
$69,923
54
$12,685
2
$53,260
APPLICATIONS APPROVED, NOT ACCEPTED
2
$30,070
14
$54,922
15
$65,527
4
$48,960
1
$52,120
APPLICATIONS DENIED
2
$47,565
39
$42,435
47
$39,505
32
$8,835
0
$0
APPLICATIONS WITHDRAWN
2
$39,430
4
$97,882
30
$74,490
12
$13,885
2
$7,885
FILES CLOSED FOR INCOMPLETENESS
0
$0
0
$0
6
$78,835
0
$0
0
$0
Aggregated Statistics For Year 2000 (Based on 4 partial tracts)
A) FHA, FSA/RHS & VA Home Purchase Loans
B) Conventional Home Purchase Loans
C) Refinancings
D) Home Improvement Loans
F) Non-occupant Loans on < 5 Family Dwellings (A B C & D)
Number
Average Value
Number
Average Value
Number
Average Value
Number
Average Value
Number
Average Value
LOANS ORIGINATED
22
$75,722
71
$61,955
60
$52,520
34
$24,925
2
$14,770
APPLICATIONS APPROVED, NOT ACCEPTED
5
$85,684
16
$33,666
24
$38,753
2
$6,310
0
$0
APPLICATIONS DENIED
1
$56,050
66
$41,983
47
$49,515
32
$15,218
1
$16,390
APPLICATIONS WITHDRAWN
0
$0
3
$56,217
26
$65,431
2
$11,040
0
$0
FILES CLOSED FOR INCOMPLETENESS
0
$0
2
$59,145
9
$73,128
2
$35,485
0
$0
Aggregated Statistics For Year 1999 (Based on 2 partial tracts)
A) FHA, FSA/RHS & VA Home Purchase Loans
B) Conventional Home Purchase Loans
C) Refinancings
D) Home Improvement Loans
E) Loans on Dwellings For 5+ Families
F) Non-occupant Loans on < 5 Family Dwellings (A B C & D)


 Nearest zip codes: 13904, 13787, 13901, 13746, 13795, 13744.