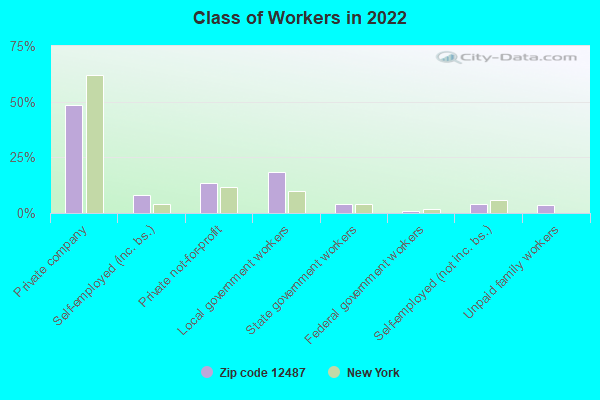
Estimated zip code population in 2022: 3,872 Zip code population in 2010: 3,268 Zip code population in 2000: 3,856
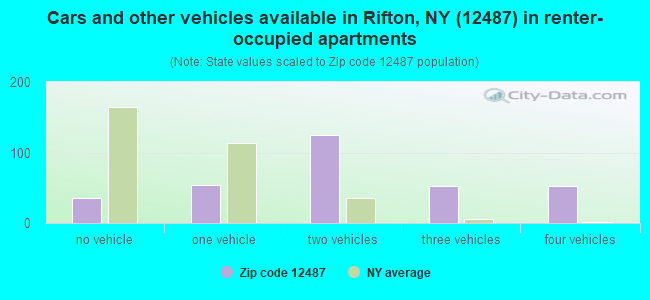
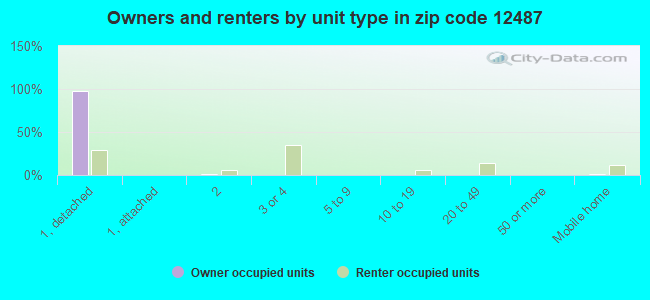
Houses and condos: 1,586 Renter-occupied apartments: 322
% of renters here:
22%
State:
46%
March 2022 cost of living index in zip code 12487: 97.5 (near average, U.S. average is 100)
Land area: 15.7 sq. mi. Water area: 0.3 sq. mi.
Population density: 247 people per square mile
(very low).
OSM Map
General Map
Google Map
MSN Map
OSM Map
General Map
Google Map
MSN Map
OSM Map
General Map
Google Map
MSN Map
OSM Map
General Map
Google Map
MSN Map
Please wait while loading the map...
Real estate property taxes paid for housing units in 2022:
This zip code:
2.1% ($5,918)
New York:
1.5% ($6,180)
Median real estate property taxes paid for housing units with mortgages in 2022: $7,412 (1.8%) Median real estate property taxes paid for housing units with no mortgage in 2022: $4,515 (1.9%)
Averages for the 2020 tax year for zip code 12487, filed in 2021:
Average Adjusted Gross Income (AGI) in 2020: $65,777 (Individual Income Tax Returns)
Here:
$65,777
State:
$90,930
Salary/wage: $58,137 (reported on 73.4% of returns)
Here:
$58,137
State:
$72,104
(% of AGI for various income ranges: 1224.3% for AGIs below $25k, 3489.3% for AGIs $25k-50k, 5738.6% for AGIs $50k-75k, 8948.0% for AGIs $75k-100k, 14627.8% for AGIs $100k-200k)
Taxable interest for individuals: $824 (reported on 40.9% of returns)
This zip code:
$824
New York:
$3,075
(% of AGI for various income ranges: 36.5% for AGIs below $25k, 27.4% for AGIs $25k-50k, 72.1% for AGIs $50k-75k, 69.0% for AGIs $75k-100k, 68.9% for AGIs $100k-200k)
Ordinary dividends: $11,085 (reported on 31.2% of returns)
Here:
$11,085
State:
$11,095
(% of AGI for various income ranges: 523.5% for AGIs below $25k, 561.5% for AGIs $25k-50k, 576.4% for AGIs $50k-75k, 336.0% for AGIs $75k-100k, 201.1% for AGIs $100k-200k)
Net capital gain/loss in AGI: +$14,854 (reported on 16.9% of returns)
Here:
+$14,854
State:
+$44,925
(% of AGI for various income ranges: 11.3% for AGIs below $25k, 30.7% for AGIs $25k-50k, 154.3% for AGIs $50k-75k, 267.0% for AGIs $75k-100k, 273.3% for AGIs $100k-200k)
Profit/loss from business: +$12,171 (reported on 13.6% of returns)
Here:
+$12,171
State:
+$14,940
(% of AGI for various income ranges: 68.7% for AGIs below $25k, 140.7% for AGIs $25k-50k, 129.3% for AGIs $50k-75k, 354.0% for AGIs $75k-100k, 823.9% for AGIs $100k-200k)
Taxable individual retirement arrangement distribution: $14,500 (reported on 10.4% of returns)
12487:
$14,500
New York:
$19,609
(% of AGI for various income ranges: 62.2% for AGIs below $25k, 138.9% for AGIs $25k-50k, 118.6% for AGIs $50k-75k, 484.0% for AGIs $75k-100k, 640.0% for AGIs $100k-200k)
Total itemized deductions: $25,291 (reported on 7.1% of returns)
Here:
$25,291
State:
$39,326
(% of AGI for various income ranges: 281.1% for AGIs $25k-50k, 525.0% for AGIs $75k-100k, 832.2% for AGIs $100k-200k)
Charity contributions: $4,512 (reported on 5.2% of returns)
Here:
$4,512
State:
$15,420
(% of AGI for various income ranges: 40.0% for AGIs $50k-75k, 169.4% for AGIs $100k-200k)
Taxes paid: $8,782 (reported on 7.1% of returns)
12487:
$8,782
State:
$9,183
(% of AGI for various income ranges: 84.8% for AGIs $25k-50k, 187.0% for AGIs $75k-100k, 305.6% for AGIs $100k-200k)
Earned income credit: $1,792 (reported on 7.8% of returns)
Here:
$1,792
State:
$2,138
(% of AGI for various income ranges: 59.6% for AGIs below $25k, 28.9% for AGIs $25k-50k)
Percentage of individuals using paid preparers for their 2020 taxes: 96.1%
Here:
96%
State:
95%
(% for various income ranges: 93.5% for AGIs below $25k, 97.4% for AGIs $25k-50k, 100.0% for AGIs $50k-75k, 93.8% for AGIs $75k-100k, 96.2% for AGIs $100k-200k, 100.0% for AGIs over 200k)
Averages for the 2012 tax year for zip code 12487, filed in 2013:
Average Adjusted Gross Income (AGI) in 2012: $57,687 (Individual Income Tax Returns)
Here:
$57,687
State:
$77,088
Salary/wage: $51,410 (reported on 76.5% of returns)
Here:
$51,410
State:
$60,593
(% of AGI for various income ranges: 60.2% for AGIs below $25k, 70.4% for AGIs $25k-50k, 67.5% for AGIs $50k-75k, 66.0% for AGIs $75k-100k, 80.6% for AGIs $100k-200k, 50.4% for AGIs over 200k)
Taxable interest for individuals: $618 (reported on 48.5% of returns)
This zip code:
$618
New York:
$3,125
(% of AGI for various income ranges: 0.6% for AGIs below $25k, 0.8% for AGIs $25k-50k, 0.7% for AGIs $50k-75k, 0.7% for AGIs $75k-100k, 0.2% for AGIs $100k-200k, 0.3% for AGIs over 200k)
Ordinary dividends: $10,045 (reported on 36.0% of returns)
Here:
$10,045
State:
$10,299
(% of AGI for various income ranges: 19.6% for AGIs below $25k, 7.4% for AGIs $25k-50k, 7.8% for AGIs $50k-75k, 8.9% for AGIs $75k-100k, 1.1% for AGIs $100k-200k, 3.5% for AGIs over 200k)
Net capital gain/loss in AGI: +$2,029 (reported on 17.6% of returns)
Here:
+$2,029
State:
+$42,474
(% of AGI for various income ranges: 0.3% for AGIs $50k-75k, 0.3% for AGIs $75k-100k, 2.0% for AGIs $100k-200k)
Profit/loss from business: +$8,975 (reported on 14.7% of returns)
Here:
+$8,975
State:
+$16,168
(% of AGI for various income ranges: 4.4% for AGIs below $25k, 2.0% for AGIs $25k-50k, 0.4% for AGIs $50k-75k, 0.7% for AGIs $75k-100k, 5.1% for AGIs $100k-200k)
Taxable individual retirement arrangement distribution: $10,736 (reported on 8.1% of returns)
12487:
$10,736
New York:
$17,621
(% of AGI for various income ranges: 1.7% for AGIs below $25k, 2.9% for AGIs $25k-50k, 2.8% for AGIs $75k-100k, 1.8% for AGIs $100k-200k)
Total itemized deductions: $22,777 (23% of AGI, reported on 38.2% of returns)
Here:
$22,777
State:
$34,985
Here:
22.8% of AGI
State:
21.3% of AGI
(% of AGI for various income ranges: 8.8% for AGIs below $25k, 12.8% for AGIs $25k-50k, 15.0% for AGIs $50k-75k, 15.5% for AGIs $75k-100k, 17.3% for AGIs $100k-200k, 16.0% for AGIs over 200k)
Charity contributions: $2,621 (reported on 31.6% of returns)
Here:
$2,621
State:
$5,572
(% of AGI for various income ranges: 0.8% for AGIs below $25k, 1.3% for AGIs $25k-50k, 0.9% for AGIs $50k-75k, 1.4% for AGIs $75k-100k, 1.9% for AGIs $100k-200k, 1.7% for AGIs over 200k)
Taxes paid: $12,648 (reported on 38.2% of returns)
12487:
$12,648
State:
$18,656
(% of AGI for various income ranges: 3.6% for AGIs below $25k, 5.6% for AGIs $25k-50k, 7.2% for AGIs $50k-75k, 8.9% for AGIs $75k-100k, 9.9% for AGIs $100k-200k, 11.2% for AGIs over 200k)
Earned income credit: $1,857 (reported on 10.3% of returns)
Here:
$1,857
State:
$2,230
(% of AGI for various income ranges: 3.2% for AGIs below $25k, 0.5% for AGIs $25k-50k)
Percentage of individuals using paid preparers for their 2012 taxes: 61.8%
Here:
62%
State:
66%
(% for various income ranges: 58.8% for AGIs below $25k, 58.6% for AGIs $25k-50k, 61.9% for AGIs $50k-75k, 66.7% for AGIs $75k-100k, 64.7% for AGIs $100k-200k, 100.0% for AGIs over 200k)
Averages for the 2004 tax year for zip code 12487, filed in 2005:
Average Adjusted Gross Income (AGI) in 2004: $48,255 (Individual Income Tax Returns)
Here:
$48,255
State:
$59,519
Salary/wage: $44,890 (reported on 84.0% of returns)
Here:
$44,890
State:
$50,673
(% of AGI for various income ranges: 122.9% for AGIs below $10k, 68.6% for AGIs $10k-25k, 82.0% for AGIs $25k-50k, 82.9% for AGIs $50k-75k, 82.8% for AGIs $75k-100k, 70.7% for AGIs over 100k)
Taxable interest for individuals: $879 (reported on 59.9% of returns)
This zip code:
$879
New York:
$2,377
(% of AGI for various income ranges: 3.1% for AGIs below $10k, 2.9% for AGIs $10k-25k, 1.1% for AGIs $25k-50k, 0.9% for AGIs $50k-75k, 0.7% for AGIs $75k-100k, 1.0% for AGIs over 100k)
Taxable dividends: $2,309 (reported on 35.4% of returns)
Here:
$2,309
State:
$5,394
(% of AGI for various income ranges: 11.7% for AGIs below $10k, 3.6% for AGIs $10k-25k, 1.2% for AGIs $25k-50k, 0.8% for AGIs $50k-75k, 0.4% for AGIs $75k-100k, 2.5% for AGIs over 100k)
Net capital gain/loss: +$6,328 (reported on 20.3% of returns)
Here:
+$6,328
State:
+$23,581
(% of AGI for various income ranges: -2.1% for AGIs below $10k, 0.7% for AGIs $10k-25k, 0.4% for AGIs $25k-50k, 0.9% for AGIs $50k-75k, 3.2% for AGIs $75k-100k, 5.3% for AGIs over 100k)
Profit/loss from business: +$7,452 (reported on 16.2% of returns)
Here:
+$7,452
State:
+$13,809
(% of AGI for various income ranges: 13.9% for AGIs below $10k, 5.3% for AGIs $10k-25k, 3.5% for AGIs $25k-50k, 1.9% for AGIs $50k-75k, 1.0% for AGIs $75k-100k, 2.3% for AGIs over 100k)
IRA payment deduction: $3,081 (reported on 3.0% of returns)
12487:
$3,081
New York:
$3,115
Total itemized deductions: $18,801 (23% of AGI, reported on 41.4% of returns)
Here:
$18,801
State:
$25,864
Here:
22.7% of AGI
State:
21.9% of AGI
(% of AGI for various income ranges: 13.9% for AGIs below $10k, 11.1% for AGIs $10k-25k, 13.1% for AGIs $25k-50k, 15.6% for AGIs $50k-75k, 18.1% for AGIs $75k-100k, 18.1% for AGIs over 100k)
Charity contributions deductions: $2,374 (3% of AGI, reported on 38.3% of returns)
Here:
$2,374
State:
$4,439
Here:
2.8% of AGI
State:
3.6% of AGI
(% of AGI for various income ranges: 1.1% for AGIs $10k-25k, 1.2% for AGIs $25k-50k, 1.4% for AGIs $50k-75k, 1.9% for AGIs $75k-100k, 2.8% for AGIs over 100k)
Total tax: $6,565 (reported on 80.7% of returns)
12487:
$6,565
State:
$11,730
(% of AGI for various income ranges: 4.0% for AGIs below $10k, 4.7% for AGIs $10k-25k, 7.3% for AGIs $25k-50k, 8.5% for AGIs $50k-75k, 9.8% for AGIs $75k-100k, 16.9% for AGIs over 100k)
Earned income credit: $1,286 (reported on 9.2% of returns)
Here:
$1,286
State:
$1,757
Percentage of individuals using paid preparers for their 2004 taxes: 58.2%
Here:
58%
State:
67%
(% for various income ranges: 46.2% for AGIs below $10k, 56.6% for AGIs $10k-25k, 54.4% for AGIs $25k-50k, 66.0% for AGIs $50k-75k, 64.3% for AGIs $75k-100k, 73.7% for AGIs over 100k)
Household received Food Stamps/SNAP in the past 12 months: 39 Household did not receive Food Stamps/SNAP in the past 12 months: 1,390
Women who had a birth in the past 12 months: 14 (14 now married, 0 unmarried) Women who did not have a birth in the past 12 months: 735 (292 now married, 441 unmarried)
Housing units in zip code 12487 with a mortgage: 537 (120 second mortgage, 110 both second mortgage and home equity loan) Houses without a mortgage: 23
Median monthly owner costs for units with a mortgage: $2,369 Median monthly owner costs for units without a mortgage: $700
Residents with income below the poverty level in 2022:
This zip code:
16.9%
Whole state:
14.3%
Residents with income below 50% of the poverty level in 2022:
This zip code:
0.9%
Whole state:
6.8%
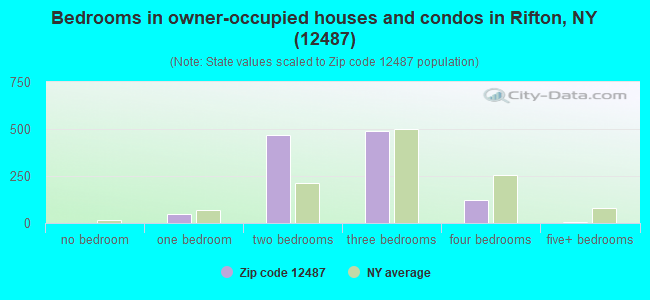
Median number of rooms in houses and condos:
Here:
5.8
State:
6.3
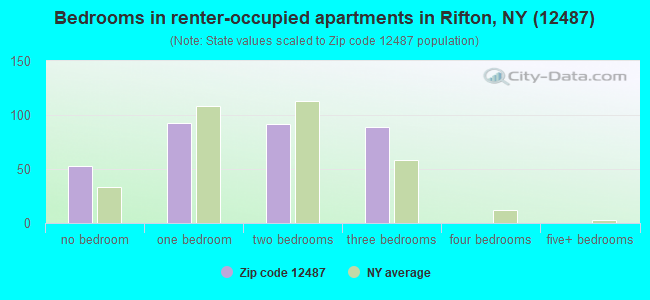
Median number of rooms in apartments:
Here:
3.9
State:
3.8
Notable locations in this zip code not listed on our city pages
Notable locations in zip code 12487: Apple Bin Farm (A), El Paso Winery (B), Camp Chi-Wan-Da (C), Maynard Farms (D), Saint Remy Fire Department (E), Rifton Fire District Station 1 (F). Display/hide their locations on the map
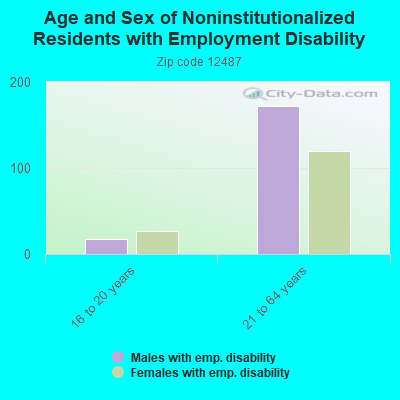
In group quarters: 573 (-1 institutionalized population)
Size of family households: 552 2-persons, 236 3-persons, 62 4-persons, 18 5-persons, 70 7-or-more-persons
Size of nonfamily households: 347 1-person, 141 2-persons, 32 3-persons
187 married couples with children.
140 single-parent households (17 men, 123 women).
96.5% of residents of 12487 zip code speak English at home.
1.2% of residents speak Spanish at home (100% very well).
1.9% of residents speak other Indo-European language at home (79% very well, 21% well).
0.2% of residents speak Asian or Pacific Island language at home (100% well).
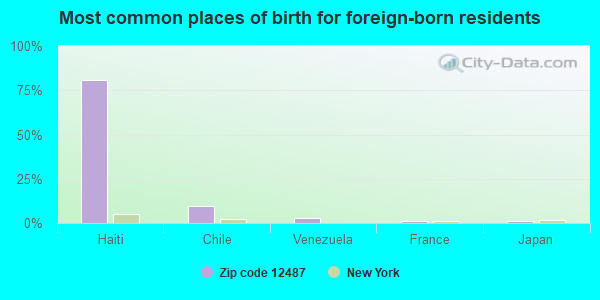
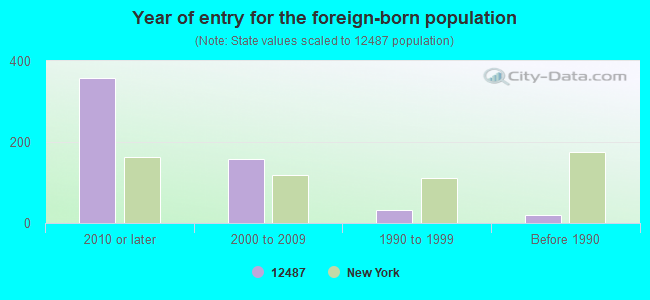
Foreign born population: 461 (11.9%) (57.0% of them are naturalized citizens)
This zip code:
11.9%
Whole state:
22.7%
81%Haiti
10%Chile
3%Venezuela
1%France
1%Japan
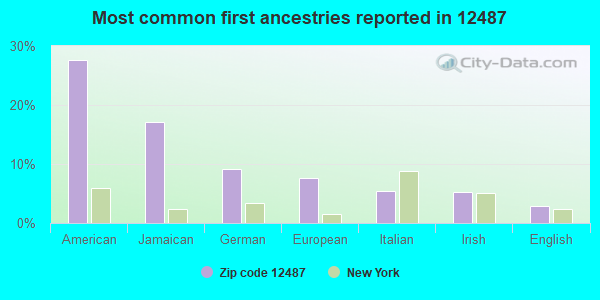
28%American
17%Jamaican
9%German
8%European
5%Italian
5%Irish
3%English
Year of entry for the foreign-born population
3582010 or later
1592000 to 2009
331990 to 1999
19Before 1990
Facilities with environmental interests located in this zip code:
ANNA DEVINE SCHOOL ( in ULSTER PARK, NY)
(National Center for Education Statistics) - STATE ID-620600010009 Organizations: KINGSTON CITY SD (SCHOOL DISTRICT)
Housing units lacking complete plumbing facilities: 1.2% Housing units lacking complete kitchen facilities: 0.5%
42.5%Fuel oil, kerosene, etc.
17.3%Bottled, tank, or LP gas
15.7%Electricity
13.1%Wood
9.0%Utility gas
1.5%Other fuel
1.1%Solar energy
Population in 1990: 3,625. Population change in the 1990s: +231 (+6.4%).
Place of birth for U.S.-born residents:
This state: 2,767
Northeast: 252
Midwest: 48
South: 170
West: 95
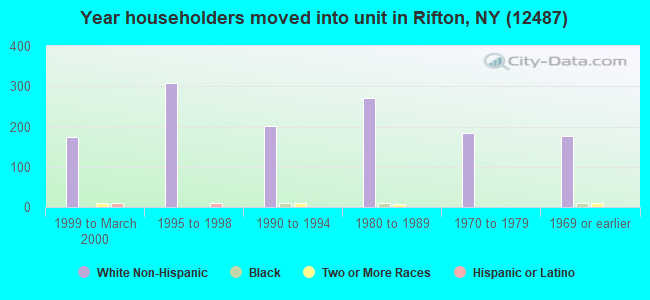
68% of the 12487 zip code residents lived in the same house 5 years ago. Out of people who lived in different houses, 60% lived in this county. Out of people who lived in different counties, 50% lived in New York.
95% of the 12487 zip code residents lived in the same house 1 year ago. Out of people who lived in different houses, 59% moved from this county. Out of people who lived in different houses, 38% moved from different county within same state.
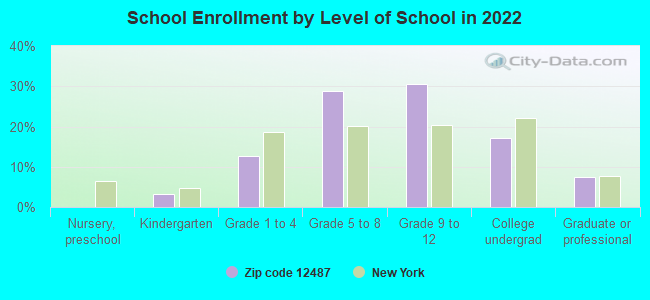
Private vs. public school enrollment:
Students in private schools in grades 1 to 8 (elementary and middle school): 155
Here:
50.7%
New York:
15.6%
Students in private schools in grades 9 to 12 (high school): 70
Here:
31.7%
New York:
15.0%
Students in private undergraduate colleges: 26
Here:
21.5%
New York:
39.2%
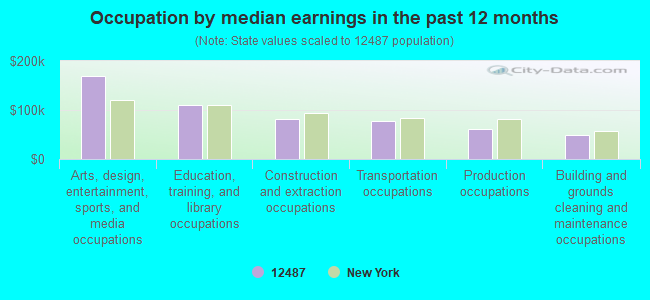
Occupation by median earnings in the past 12 months ($)
168,961Arts, design, entertainment, sports, and media occupations
110,279Education, training, and library occupations
81,358Construction and extraction occupations
77,970Transportation occupations
61,102Production occupations
49,536Building and grounds cleaning and maintenance occupations
Top industries in this zip code by the number of employees in 2005:
Construction: All Other Specialty Trade Contractors (10-19 employees: 1 establishment, 5-9 employees: 1 establishment)
Health Care and Social Assistance: Residential Mental Health and Substance Abuse Facilities (5-9: 1)
Construction: Glass and Glazing Contractors (5-9: 1)
Accommodation and Food Services: Full-Service Restaurants (5-9: 1)
Construction: Electrical Contractors (1-4: 2)
Administrative and Support and Waste Management and Remediation Services: Landscaping Services (1-4: 2)
Arts, Entertainment, and Recreation: All Other Amusement and Recreation Industries (1-4: 2)
People in group quarters in 2010:
317 people in other noninstitutional facilities
People in group quarters in 2000:
394 people in religious group quarters
15 people in other noninstitutional group quarters
Fatal accident statistics in 2014:
Fatal accident count: 1
Vehicles involved in fatal accidents: 1
Fatal accidents caused by drunken drivers: 1
Fatalities: 1
Persons involved in fatal accidents: 1
Pedestrians involved in fatal accidents: 0
Home Mortgage Disclosure Act Aggregated Statistics For Year 2009 (Based on 4 partial tracts)
A) FHA, FSA/RHS & VA Home Purchase Loans
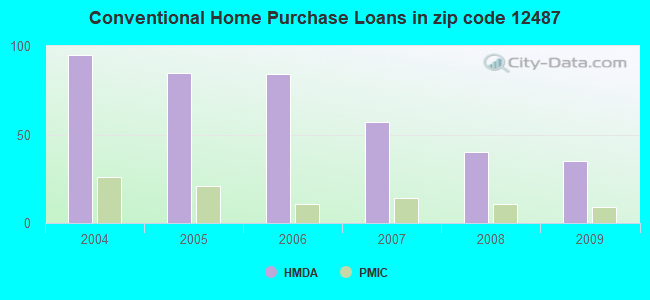
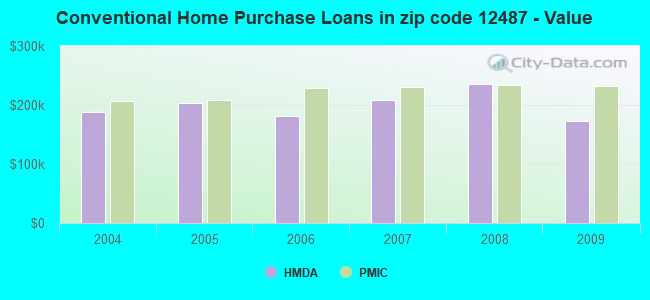
B) Conventional Home Purchase Loans
C) Refinancings
D) Home Improvement Loans
E) Loans on Dwellings For 5+ Families
F) Non-occupant Loans on < 5 Family Dwellings (A B C & D)
G) Loans On Manufactured Home Dwelling (A B C & D)
Number
Average Value
Number
Average Value
Number
Average Value
Number
Average Value
Number
Average Value
Number
Average Value
Number
Average Value
LOANS ORIGINATED
12
$222,327
35
$172,058
93
$170,782
19
$52,595
1
$9,644,670
8
$202,659
1
$50,510
APPLICATIONS APPROVED, NOT ACCEPTED
1
$221,510
1
$1,797,080
12
$231,735
3
$237,597
0
$0
1
$1,781,150
0
$0
APPLICATIONS DENIED
3
$180,733
5
$215,954
45
$227,023
8
$83,200
1
$244,270
3
$267,343
1
$26,440
APPLICATIONS WITHDRAWN
2
$270,540
9
$179,459
30
$201,443
2
$127,225
0
$0
1
$57,000
0
$0
FILES CLOSED FOR INCOMPLETENESS
0
$0
0
$0
1
$230,680
0
$0
0
$0
0
$0
0
$0
Aggregated Statistics For Year 2008 (Based on 4 partial tracts)
A) FHA, FSA/RHS & VA Home Purchase Loans
B) Conventional Home Purchase Loans
C) Refinancings
D) Home Improvement Loans
F) Non-occupant Loans on < 5 Family Dwellings (A B C & D)
G) Loans On Manufactured Home Dwelling (A B C & D)
Number
Average Value
Number
Average Value
Number
Average Value
Number
Average Value
Number
Average Value
Number
Average Value
LOANS ORIGINATED
8
$242,339
40
$236,131
56
$207,179
28
$80,984
5
$206,988
2
$82,770
APPLICATIONS APPROVED, NOT ACCEPTED
0
$0
4
$183,085
8
$197,009
0
$0
0
$0
1
$116,030
APPLICATIONS DENIED
6
$305,612
5
$113,920
51
$179,688
23
$59,324
3
$211,617
1
$65,770
APPLICATIONS WITHDRAWN
1
$122,720
5
$467,640
22
$221,553
4
$66,412
2
$142,490
1
$133,330
FILES CLOSED FOR INCOMPLETENESS
0
$0
0
$0
4
$166,208
1
$198,470
0
$0
0
$0
Aggregated Statistics For Year 2007 (Based on 4 partial tracts)
A) FHA, FSA/RHS & VA Home Purchase Loans
B) Conventional Home Purchase Loans
C) Refinancings
D) Home Improvement Loans
E) Loans on Dwellings For 5+ Families
F) Non-occupant Loans on < 5 Family Dwellings (A B C & D)
G) Loans On Manufactured Home Dwelling (A B C & D)
Number
Average Value
Number
Average Value
Number
Average Value
Number
Average Value
Number
Average Value
Number
Average Value
Number
Average Value
LOANS ORIGINATED
2
$202,540
57
$208,182
67
$163,032
38
$79,339
2
$796,730
8
$179,264
3
$40,693
APPLICATIONS APPROVED, NOT ACCEPTED
0
$0
13
$214,286
26
$168,310
8
$128,066
0
$0
0
$0
0
$0
APPLICATIONS DENIED
1
$255,470
16
$169,681
65
$200,196
24
$109,130
0
$0
5
$293,240
4
$45,265
APPLICATIONS WITHDRAWN
0
$0
3
$180,530
30
$162,279
5
$161,278
0
$0
2
$174,555
0
$0
FILES CLOSED FOR INCOMPLETENESS
0
$0
1
$68,820
7
$249,463
1
$76,340
0
$0
0
$0
0
$0
Aggregated Statistics For Year 2006 (Based on 4 partial tracts)
A) FHA, FSA/RHS & VA Home Purchase Loans
B) Conventional Home Purchase Loans
C) Refinancings
D) Home Improvement Loans
F) Non-occupant Loans on < 5 Family Dwellings (A B C & D)
G) Loans On Manufactured Home Dwelling (A B C & D)
Number
Average Value
Number
Average Value
Number
Average Value
Number
Average Value
Number
Average Value
Number
Average Value
LOANS ORIGINATED
1
$223,920
84
$181,262
98
$171,411
49
$54,781
17
$146,648
3
$48,960
APPLICATIONS APPROVED, NOT ACCEPTED
1
$152,670
10
$139,454
21
$155,949
6
$45,405
2
$54,080
0
$0
APPLICATIONS DENIED
1
$227,990
17
$183,681
67
$211,560
24
$70,266
4
$179,858
4
$44,430
APPLICATIONS WITHDRAWN
1
$90,580
5
$200,262
49
$178,498
12
$104,117
2
$120,395
2
$96,180
FILES CLOSED FOR INCOMPLETENESS
1
$206,610
3
$164,523
19
$184,568
2
$22,050
1
$20,360
0
$0
Aggregated Statistics For Year 2005 (Based on 4 partial tracts)
A) FHA, FSA/RHS & VA Home Purchase Loans
B) Conventional Home Purchase Loans
C) Refinancings
D) Home Improvement Loans
E) Loans on Dwellings For 5+ Families
F) Non-occupant Loans on < 5 Family Dwellings (A B C & D)
G) Loans On Manufactured Home Dwelling (A B C & D)
Number
Average Value
Number
Average Value
Number
Average Value
Number
Average Value
Number
Average Value
Number
Average Value
Number
Average Value
LOANS ORIGINATED
1
$195,370
85
$202,879
136
$160,997
48
$72,716
1
$1,781,150
13
$168,999
3
$79,037
APPLICATIONS APPROVED, NOT ACCEPTED
1
$164,880
12
$140,528
22
$140,105
2
$66,655
0
$0
2
$214,880
5
$85,902
APPLICATIONS DENIED
0
$0
25
$183,864
59
$173,228
18
$47,224
0
$0
3
$146,563
9
$76,140
APPLICATIONS WITHDRAWN
0
$0
5
$149,944
64
$172,256
6
$103,858
0
$0
1
$204,900
4
$133,588
FILES CLOSED FOR INCOMPLETENESS
0
$0
2
$112,270
22
$199,528
2
$55,980
1
$64,070
1
$81,420
0
$0
Aggregated Statistics For Year 2004 (Based on 4 partial tracts)
A) FHA, FSA/RHS & VA Home Purchase Loans
B) Conventional Home Purchase Loans
C) Refinancings
D) Home Improvement Loans
F) Non-occupant Loans on < 5 Family Dwellings (A B C & D)
G) Loans On Manufactured Home Dwelling (A B C & D)


 Nearest zip codes: 12417, 12429, 12466, 12411, 12471, 12574.