Estimated zip code population in 2022: 30,250 Zip code population in 2010: 31,521 Zip code population in 2000: 31,071
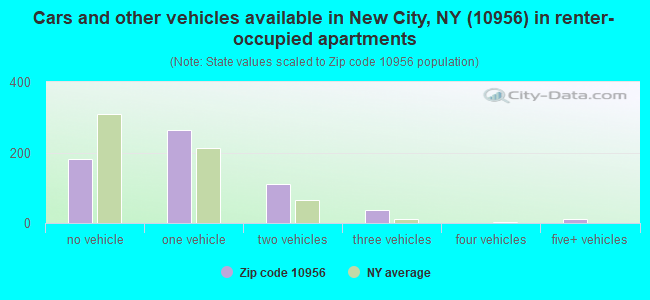
Houses and condos: 9,795 Renter-occupied apartments: 606
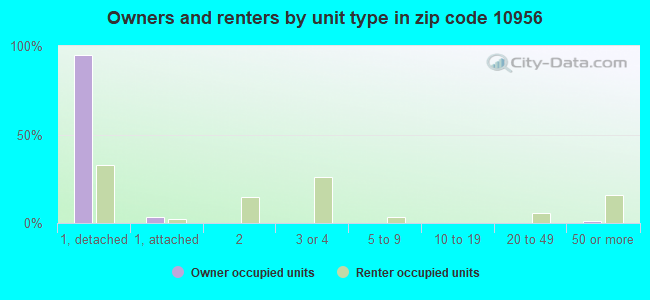
% of renters here:
6%
State:
46%
March 2022 cost of living index in zip code 10956: 130.2 (high, U.S. average is 100)
Land area: 16.2 sq. mi. Water area: 0.4 sq. mi.
Population density: 1,870 people per square mile
(low).
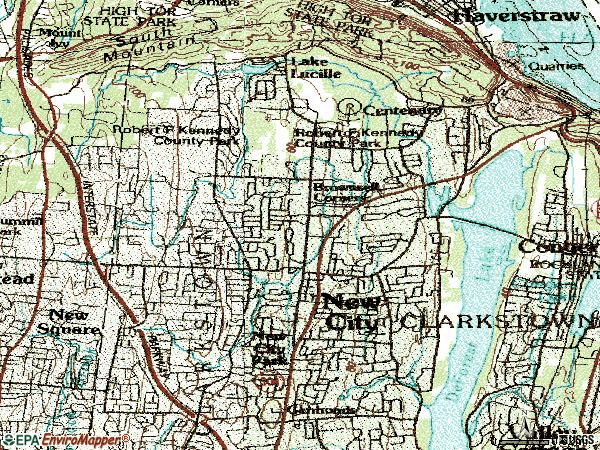
OSM Map
General Map
Google Map
MSN Map
OSM Map
General Map
Google Map
MSN Map
OSM Map
General Map
Google Map
MSN Map
OSM Map
General Map
Google Map
MSN Map
Please wait while loading the map...
Real estate property taxes paid for housing units in 2022:
This zip code:
1.5% ($9,805)
New York:
1.5% ($6,180)
Median real estate property taxes paid for housing units with mortgages in 2022: $9,858 (1.5%) Median real estate property taxes paid for housing units with no mortgage in 2022: $9,755 (1.6%)
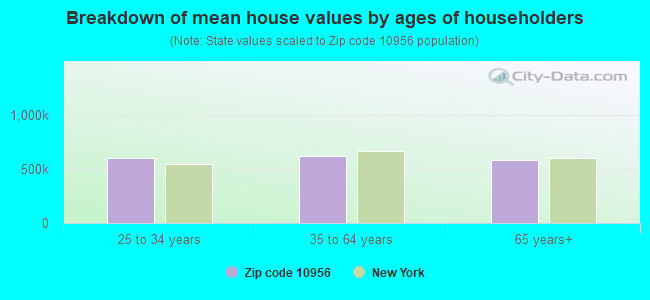
Estimated median house/condo value in 2022: $636,199
10956:
$636,199
New York:
$400,400
According to our research of New York and other state lists, there were 4 registered sex offenders living in 10956 zip code as of June 05, 2024. The ratio of all residents to sex offenders in zip code 10956 is 7,975 to 1. The ratio of registered sex offenders to all residents in this zip code is much lower than the state average.
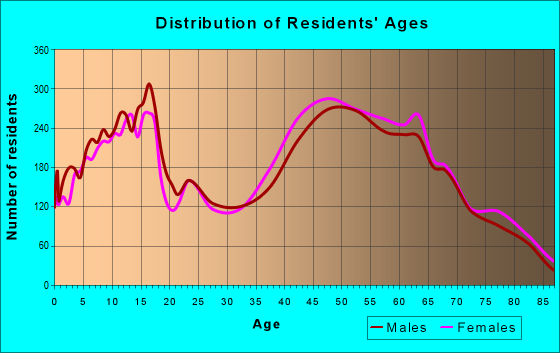
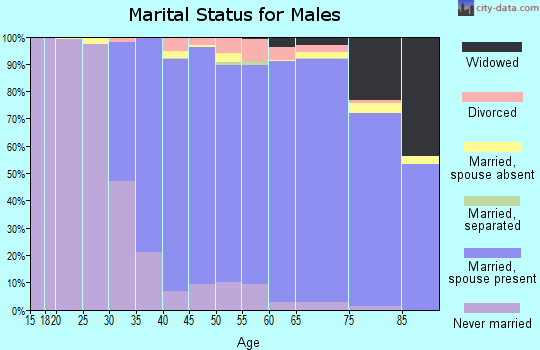
Median resident age:
This zip code:
43.7 years
New York median age:
40.0 years
Average household size:
This zip code:
3.1 people
New York:
2.5 people
Averages for the 2020 tax year for zip code 10956, filed in 2021:
Average Adjusted Gross Income (AGI) in 2020: $125,094 (Individual Income Tax Returns)
Here:
$125,094
State:
$90,930
Salary/wage: $102,061 (reported on 78.8% of returns)
Here:
$102,061
State:
$72,104
(% of AGI for various income ranges: 1200.9% for AGIs below $25k, 3759.0% for AGIs $25k-50k, 6676.5% for AGIs $50k-75k, 9941.7% for AGIs $75k-100k, 18806.8% for AGIs $100k-200k, 77581.8% for AGIs over 200k)
Taxable interest for individuals: $2,552 (reported on 51.4% of returns)
This zip code:
$2,552
New York:
$3,075
(% of AGI for various income ranges: 30.9% for AGIs below $25k, 39.2% for AGIs $25k-50k, 94.2% for AGIs $50k-75k, 151.6% for AGIs $75k-100k, 271.3% for AGIs $100k-200k, 1389.6% for AGIs over 200k)
Ordinary dividends: $8,183 (reported on 38.3% of returns)
Here:
$8,183
State:
$11,095
(% of AGI for various income ranges: 66.0% for AGIs below $25k, 117.5% for AGIs $25k-50k, 216.0% for AGIs $50k-75k, 371.5% for AGIs $75k-100k, 651.9% for AGIs $100k-200k, 3296.0% for AGIs over 200k)
Net capital gain/loss in AGI: +$24,728 (reported on 34.4% of returns)
Here:
+$24,728
State:
+$44,925
(% of AGI for various income ranges: 35.1% for AGIs below $25k, 73.9% for AGIs $25k-50k, 159.3% for AGIs $50k-75k, 324.8% for AGIs $75k-100k, 691.8% for AGIs $100k-200k, 13376.4% for AGIs over 200k)
Profit/loss from business: +$22,277 (reported on 17.3% of returns)
Here:
+$22,277
State:
+$14,940
(% of AGI for various income ranges: 184.4% for AGIs below $25k, 212.7% for AGIs $25k-50k, 208.7% for AGIs $50k-75k, 352.7% for AGIs $75k-100k, 578.7% for AGIs $100k-200k, 4349.8% for AGIs over 200k)
Taxable individual retirement arrangement distribution: $24,030 (reported on 11.2% of returns)
10956:
$24,030
New York:
$19,609
(% of AGI for various income ranges: 47.0% for AGIs below $25k, 156.8% for AGIs $25k-50k, 285.9% for AGIs $50k-75k, 494.8% for AGIs $75k-100k, 814.0% for AGIs $100k-200k, 1860.2% for AGIs over 200k)
Self-employed (Keogh) retirement plans: $28,311 (reported on 1.7% of returns)
10956:
$28,311
New York:
$32,497
(% of AGI for various income ranges: 26.0% for AGIs $50k-75k, 58.7% for AGIs $100k-200k, 723.5% for AGIs over 200k)
Total itemized deductions: $32,021 (reported on 23.1% of returns)
Here:
$32,021
State:
$39,326
(% of AGI for various income ranges: 179.3% for AGIs below $25k, 346.1% for AGIs $25k-50k, 737.9% for AGIs $50k-75k, 1168.4% for AGIs $75k-100k, 2062.8% for AGIs $100k-200k, 5841.5% for AGIs over 200k)
Charity contributions: $6,983 (reported on 20.7% of returns)
Here:
$6,983
State:
$15,420
(% of AGI for various income ranges: 8.5% for AGIs below $25k, 29.5% for AGIs $25k-50k, 83.2% for AGIs $50k-75k, 151.6% for AGIs $75k-100k, 340.5% for AGIs $100k-200k, 1564.8% for AGIs over 200k)
Taxes paid: $9,648 (reported on 23.1% of returns)
10956:
$9,648
State:
$9,183
(% of AGI for various income ranges: 53.6% for AGIs below $25k, 112.8% for AGIs $25k-50k, 256.8% for AGIs $50k-75k, 400.0% for AGIs $75k-100k, 679.4% for AGIs $100k-200k, 1522.4% for AGIs over 200k)
Earned income credit: $1,866 (reported on 6.5% of returns)
Here:
$1,866
State:
$2,138
(% of AGI for various income ranges: 57.0% for AGIs below $25k, 51.0% for AGIs $25k-50k)
Percentage of individuals using paid preparers for their 2020 taxes: 94.6%
Here:
95%
State:
95%
(% for various income ranges: 92.4% for AGIs below $25k, 94.7% for AGIs $25k-50k, 93.7% for AGIs $50k-75k, 94.7% for AGIs $75k-100k, 95.4% for AGIs $100k-200k, 96.8% for AGIs over 200k)
Averages for the 2012 tax year for zip code 10956, filed in 2013:
Average Adjusted Gross Income (AGI) in 2012: $109,355 (Individual Income Tax Returns)
Here:
$109,355
State:
$77,088
Salary/wage: $89,332 (reported on 81.5% of returns)
Here:
$89,332
State:
$60,593
(% of AGI for various income ranges: 72.3% for AGIs below $25k, 74.5% for AGIs $25k-50k, 67.9% for AGIs $50k-75k, 64.9% for AGIs $75k-100k, 70.5% for AGIs $100k-200k, 62.7% for AGIs over 200k)
Taxable interest for individuals: $2,047 (reported on 57.2% of returns)
This zip code:
$2,047
New York:
$3,125
(% of AGI for various income ranges: 2.4% for AGIs below $25k, 1.3% for AGIs $25k-50k, 1.3% for AGIs $50k-75k, 1.1% for AGIs $75k-100k, 1.0% for AGIs $100k-200k, 1.0% for AGIs over 200k)
Ordinary dividends: $6,077 (reported on 41.7% of returns)
Here:
$6,077
State:
$10,299
(% of AGI for various income ranges: 4.4% for AGIs below $25k, 2.3% for AGIs $25k-50k, 2.6% for AGIs $50k-75k, 2.2% for AGIs $75k-100k, 2.1% for AGIs $100k-200k, 2.4% for AGIs over 200k)
Net capital gain/loss in AGI: +$14,281 (reported on 34.1% of returns)
Here:
+$14,281
State:
+$42,474
(% of AGI for various income ranges: 0.2% for AGIs $50k-75k, 0.5% for AGIs $75k-100k, 0.7% for AGIs $100k-200k, 9.1% for AGIs over 200k)
Profit/loss from business: +$29,959 (reported on 17.0% of returns)
Here:
+$29,959
State:
+$16,168
(% of AGI for various income ranges: 6.5% for AGIs below $25k, 4.8% for AGIs $25k-50k, 3.7% for AGIs $50k-75k, 3.3% for AGIs $75k-100k, 3.0% for AGIs $100k-200k, 6.1% for AGIs over 200k)
Taxable individual retirement arrangement distribution: $21,453 (reported on 14.5% of returns)
10956:
$21,453
New York:
$17,621
(% of AGI for various income ranges: 4.3% for AGIs below $25k, 3.4% for AGIs $25k-50k, 3.9% for AGIs $50k-75k, 4.1% for AGIs $75k-100k, 3.5% for AGIs $100k-200k, 1.9% for AGIs over 200k)
Self-employment retirement plans: $24,314 (reported on 2.3% of returns)
10956:
$24,314
New York:
$27,330
(% of AGI for various income ranges: 0.2% for AGIs $25k-50k, 0.2% for AGIs $75k-100k, 0.4% for AGIs $100k-200k, 0.8% for AGIs over 200k)
Total itemized deductions: $36,730 (23% of AGI, reported on 60.3% of returns)
Here:
$36,730
State:
$34,985
Here:
22.6% of AGI
State:
21.3% of AGI
(% of AGI for various income ranges: 24.5% for AGIs below $25k, 21.8% for AGIs $25k-50k, 23.8% for AGIs $50k-75k, 24.0% for AGIs $75k-100k, 23.0% for AGIs $100k-200k, 16.7% for AGIs over 200k)
Charity contributions: $3,598 (reported on 55.2% of returns)
Here:
$3,598
State:
$5,572
(% of AGI for various income ranges: 1.3% for AGIs below $25k, 1.5% for AGIs $25k-50k, 1.8% for AGIs $50k-75k, 2.2% for AGIs $75k-100k, 2.0% for AGIs $100k-200k, 1.7% for AGIs over 200k)
Taxes paid: $20,773 (reported on 60.1% of returns)
10956:
$20,773
State:
$18,656
(% of AGI for various income ranges: 9.8% for AGIs below $25k, 8.7% for AGIs $25k-50k, 10.9% for AGIs $50k-75k, 12.1% for AGIs $75k-100k, 12.3% for AGIs $100k-200k, 11.1% for AGIs over 200k)
Earned income credit: $1,930 (reported on 7.1% of returns)
Here:
$1,930
State:
$2,230
(% of AGI for various income ranges: 3.7% for AGIs below $25k, 0.6% for AGIs $25k-50k)
Percentage of individuals using paid preparers for their 2012 taxes: 71.4%
Here:
71%
State:
66%
(% for various income ranges: 63.2% for AGIs below $25k, 70.6% for AGIs $25k-50k, 72.9% for AGIs $50k-75k, 76.0% for AGIs $75k-100k, 75.0% for AGIs $100k-200k, 78.6% for AGIs over 200k)
Averages for the 2004 tax year for zip code 10956, filed in 2005:
Average Adjusted Gross Income (AGI) in 2004: $95,147 (Individual Income Tax Returns)
Here:
$95,147
State:
$59,519
Salary/wage: $80,419 (reported on 81.4% of returns)
Here:
$80,419
State:
$50,673
(% of AGI for various income ranges: 335.2% for AGIs below $10k, 65.5% for AGIs $10k-25k, 75.0% for AGIs $25k-50k, 71.6% for AGIs $50k-75k, 72.3% for AGIs $75k-100k, 66.9% for AGIs over 100k)
Taxable interest for individuals: $2,287 (reported on 72.7% of returns)
This zip code:
$2,287
New York:
$2,377
(% of AGI for various income ranges: 51.5% for AGIs below $10k, 4.2% for AGIs $10k-25k, 2.7% for AGIs $25k-50k, 2.0% for AGIs $50k-75k, 1.9% for AGIs $75k-100k, 1.4% for AGIs over 100k)
Taxable dividends: $3,845 (reported on 50.8% of returns)
Here:
$3,845
State:
$5,394
(% of AGI for various income ranges: 35.4% for AGIs below $10k, 3.5% for AGIs $10k-25k, 2.3% for AGIs $25k-50k, 2.1% for AGIs $50k-75k, 1.7% for AGIs $75k-100k, 1.9% for AGIs over 100k)
Net capital gain/loss: +$13,576 (reported on 42.7% of returns)
Here:
+$13,576
State:
+$23,581
(% of AGI for various income ranges: -19.3% for AGIs below $10k, 0.3% for AGIs $10k-25k, 0.5% for AGIs $25k-50k, 0.4% for AGIs $50k-75k, 0.5% for AGIs $75k-100k, 8.1% for AGIs over 100k)
Profit/loss from business: +$26,041 (reported on 16.7% of returns)
Here:
+$26,041
State:
+$13,809
(% of AGI for various income ranges: 25.3% for AGIs below $10k, 6.0% for AGIs $10k-25k, 4.3% for AGIs $25k-50k, 4.2% for AGIs $50k-75k, 3.2% for AGIs $75k-100k, 4.7% for AGIs over 100k)
IRA payment deduction: $3,757 (reported on 4.4% of returns)
10956:
$3,757
New York:
$3,115
(% of AGI for various income ranges: 2.4% for AGIs below $10k, 0.5% for AGIs $10k-25k, 0.5% for AGIs $25k-50k, 0.3% for AGIs $50k-75k, 0.3% for AGIs $75k-100k, 0.1% for AGIs over 100k)
Self-employed pension: $18,774 (reported on 3.1% of returns)
Here:
$18,774
New York:
$19,016
(% of AGI for various income ranges: 0.2% for AGIs $25k-50k, 0.2% for AGIs $50k-75k, 0.3% for AGIs $75k-100k, 0.8% for AGIs over 100k)
Total itemized deductions: $31,619 (22% of AGI, reported on 59.7% of returns)
Here:
$31,619
State:
$25,864
Here:
21.6% of AGI
State:
21.9% of AGI
(% of AGI for various income ranges: 66.8% for AGIs below $10k, 23.4% for AGIs $10k-25k, 22.8% for AGIs $25k-50k, 26.9% for AGIs $50k-75k, 26.5% for AGIs $75k-100k, 17.8% for AGIs over 100k)
Charity contributions deductions: $4,004 (3% of AGI, reported on 56.8% of returns)
Here:
$4,004
State:
$4,439
Here:
2.7% of AGI
State:
3.6% of AGI
(% of AGI for various income ranges: 2.7% for AGIs below $10k, 1.8% for AGIs $10k-25k, 2.3% for AGIs $25k-50k, 2.9% for AGIs $50k-75k, 2.8% for AGIs $75k-100k, 2.3% for AGIs over 100k)
Total tax: $19,525 (reported on 81.7% of returns)
10956:
$19,525
State:
$11,730
(% of AGI for various income ranges: 11.9% for AGIs below $10k, 4.5% for AGIs $10k-25k, 7.6% for AGIs $25k-50k, 8.9% for AGIs $50k-75k, 9.4% for AGIs $75k-100k, 19.6% for AGIs over 100k)
Earned income credit: $1,306 (reported on 4.3% of returns)
Here:
$1,306
State:
$1,757
Percentage of individuals using paid preparers for their 2004 taxes: 72.2%
Here:
72%
State:
67%
(% for various income ranges: 66.9% for AGIs below $10k, 69.5% for AGIs $10k-25k, 71.2% for AGIs $25k-50k, 74.5% for AGIs $50k-75k, 76.3% for AGIs $75k-100k, 74.8% for AGIs over 100k)
Likely homosexual households (counted as self-reported same-sex unmarried-partner households)
Lesbian couples: 0.0% of all households
Gay men: 0.2% of all households
Household received Food Stamps/SNAP in the past 12 months: 575 Household did not receive Food Stamps/SNAP in the past 12 months: 8,915
Women who had a birth in the past 12 months: 212 (184 now married, 25 unmarried) Women who did not have a birth in the past 12 months: 5,820 (2,705 now married, 3,086 unmarried)
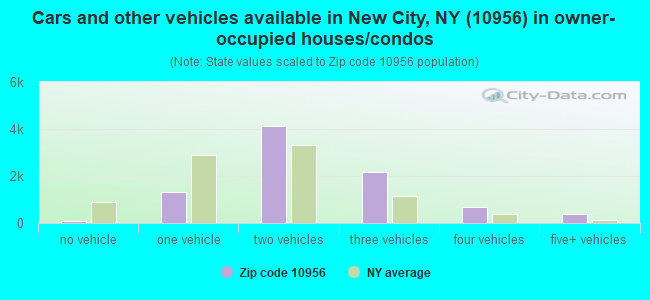
Housing units in zip code 10956 with a mortgage: 5,691 (838 second mortgage, 6 home equity loan, 666 both second mortgage and home equity loan) Houses without a mortgage: 237
Median monthly owner costs for units with a mortgage: $3,748 Median monthly owner costs for units without a mortgage: $1,487
Residents with income below the poverty level in 2022:
This zip code:
4.1%
Whole state:
14.3%
Residents with income below 50% of the poverty level in 2022:
This zip code:
2.2%
Whole state:
6.8%
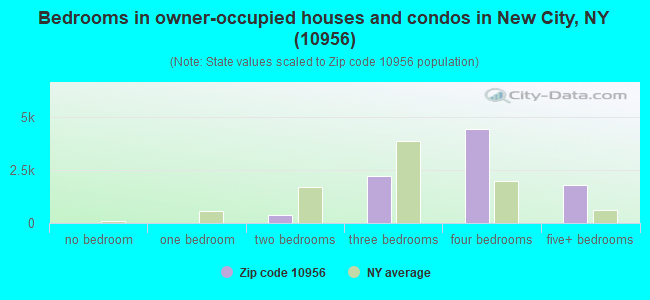
Median number of rooms in houses and condos:
Here:
7.9
State:
6.3
Median number of rooms in apartments:
Here:
3.9
State:
3.8
Notable locations in this zip code not listed on our city pages
Notable locations in zip code 10956: Dellwood Country Club (A), Katz Estate (B), Tunnas Corner (C), Camp Jawonio (D), Orchards of Concklin (E), New City Free Library (F), Rockland County Courthouse (G), Clarkstown Town Hall (H), Friedwald Center for Rehabilitation and Nursing (I), L'Dor Assisted Living Center (J), Sunrise of New City (K), New City Fire Engine Company (L). Display/hide their locations on the map
Churches in zip code 10956 include: Saint Olav Chapel (A), West Clarkstown Jewish Center (B), Temple Beth Sholom (C), New City Jewish Center (D), Nanuet Hebrew Center (E), Iglesia Alianza Biblica Cristiana (F), New City Gospel Fellowship Church (G), New City United Methodist Church (H), New Hempstead Presbyterian Church (I). Display/hide their locations on the map
5,007 married couples with children.
679 single-parent households (198 men, 481 women).
68.4% of residents of 10956 zip code speak English at home.
10.3% of residents speak Spanish at home (77% very well, 11% well, 11% not well, 1% not at all).
11.8% of residents speak other Indo-European language at home (69% very well, 20% well, 8% not well, 3% not at all).
7.4% of residents speak Asian or Pacific Island language at home (74% very well, 13% well, 11% not well, 2% not at all).
2.2% of residents speak other language at home (95% very well, 5% well).
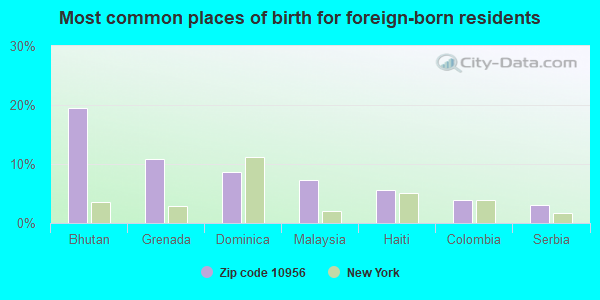
Foreign born population: 6,963 (23.0%) (76.1% of them are naturalized citizens)
Major facilities with environmental interests located in this zip code:
CIRCLE TRUCK PAINTING & COLLISION CENTER (1 ORCHARD STREET in CLARKSTOWN, NY)
STATE MASTER (New York facility tracking) - AIR PROGRAM, Small Quantity Generators, between 100 kg and 1000 kg of hazardous waste/month (Resource Conservation and Recovery Act (tracking hazardous waste)) - notification Business SIC classification: TOP, BODY, AND UPHOLSTERY REPAIR SHOPS AND PAINT SHOPS Business NAICS classification: AUTOMOTIVE BODY, PAINT, AND INTERIOR REPAIR AND MAINTENANCE. Organizations: CIRCLE TRUCK PAINTING & COLLISION CENTER LLC (AIR PERMITTING FACILITY OWNER CONTACT)
, ARNOLD BURNSTEIN (CONTACT/OWNER)
Alternative names: CIRCLE CAR PAINTERS
GROUP HOME ( in NEW CITY, NY)
(National Center for Education Statistics) - STATE ID-500101890001 Organizations: CLARKSTOWN CSD (SCHOOL DISTRICT)
HILLCREST ES ( in NEW CITY, NY)
(National Center for Education Statistics) - STATE ID-500402060004 Organizations: EAST RAMAPO CSD (SPRING VALLEY) (SCHOOL DISTRICT)
CLARKSTOWN NORTH SHS ( in NEW CITY, NY)
(National Center for Education Statistics) - STATE ID-500101060011 Organizations: CLARKSTOWN CSD (SCHOOL DISTRICT)
AMOCO (101 SOUTH MAIN STREET in NEW CITY, NY)
(Integrated Compliance Information System) - ICIS-02-2004-7504, FORMAL ENFORCEMENT ACTION
567A SOUTH MOUNTAIN ROAD ( in NEW CITY, NY)
National Pollutant Discharge Elimination System NON-MAJOR (Tracking pollutant discharge elimination systems) - permit Organizations: SCOTT AND REGINA KAY (CONTACT/OWNER)
Alternative names: KAY RESIDENCE, KAY RESIDENCE/PROPERTY
GETTY PETROLEUM CORP (40 N MAIN ST in NEW CITY, NY)
(Resource Conservation and Recovery Act (tracking hazardous waste))
HILLTOP FRENCH CLEANERS (368 NEW HEMPSTEAD RD in NEW CITY, NY)
AIR MINOR (AIRS/AFS) Business SIC classification: DRYCLEANING PLANTS, EXCEPT RUG CLEANING Alternative names: HILL TOP CLEANERS INC
CLARKSTOWN CENT SCH DIST CHESTNUT GROVE (OLD N MIDDLETOWN RD in NEW CITY, NY)
(Resource Conservation and Recovery Act (tracking hazardous waste))
CLARKSTOWN CENT SCH DIST LINK ELEM (55 RED HILL RD in NEW CITY, NY)
(Resource Conservation and Recovery Act (tracking hazardous waste))
CLARKSTOWN CENT SCH DIST LITTLE TOR ELEM (GREGORY ST in NEW CITY, NY)
(Resource Conservation and Recovery Act (tracking hazardous waste))
CLARKSTOWN CENT SCH DIST PLAINS ELEM (TEAKWOOD LANE in NEW CITY, NY)
(Resource Conservation and Recovery Act (tracking hazardous waste))
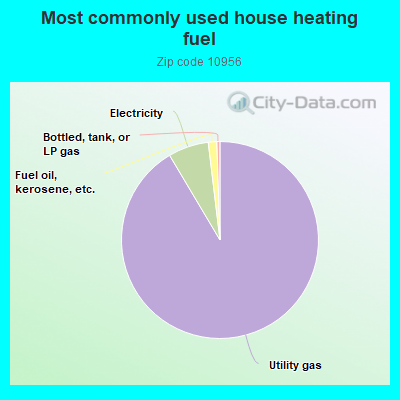
Housing units lacking complete plumbing facilities: 0.7% Housing units lacking complete kitchen facilities: 1.4%
91.1%Utility gas
6.6%Electricity
1.4%Fuel oil, kerosene, etc.
0.5%Bottled, tank, or LP gas
Population in 1990: 33,340.
Place of birth for U.S.-born residents:
This state: 17,929
Northeast: 3,314
Midwest: 453
South: 480
West: 204
70% of the 10956 zip code residents lived in the same house 5 years ago. Out of people who lived in different houses, 55% lived in this county. Out of people who lived in different counties, 50% lived in New York.
92% of the 10956 zip code residents lived in the same house 1 year ago. Out of people who lived in different houses, 50% moved from this county. Out of people who lived in different houses, 18% moved from different county within same state. Out of people who lived in different houses, 22% moved from different state. Out of people who lived in different houses, 11% moved from abroad.
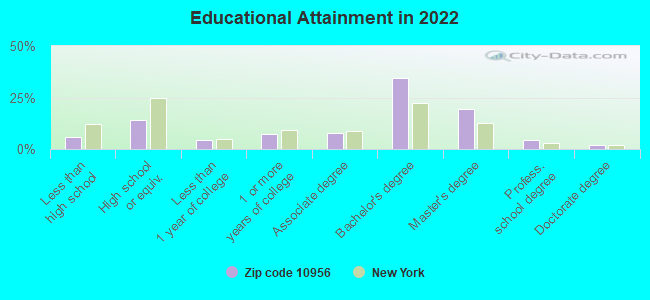
Private vs. public school enrollment:
Students in private schools in grades 1 to 8 (elementary and middle school): 281
Here:
9.7%
New York:
15.6%
Students in private schools in grades 9 to 12 (high school): 111
Here:
6.4%
New York:
15.0%
Students in private undergraduate colleges: 510
Here:
42.6%
New York:
39.2%
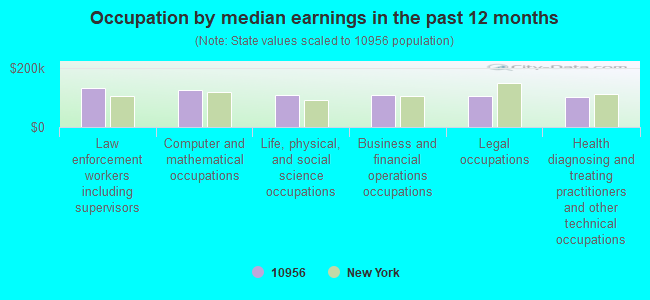
Occupation by median earnings in the past 12 months ($)
131,552Law enforcement workers including supervisors
124,931Computer and mathematical occupations
109,837Life, physical, and social science occupations
108,785Business and financial operations occupations
105,964Legal occupations
102,278Health diagnosing and treating practitioners and other technical occupations
Companies with federal contracts located in this zip code (NEW CITY, NY):
O C LUGO CO INC (321 N MAIN ST; small business) : $1,590,852 in 18 contractsfrom 2001 to 2006
Contracts for Air Purification Equipment, Miscellaneous Chemical Specialties, Chemicals, Laboratory Equipment and Supplies by Defense Logistics Agency, Navy, National Oceanic and Atmospheric Administration/Under Secretary for Oceans and Atmosphere Signed by year:2000: $0; 2001: $1,136,510; 2002: $248,426; 2003: $35,625; 2004: $59,216; 2005: $79,452; 2006: $31,623.
Biggest contracts:
$534,845 with Defense Logistics Agency for Air Purification Equipment. Signed on 2001-10-01. Completion date: 2002-05-28.
$534,845, same as above.Signed on 2001-09-26. Completion date: 2002-05-28.
$196,026, same as above.Signed on 2002-05-13. Completion date: 2002-11-09.
$66,820 with Defense Logistics Agency for Miscellaneous Chemical Specialties. Signed on 2001-05-04. Completion date: 2001-08-02.
MATTIE MOORE (8 MCLEOD TERRACE; small business) : $1,237,929 in 17 contractsfrom 2000 to 2005
Contracts for Anesthesiology Services, Nursing Services, General Health Care Services by Army Signed by year:2000: $222,420; 2001: $147,000; 2002: $146,955; 2003: $101,303; 2004: $230,360; 2005: $389,891; 2006: $0.
Biggest contracts:
$227,362 with Army for Anesthesiology Services. Signed on 2005-11-23. Completion date: 2005-09-30.
$151,320, same as above.Signed on 2003-10-22. Completion date: 2004-09-30.
$147,000 with Army for Nursing Services. Signed on 2001-11-29. Completion date: 2002-09-30.
$146,955, same as above.Signed on 2002-11-04. Completion date: 2003-09-30.
LORENCIN CONTRACTING CORP (17 SCHRIEVER LANE; small business) : $335,500 in 4 contractsfrom 2000 to 2001
$121,000 with Army for Construction of Structures and Facilities -- Recreation Facilities (Non-Building). Signed on 2001-09-28. Completion date: 2001-11-26.
$107,000, same as above.Signed on 2000-09-29. Completion date: 2000-11-29.
$77,500, same as above.Signed on 2001-08-10. Completion date: 2001-01-31.
$30,000, same as above.Signed on 2001-01-29. Completion date: 2001-01-31.
DOUGLAS SCHONENBERG (10 HERITAGE DR APT C; small business) : $47,600 in 4 contractsfrom 2004 to 2005
$40,800 with Army for Other Professional Services. Signed on 2004-09-01. Completion date: 2004-09-13.
$20,400 with Army for Technical Writing Services. Signed on 2005-05-06. Completion date: 2005-10-28.
$0, same as above.Signed on 2005-10-18. Completion date: 2005-10-28.
-$13,600, same as above.Signed on 2005-10-18. Completion date: 2005-10-28.
AVCO ENTERPRISES INC (43 SECOND ST; small business)
$7,653 with Army for Medical and Surgical Instruments, Equipment, and Supplies. Signed on 2005-04-19. Completion date: 2005-04-29.
Top industries in this zip code by the number of employees in 2005:
Health Care and Social Assistance: Home Health Care Services (250-499 employees: 1 establishment, 50-99 employees: 2 establishments, 20-49 employees: 1 establishment)
Health Care and Social Assistance: Offices of Physicians (except Mental Health Specialists) (20-49: 4, 10-19: 12, 5-9: 7, 1-4: 33)
Professional, Scientific, and Technical Services: Offices of Lawyers (20-49: 2, 10-19: 7, 5-9: 17, 1-4: 58)
Health Care and Social Assistance: All Other Outpatient Care Centers (250-499: 1, 1-4: 2)
Health Care and Social Assistance: Nursing Care Facilities (250-499: 1)
Health Care and Social Assistance: Diagnostic Imaging Centers (100-249: 2, 1-4: 1)
Health Care and Social Assistance: Offices of Dentists (10-19: 7, 5-9: 21, 1-4: 23)
Other Services (except Public Administration): Religious Organizations (50-99: 1, 20-49: 5, 5-9: 2, 1-4: 5)
People in group quarters in 2010:
192 people in local jails and other municipal confinement facilities
174 people in nursing facilities/skilled-nursing facilities
149 people in group homes intended for adults
7 people in group homes for juveniles (non-correctional)
7 people in residential treatment centers for adults
5 people in other noninstitutional facilities
People in group quarters in 2000:
474 people in nursing homes
193 people in local jails and other confinement facilities (including police lockups)
105 people in homes for the mentally retarded
29 people in homes or halfway houses for drug/alcohol abuse
27 people in homes for the mentally ill
20 people in homes for the physically handicapped
13 people in other nonhousehold living situations
4 people in training schools for juvenile delinquents
3 people in religious group quarters
Fatal accident statistics in 2013:
Fatal accident count: 1
Vehicles involved in fatal accidents: 1
Fatal accidents caused by drunken drivers: 1
Fatalities: 2
Persons involved in fatal accidents: 2
Pedestrians involved in fatal accidents: 0
Fatal accident statistics in 2010:
Fatal accident count: 1
Vehicles involved in fatal accidents: 2
Fatal accidents caused by drunken drivers: 0
Fatalities: 1
Persons involved in fatal accidents: 4
Pedestrians involved in fatal accidents: 0
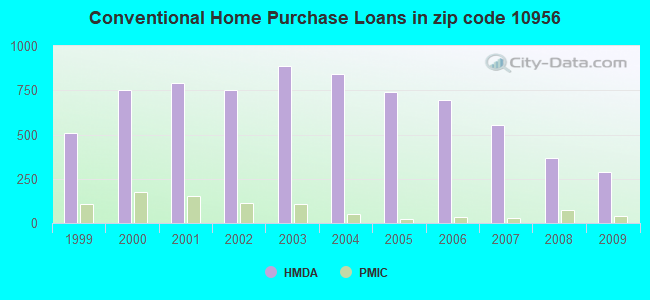
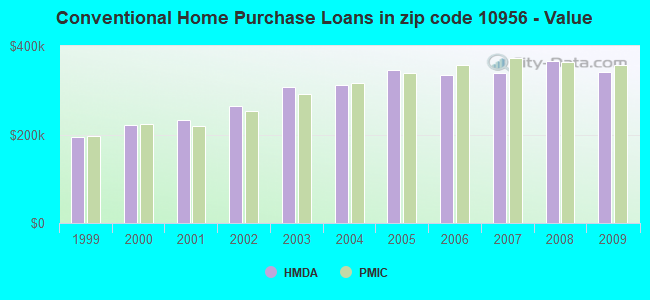
Home Mortgage Disclosure Act Aggregated Statistics For Year 2009 (Based on 6 full and 10 partial tracts)
A) FHA, FSA/RHS & VA Home Purchase Loans
B) Conventional Home Purchase Loans
C) Refinancings
D) Home Improvement Loans
E) Loans on Dwellings For 5+ Families
F) Non-occupant Loans on < 5 Family Dwellings (A B C & D)
Number
Average Value
Number
Average Value
Number
Average Value
Number
Average Value
Number
Average Value
Number
Average Value
LOANS ORIGINATED
74
$410,008
288
$341,779
772
$305,513
36
$199,508
1
$1,826,890
18
$308,738
APPLICATIONS APPROVED, NOT ACCEPTED
5
$319,322
34
$350,949
123
$330,942
10
$134,624
1
$304,920
4
$231,565
APPLICATIONS DENIED
15
$336,916
58
$332,770
430
$352,432
33
$165,550
0
$0
12
$281,774
APPLICATIONS WITHDRAWN
12
$354,692
34
$345,565
248
$357,175
12
$294,245
0
$0
1
$100,910
FILES CLOSED FOR INCOMPLETENESS
7
$403,801
19
$366,893
122
$362,101
17
$154,636
0
$0
1
$221,120
Aggregated Statistics For Year 2008 (Based on 6 full and 10 partial tracts)
A) FHA, FSA/RHS & VA Home Purchase Loans
B) Conventional Home Purchase Loans
C) Refinancings
D) Home Improvement Loans
E) Loans on Dwellings For 5+ Families
F) Non-occupant Loans on < 5 Family Dwellings (A B C & D)
Number
Average Value
Number
Average Value
Number
Average Value
Number
Average Value
Number
Average Value
Number
Average Value
LOANS ORIGINATED
15
$468,105
367
$366,997
336
$299,595
63
$155,616
1
$527,880
28
$308,402
APPLICATIONS APPROVED, NOT ACCEPTED
2
$269,295
73
$342,753
112
$304,286
20
$99,653
0
$0
6
$263,920
APPLICATIONS DENIED
9
$388,553
99
$469,848
312
$376,893
78
$113,094
0
$0
11
$315,740
APPLICATIONS WITHDRAWN
3
$299,033
43
$345,793
135
$338,392
12
$86,070
0
$0
5
$340,868
FILES CLOSED FOR INCOMPLETENESS
2
$412,400
13
$316,180
56
$349,968
8
$82,188
0
$0
2
$187,600
Aggregated Statistics For Year 2007 (Based on 6 full and 10 partial tracts)
A) FHA, FSA/RHS & VA Home Purchase Loans
B) Conventional Home Purchase Loans
C) Refinancings
D) Home Improvement Loans
E) Loans on Dwellings For 5+ Families
F) Non-occupant Loans on < 5 Family Dwellings (A B C & D)
G) Loans On Manufactured Home Dwelling (A B C & D)
Number
Average Value
Number
Average Value
Number
Average Value
Number
Average Value
Number
Average Value
Number
Average Value
Number
Average Value
LOANS ORIGINATED
3
$230,070
555
$338,211
571
$312,631
124
$131,736
2
$286,225
24
$301,792
0
$0
APPLICATIONS APPROVED, NOT ACCEPTED
0
$0
99
$386,220
144
$296,132
30
$144,127
0
$0
10
$418,649
0
$0
APPLICATIONS DENIED
0
$0
121
$354,150
441
$382,036
109
$118,996
1
$923,270
18
$363,615
1
$75,000
APPLICATIONS WITHDRAWN
0
$0
80
$380,520
188
$366,257
43
$147,759
2
$518,260
7
$329,537
0
$0
FILES CLOSED FOR INCOMPLETENESS
0
$0
35
$346,632
123
$361,765
10
$212,638
0
$0
0
$0
0
$0
Aggregated Statistics For Year 2006 (Based on 6 full and 10 partial tracts)
A) FHA, FSA/RHS & VA Home Purchase Loans
B) Conventional Home Purchase Loans
C) Refinancings
D) Home Improvement Loans
E) Loans on Dwellings For 5+ Families
F) Non-occupant Loans on < 5 Family Dwellings (A B C & D)
G) Loans On Manufactured Home Dwelling (A B C & D)
Number
Average Value
Number
Average Value
Number
Average Value
Number
Average Value
Number
Average Value
Number
Average Value
Number
Average Value
LOANS ORIGINATED
0
$0
697
$334,747
780
$331,627
173
$160,595
1
$921,960
41
$348,122
1
$56,310
APPLICATIONS APPROVED, NOT ACCEPTED
1
$294,000
109
$324,251
178
$293,453
49
$131,267
0
$0
10
$284,322
0
$0
APPLICATIONS DENIED
1
$290,840
160
$326,758
491
$392,054
104
$113,991
1
$785,760
31
$332,736
5
$121,884
APPLICATIONS WITHDRAWN
0
$0
105
$336,192
411
$329,479
27
$119,675
3
$829,500
19
$362,984
2
$108,025
FILES CLOSED FOR INCOMPLETENESS
0
$0
39
$374,412
102
$329,853
9
$189,407
0
$0
1
$99,430
1
$82,860
Aggregated Statistics For Year 2005 (Based on 6 full and 10 partial tracts)
A) FHA, FSA/RHS & VA Home Purchase Loans
B) Conventional Home Purchase Loans
C) Refinancings
D) Home Improvement Loans
E) Loans on Dwellings For 5+ Families
F) Non-occupant Loans on < 5 Family Dwellings (A B C & D)
G) Loans On Manufactured Home Dwelling (A B C & D)
Number
Average Value
Number
Average Value
Number
Average Value
Number
Average Value
Number
Average Value
Number
Average Value
Number
Average Value
LOANS ORIGINATED
1
$124,290
738
$346,868
1,059
$305,398
186
$192,136
0
$0
39
$310,646
2
$46,520
APPLICATIONS APPROVED, NOT ACCEPTED
0
$0
78
$405,734
201
$317,505
24
$68,731
0
$0
6
$200,982
0
$0
APPLICATIONS DENIED
0
$0
117
$368,999
495
$339,300
130
$138,017
1
$491,100
20
$272,155
2
$63,080
APPLICATIONS WITHDRAWN
0
$0
112
$330,298
587
$324,833
53
$381,938
0
$0
12
$311,882
0
$0
FILES CLOSED FOR INCOMPLETENESS
0
$0
13
$364,883
96
$350,831
12
$127,673
0
$0
5
$240,002
0
$0
Aggregated Statistics For Year 2004 (Based on 6 full and 10 partial tracts)
A) FHA, FSA/RHS & VA Home Purchase Loans
B) Conventional Home Purchase Loans
C) Refinancings
D) Home Improvement Loans
E) Loans on Dwellings For 5+ Families
F) Non-occupant Loans on < 5 Family Dwellings (A B C & D)
G) Loans On Manufactured Home Dwelling (A B C & D)
Number
Average Value
Number
Average Value
Number
Average Value
Number
Average Value
Number
Average Value
Number
Average Value
Number
Average Value
LOANS ORIGINATED
3
$175,990
843
$311,029
1,075
$271,049
174
$111,831
5
$2,032,322
47
$250,815
3
$11,523
APPLICATIONS APPROVED, NOT ACCEPTED
0
$0
86
$323,909
293
$278,699
47
$138,192
0
$0
6
$278,995
1
$105,000
APPLICATIONS DENIED
0
$0
121
$338,206
511
$302,104
116
$101,892
0
$0
20
$257,812
1
$14,910
APPLICATIONS WITHDRAWN
1
$243,610
114
$296,832
572
$284,096
56
$91,412
0
$0
6
$215,493
1
$329,560
FILES CLOSED FOR INCOMPLETENESS
0
$0
41
$282,441
85
$306,419
23
$113,617
0
$0
4
$309,210
0
$0
Aggregated Statistics For Year 2003 (Based on 6 full and 10 partial tracts)
A) FHA, FSA/RHS & VA Home Purchase Loans
B) Conventional Home Purchase Loans
C) Refinancings
D) Home Improvement Loans
E) Loans on Dwellings For 5+ Families
F) Non-occupant Loans on < 5 Family Dwellings (A B C & D)
Number
Average Value
Number
Average Value
Number
Average Value
Number
Average Value
Number
Average Value
Number
Average Value
LOANS ORIGINATED
9
$247,518
889
$307,133
3,502
$229,108
108
$74,844
2
$566,535
70
$238,912
APPLICATIONS APPROVED, NOT ACCEPTED
0
$0
123
$297,828
573
$231,282
57
$66,797
0
$0
9
$173,644
APPLICATIONS DENIED
1
$415,370
76
$288,590
714
$267,298
90
$53,242
2
$492,850
14
$265,629
APPLICATIONS WITHDRAWN
1
$104,770
73
$333,910
593
$241,856
28
$107,490
0
$0
11
$206,389
FILES CLOSED FOR INCOMPLETENESS
0
$0
32
$321,999
152
$276,117
5
$69,994
0
$0
2
$244,260
Aggregated Statistics For Year 2002 (Based on 5 full and 8 partial tracts)
A) FHA, FSA/RHS & VA Home Purchase Loans
B) Conventional Home Purchase Loans
C) Refinancings
D) Home Improvement Loans
E) Loans on Dwellings For 5+ Families
F) Non-occupant Loans on < 5 Family Dwellings (A B C & D)
Number
Average Value
Number
Average Value
Number
Average Value
Number
Average Value
Number
Average Value
Number
Average Value
LOANS ORIGINATED
9
$218,857
749
$264,865
2,197
$218,157
197
$76,109
0
$0
25
$181,475
APPLICATIONS APPROVED, NOT ACCEPTED
0
$0
94
$281,886
397
$211,559
69
$55,198
0
$0
7
$245,766
APPLICATIONS DENIED
0
$0
90
$274,020
450
$212,248
119
$74,218
1
$348,010
12
$248,562
APPLICATIONS WITHDRAWN
2
$199,280
90
$222,412
508
$214,910
57
$74,411
0
$0
10
$160,456
FILES CLOSED FOR INCOMPLETENESS
0
$0
15
$229,932
155
$217,531
11
$53,986
0
$0
4
$122,560
Aggregated Statistics For Year 2001 (Based on 5 full and 8 partial tracts)
A) FHA, FSA/RHS & VA Home Purchase Loans
B) Conventional Home Purchase Loans
C) Refinancings
D) Home Improvement Loans
E) Loans on Dwellings For 5+ Families
F) Non-occupant Loans on < 5 Family Dwellings (A B C & D)
Number
Average Value
Number
Average Value
Number
Average Value
Number
Average Value
Number
Average Value
Number
Average Value
LOANS ORIGINATED
14
$198,068
793
$232,483
1,518
$204,744
178
$74,860
4
$278,015
39
$177,936
APPLICATIONS APPROVED, NOT ACCEPTED
0
$0
60
$240,050
222
$172,921
71
$43,922
0
$0
4
$165,945
APPLICATIONS DENIED
12
$184,905
82
$231,512
433
$202,976
99
$59,830
0
$0
12
$174,390
APPLICATIONS WITHDRAWN
5
$201,468
79
$223,617
471
$183,636
84
$51,146
0
$0
8
$178,549
FILES CLOSED FOR INCOMPLETENESS
1
$201,410
19
$338,922
118
$215,469
19
$68,513
0
$0
3
$205,603
Aggregated Statistics For Year 2000 (Based on 5 full and 8 partial tracts)
A) FHA, FSA/RHS & VA Home Purchase Loans
B) Conventional Home Purchase Loans
C) Refinancings
D) Home Improvement Loans
E) Loans on Dwellings For 5+ Families
F) Non-occupant Loans on < 5 Family Dwellings (A B C & D)
Number
Average Value
Number
Average Value
Number
Average Value
Number
Average Value
Number
Average Value
Number
Average Value
LOANS ORIGINATED
14
$197,752
750
$220,601
390
$158,498
178
$51,866
2
$723,665
23
$151,779
APPLICATIONS APPROVED, NOT ACCEPTED
3
$157,690
102
$230,289
113
$141,117
75
$53,115
1
$259,000
8
$203,811
APPLICATIONS DENIED
6
$186,250
94
$247,905
246
$149,968
125
$48,675
1
$309,620
13
$134,731
APPLICATIONS WITHDRAWN
6
$197,133
72
$202,977
337
$124,758
41
$50,653
0
$0
8
$164,910
FILES CLOSED FOR INCOMPLETENESS
0
$0
9
$200,536
106
$204,594
28
$66,596
0
$0
0
$0
Aggregated Statistics For Year 1999 (Based on 2 full and 5 partial tracts)
A) FHA, FSA/RHS & VA Home Purchase Loans
B) Conventional Home Purchase Loans
C) Refinancings
D) Home Improvement Loans
E) Loans on Dwellings For 5+ Families
F) Non-occupant Loans on < 5 Family Dwellings (A B C & D)
2002 - 2018 National Fire Incident Reporting System (NFIRS) incidents
Based on the data from the years 2002 - 2018 the average number of fires per year is 90. The highest number of fire incidents - 154 took place in 2008, and the least - 32 in 2010. The data has a declining trend.
When looking into fire subcategories, the most reports belonged to: Structure Fires (58.2%), and Outside Fires (30.5%).
Fire incident types reported to NFIRS in Zip Code 10956


 Nearest zip codes: 10927, 10923, 10984, 10920, 10993, 10954.


 Based on the data from the years 2002 - 2018 the average number of fires per year is 90. The highest number of fire incidents - 154 took place in 2008, and the least - 32 in 2010. The data has a declining trend.
 When looking into fire subcategories, the most reports belonged to: Structure Fires (58.2%), and Outside Fires (30.5%).