Estimated zip code population in 2022: 8,471 Zip code population in 2010: 7,875 Zip code population in 2000: 7,067
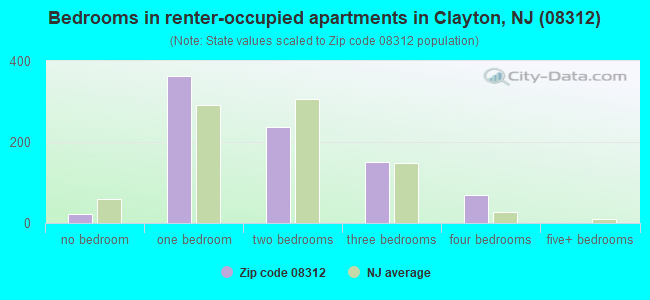
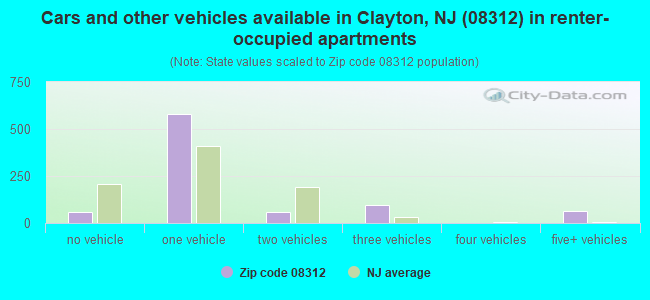
Houses and condos: 3,487 Renter-occupied apartments: 845
% of renters here:
27%
State:
35%
March 2022 cost of living index in zip code 08312: 100.8 (near average, U.S. average is 100)
Land area: 5.8 sq. mi. Water area: 0.2 sq. mi.
Population density: 1,459 people per square mile
(low).
OSM Map
Google Map
MSN Map
OSM Map
General Map
Google Map
MSN Map
OSM Map
Google Map
MSN Map
OSM Map
Google Map
MSN Map
Please wait while loading the map...
Real estate property taxes paid for housing units in 2022:
This zip code:
2.4% ($6,084)
New Jersey:
2.1% ($8,897)
Median real estate property taxes paid for housing units with mortgages in 2022: $6,271 (2.3%) Median real estate property taxes paid for housing units with no mortgage in 2022: $5,551 (2.8%)
Averages for the 2020 tax year for zip code 08312, filed in 2021:
Average Adjusted Gross Income (AGI) in 2020: $58,097 (Individual Income Tax Returns)
Here:
$58,097
State:
$95,247
Salary/wage: $51,402 (reported on 84.2% of returns)
Here:
$51,402
State:
$80,635
(% of AGI for various income ranges: 1095.2% for AGIs below $25k, 3426.5% for AGIs $25k-50k, 6133.2% for AGIs $50k-75k, 8883.4% for AGIs $75k-100k, 16545.5% for AGIs $100k-200k, 46966.7% for AGIs over 200k)
Taxable interest for individuals: $622 (reported on 22.9% of returns)
This zip code:
$622
New Jersey:
$2,414
(% of AGI for various income ranges: 7.4% for AGIs below $25k, 10.2% for AGIs $25k-50k, 17.2% for AGIs $50k-75k, 35.7% for AGIs $75k-100k, 42.5% for AGIs $100k-200k, 196.7% for AGIs over 200k)
Ordinary dividends: $2,904 (reported on 11.9% of returns)
Here:
$2,904
State:
$8,057
(% of AGI for various income ranges: 8.2% for AGIs below $25k, 17.4% for AGIs $25k-50k, 49.4% for AGIs $50k-75k, 65.7% for AGIs $75k-100k, 118.5% for AGIs $100k-200k, 920.0% for AGIs over 200k)
Net capital gain/loss in AGI: +$5,920 (reported on 9.8% of returns)
Here:
+$5,920
State:
+$25,022
(% of AGI for various income ranges: 1.5% for AGIs below $25k, 8.9% for AGIs $25k-50k, 69.2% for AGIs $50k-75k, 55.1% for AGIs $75k-100k, 155.8% for AGIs $100k-200k, 3916.7% for AGIs over 200k)
Profit/loss from business: +$8,837 (reported on 11.0% of returns)
Here:
+$8,837
State:
+$18,035
(% of AGI for various income ranges: 65.5% for AGIs below $25k, 82.5% for AGIs $25k-50k, 139.6% for AGIs $50k-75k, 188.9% for AGIs $75k-100k, 347.2% for AGIs $100k-200k)
Taxable individual retirement arrangement distribution: $16,697 (reported on 7.6% of returns)
08312:
$16,697
New Jersey:
$21,558
(% of AGI for various income ranges: 53.6% for AGIs below $25k, 79.3% for AGIs $25k-50k, 123.0% for AGIs $50k-75k, 278.6% for AGIs $75k-100k, 643.8% for AGIs $100k-200k)
Total itemized deductions: $23,688 (reported on 9.5% of returns)
Here:
$23,688
State:
$32,863
(% of AGI for various income ranges: 205.5% for AGIs $25k-50k, 391.2% for AGIs $50k-75k, 690.6% for AGIs $75k-100k, 838.7% for AGIs $100k-200k)
Charity contributions: $4,790 (reported on 7.2% of returns)
Here:
$4,790
State:
$7,880
(% of AGI for various income ranges: 21.6% for AGIs $25k-50k, 45.4% for AGIs $50k-75k, 95.1% for AGIs $75k-100k, 173.2% for AGIs $100k-200k)
Taxes paid: $8,445 (reported on 9.5% of returns)
08312:
$8,445
State:
$9,183
(% of AGI for various income ranges: 61.6% for AGIs $25k-50k, 165.2% for AGIs $50k-75k, 260.9% for AGIs $75k-100k, 278.8% for AGIs $100k-200k)
Earned income credit: $2,168 (reported on 14.1% of returns)
Here:
$2,168
State:
$2,148
(% of AGI for various income ranges: 75.2% for AGIs below $25k, 67.3% for AGIs $25k-50k)
Percentage of individuals using paid preparers for their 2020 taxes: 93.3%
Here:
93%
State:
92%
(% for various income ranges: 92.6% for AGIs below $25k, 94.5% for AGIs $25k-50k, 92.5% for AGIs $50k-75k, 93.9% for AGIs $75k-100k, 93.8% for AGIs $100k-200k, 87.5% for AGIs over 200k)
Averages for the 2012 tax year for zip code 08312, filed in 2013:
Average Adjusted Gross Income (AGI) in 2012: $51,204 (Individual Income Tax Returns)
Here:
$51,204
State:
$79,688
Salary/wage: $47,471 (reported on 87.1% of returns)
Here:
$47,471
State:
$68,122
(% of AGI for various income ranges: 74.2% for AGIs below $25k, 77.5% for AGIs $25k-50k, 80.0% for AGIs $50k-75k, 79.9% for AGIs $75k-100k, 86.9% for AGIs $100k-200k, 71.0% for AGIs over 200k)
Taxable interest for individuals: $642 (reported on 26.6% of returns)
This zip code:
$642
New Jersey:
$2,193
(% of AGI for various income ranges: 0.7% for AGIs below $25k, 0.3% for AGIs $25k-50k, 0.3% for AGIs $50k-75k, 0.3% for AGIs $75k-100k, 0.3% for AGIs $100k-200k, 0.3% for AGIs over 200k)
Ordinary dividends: $1,637 (reported on 13.7% of returns)
Here:
$1,637
State:
$6,828
(% of AGI for various income ranges: 0.4% for AGIs below $25k, 0.3% for AGIs $25k-50k, 0.4% for AGIs $50k-75k, 0.5% for AGIs $75k-100k, 0.6% for AGIs $100k-200k)
Net capital gain/loss in AGI: +$1,004 (reported on 7.3% of returns)
Here:
+$1,004
State:
+$15,358
(% of AGI for various income ranges: 0.5% for AGIs $100k-200k)
Profit/loss from business: +$9,576 (reported on 9.5% of returns)
Here:
+$9,576
State:
+$19,577
(% of AGI for various income ranges: 5.6% for AGIs below $25k, 1.9% for AGIs $25k-50k, 1.3% for AGIs $50k-75k, 1.4% for AGIs $75k-100k, 1.5% for AGIs $100k-200k)
Taxable individual retirement arrangement distribution: $13,646 (reported on 7.3% of returns)
08312:
$13,646
New Jersey:
$18,214
(% of AGI for various income ranges: 2.2% for AGIs below $25k, 2.0% for AGIs $25k-50k, 2.4% for AGIs $50k-75k, 1.9% for AGIs $75k-100k, 1.9% for AGIs $100k-200k)
Total itemized deductions: $19,554 (24% of AGI, reported on 42.9% of returns)
Here:
$19,554
State:
$30,827
Here:
24.0% of AGI
State:
21.2% of AGI
(% of AGI for various income ranges: 10.6% for AGIs below $25k, 13.5% for AGIs $25k-50k, 17.7% for AGIs $50k-75k, 18.4% for AGIs $75k-100k, 17.8% for AGIs $100k-200k, 14.4% for AGIs over 200k)
Charity contributions: $2,194 (reported on 35.3% of returns)
Here:
$2,194
State:
$3,451
(% of AGI for various income ranges: 0.5% for AGIs below $25k, 1.2% for AGIs $25k-50k, 1.8% for AGIs $50k-75k, 1.6% for AGIs $75k-100k, 1.7% for AGIs $100k-200k, 1.7% for AGIs over 200k)
Taxes paid: $8,347 (reported on 42.9% of returns)
08312:
$8,347
State:
$15,801
(% of AGI for various income ranges: 3.9% for AGIs below $25k, 5.0% for AGIs $25k-50k, 7.1% for AGIs $50k-75k, 7.7% for AGIs $75k-100k, 8.2% for AGIs $100k-200k, 8.3% for AGIs over 200k)
Earned income credit: $2,133 (reported on 17.1% of returns)
Here:
$2,133
State:
$2,182
(% of AGI for various income ranges: 6.2% for AGIs below $25k, 1.1% for AGIs $25k-50k)
Percentage of individuals using paid preparers for their 2012 taxes: 51.8%
Here:
52%
State:
65%
(% for various income ranges: 46.0% for AGIs below $25k, 50.0% for AGIs $25k-50k, 55.9% for AGIs $50k-75k, 59.0% for AGIs $75k-100k, 56.8% for AGIs $100k-200k, 100.0% for AGIs over 200k)
Averages for the 2004 tax year for zip code 08312, filed in 2005:
Average Adjusted Gross Income (AGI) in 2004: $44,054 (Individual Income Tax Returns)
Here:
$44,054
State:
$64,921
Salary/wage: $42,191 (reported on 90.1% of returns)
Here:
$42,191
State:
$57,755
(% of AGI for various income ranges: 80.7% for AGIs below $10k, 79.5% for AGIs $10k-25k, 86.4% for AGIs $25k-50k, 88.6% for AGIs $50k-75k, 90.0% for AGIs $75k-100k, 82.5% for AGIs over 100k)
Taxable interest for individuals: $563 (reported on 38.1% of returns)
This zip code:
$563
New Jersey:
$2,068
(% of AGI for various income ranges: 2.0% for AGIs below $10k, 1.1% for AGIs $10k-25k, 0.8% for AGIs $25k-50k, 0.3% for AGIs $50k-75k, 0.3% for AGIs $75k-100k, 0.2% for AGIs over 100k)
Taxable dividends: $1,276 (reported on 16.9% of returns)
Here:
$1,276
State:
$3,959
(% of AGI for various income ranges: 1.6% for AGIs below $10k, 0.9% for AGIs $10k-25k, 0.4% for AGIs $25k-50k, 0.3% for AGIs $50k-75k, 0.5% for AGIs $75k-100k, 0.6% for AGIs over 100k)
Net capital gain/loss: +$2,255 (reported on 9.9% of returns)
Here:
+$2,255
State:
+$13,591
(% of AGI for various income ranges: -0.9% for AGIs below $10k, 0.1% for AGIs $10k-25k, 0.5% for AGIs $25k-50k, 0.1% for AGIs $50k-75k, 0.3% for AGIs $75k-100k, 1.4% for AGIs over 100k)
Profit/loss from business: +$8,498 (reported on 8.8% of returns)
Here:
+$8,498
State:
+$17,520
(% of AGI for various income ranges: 7.3% for AGIs below $10k, 3.1% for AGIs $10k-25k, 1.7% for AGIs $25k-50k, 1.5% for AGIs $50k-75k, 1.1% for AGIs $75k-100k, 1.5% for AGIs over 100k)
IRA payment deduction: $2,667 (reported on 1.7% of returns)
08312:
$2,667
New Jersey:
$3,270
Total itemized deductions: $16,837 (25% of AGI, reported on 42.9% of returns)
Here:
$16,837
State:
$23,924
Here:
24.7% of AGI
State:
21.1% of AGI
(% of AGI for various income ranges: 11.4% for AGIs below $10k, 8.9% for AGIs $10k-25k, 14.6% for AGIs $25k-50k, 18.5% for AGIs $50k-75k, 19.2% for AGIs $75k-100k, 16.4% for AGIs over 100k)
Charity contributions deductions: $2,211 (3% of AGI, reported on 39.3% of returns)
Here:
$2,211
State:
$3,242
Here:
3.2% of AGI
State:
2.7% of AGI
(% of AGI for various income ranges: 0.5% for AGIs below $10k, 0.9% for AGIs $10k-25k, 1.8% for AGIs $25k-50k, 2.0% for AGIs $50k-75k, 2.4% for AGIs $75k-100k, 2.2% for AGIs over 100k)
Total tax: $5,045 (reported on 78.9% of returns)
08312:
$5,045
State:
$12,321
(% of AGI for various income ranges: 2.2% for AGIs below $10k, 4.2% for AGIs $10k-25k, 6.5% for AGIs $25k-50k, 8.3% for AGIs $50k-75k, 9.6% for AGIs $75k-100k, 14.8% for AGIs over 100k)
Earned income credit: $1,776 (reported on 12.5% of returns)
Here:
$1,776
State:
$1,711
Percentage of individuals using paid preparers for their 2004 taxes: 55.6%
Here:
56%
State:
65%
(% for various income ranges: 43.6% for AGIs below $10k, 53.5% for AGIs $10k-25k, 57.3% for AGIs $25k-50k, 61.1% for AGIs $50k-75k, 59.2% for AGIs $75k-100k, 62.4% for AGIs over 100k)
Household received Food Stamps/SNAP in the past 12 months: 412 Household did not receive Food Stamps/SNAP in the past 12 months: 2,751
Women who had a birth in the past 12 months: 29 (30 now married, 0 unmarried) Women who did not have a birth in the past 12 months: 1,825 (682 now married, 1,144 unmarried)
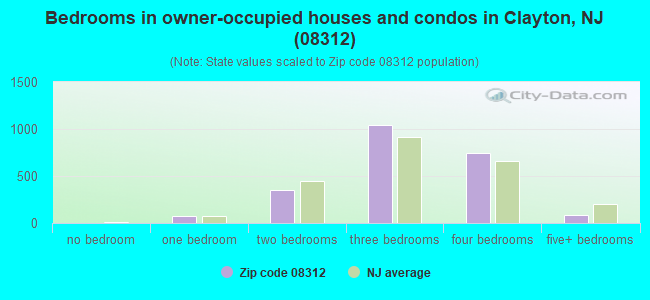
Housing units in zip code 08312 with a mortgage: 1,759 (143 second mortgage, 107 both second mortgage and home equity loan) Houses without a mortgage: 311
Median monthly owner costs for units with a mortgage: $1,871 Median monthly owner costs for units without a mortgage: $870
Residents with income below the poverty level in 2022:
This zip code:
8.6%
Whole state:
9.7%
Residents with income below 50% of the poverty level in 2022:
This zip code:
3.1%
Whole state:
5.2%
Median number of rooms in houses and condos:
Here:
7.0
State:
6.8
Median number of rooms in apartments:
Here:
4.0
State:
3.9
Notable locations in this zip code not listed on our city pages
Notable locations in zip code 08312: Gloucester County Emergency Medical Services Station 82 - 9 (A), Clayton Office Fire Prevention (B), Clayton Volunteer Fire Company 1 (C). Display/hide their locations on the map
In group quarters: 10 (-1 institutionalized population)
Size of family households: 1,032 2-persons, 424 3-persons, 381 4-persons, 242 5-persons, 161 6-persons, 59 7-or-more-persons
Size of nonfamily households: 681 1-person, 174 2-persons
665 married couples with children.
649 single-parent households (242 men, 407 women).
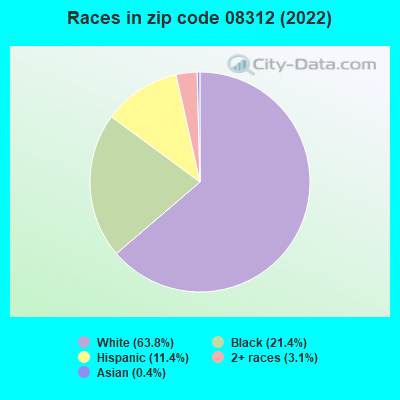
86.1% of residents of 08312 zip code speak English at home.
11.6% of residents speak Spanish at home (47% very well, 22% well, 31% not well).
2.1% of residents speak other Indo-European language at home (100% very well).
0.2% of residents speak Asian or Pacific Island language at home (100% well).
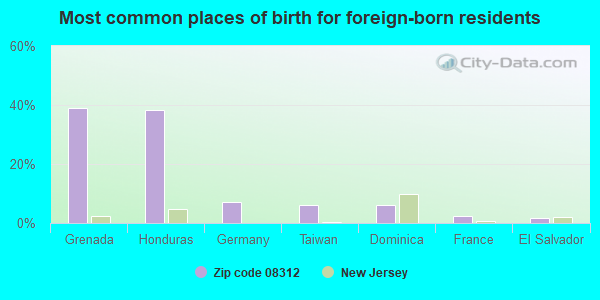
Foreign born population: 269 (3.2%) (76.0% of them are naturalized citizens)
This zip code:
3.2%
Whole state:
23.5%
39%Grenada
38%Honduras
7%Germany
6%Taiwan
6%Dominica
2%France
2%El Salvador
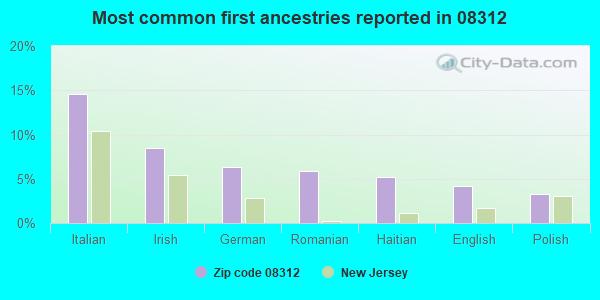
15%Italian
9%Irish
6%German
6%Romanian
5%Haitian
4%English
3%Polish
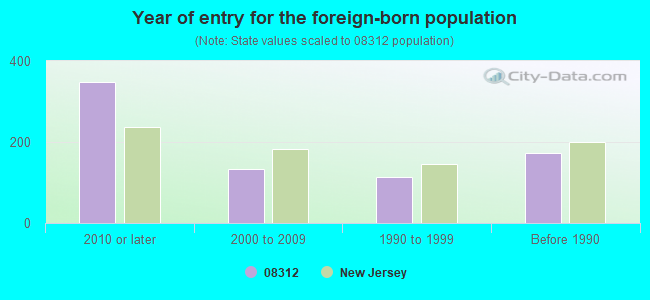
Year of entry for the foreign-born population
3472010 or later
1332000 to 2009
1131990 to 1999
172Before 1990
Facilities with environmental interests located in this zip code:
OIL RECOVERY CO INC @ ALMO IND PK (CENCO BOULEVARD in CLAYTON, NJ)
SUPERFUND (Superfund database) (Integrated Compliance Information System) - ICIS-02-1988-0821, FORMAL ENFORCEMENT ACTION COMPLIANCE ACTIVITY (Tracking inspections of insecticide, fungicide, and rodenticide, and toxic substances) STATE MASTER (New Jersey environmental info) - NJEMS-G000000520, STATE CLEANUP SITE (Resource Conservation and Recovery Act (tracking hazardous waste)) Business SIC classification: PETROLEUM REFINING Organizations: OIL RECOVERY COMPANY INC (CONTACT/OPERATOR)
Alternative names: PETROLEUM RECYCLING INC
ALMO ANTI POLLUTION SERVICES SLF (395 E ACADEMY ST in CLAYTON, NJ)
STATE MASTER (New Jersey environmental info) - NJEMS-132163, REFUSE DISPOSAL (Resource Conservation and Recovery Act (tracking hazardous waste)) Organizations: ELLIS ROBERT, OWNERNAME (CONTACT/OWNER)
Alternative names: ALMO ANTI-POLLUTION SYSTEMS
GUARROS CLEANERS (19 N DELSEA DR in CLAYTON, NJ)
STATE MASTER (New Jersey environmental info) - NJEMS-00000000348, EPCRA, NJEMS-L5509, AIR PROGRAM (Resource Conservation and Recovery Act (tracking hazardous waste)) Business SIC classification: DRYCLEANING PLANTS, EXCEPT RUG CLEANING; INDUSTRIAL LAUNDERERS
ABC TANK CO (1029 NORTH DELSEA DRIVE in CLAYTON, NJ)
STATE MASTER (New Jersey environmental info) - NJEMS-201949, REFUSE DISPOSAL, NJEMS-NJD986583417, TRANSPORTER Small Quantity Generators, between 100 kg and 1000 kg of hazardous waste/month (Resource Conservation and Recovery Act (tracking hazardous waste)) Alternative names: A B C TANK CO
GLOUCESTER CNTY (1200 N DELSEA DR in CLAYTON, NJ)
National Pollutant Discharge Elimination System NON-MAJOR (Tracking pollutant discharge elimination systems) - permit
APPLIED REFINERY SERVICES INC (CENCO BLVD in CLAYTON, NJ)
(Resource Conservation and Recovery Act (tracking hazardous waste)) Organizations: RICHARD SCHULTES (CONTACT/OWNER)
NJDEP - DIV OF ENVIRONMENTAL QUALITY (DELSEA DR in CLAYTON, NJ)
ABC WASTE OIL REMOVAL SERVICE INC (580 E CLAYTON AVE in CLAYTON, NJ)
(Resource Conservation and Recovery Act (tracking hazardous waste))
GERALD A BARRETT INC (ALMO IND. PARK in CLAYTON, NJ)
AIR MINOR (AIRS/AFS) Business SIC classification: NONCLASSIFIABLE ESTABLISHMENTS
GLOUCESTER COUNTY UTILITIES AUTHORITY (BERNARD ST PUMP STATION in CLAYTON, NJ)
(Resource Conservation and Recovery Act (tracking hazardous waste))
PACTIV CORP (838 N DELSEA DR - OUTER YARD in CLAYTON, NJ)
Small Quantity Generators, between 100 kg and 1000 kg of hazardous waste/month (Resource Conservation and Recovery Act (tracking hazardous waste)) - notification
BARRETT, GERALD A_INC (CENCO BLVD in CLAYTON, NJ)
AIR MAJOR (AIRS/AFS) Business SIC classification: ASPHALT PAVING MIXTURES AND BLOCKS; NONCLASSIFIABLE ESTABLISHMENTS
GLOUCESTER COUNTY PLANNING DEPT (NORTH DELSEA DR in CLAYTON, NJ)
Small Quantity Generators, between 100 kg and 1000 kg of hazardous waste/month (Resource Conservation and Recovery Act (tracking hazardous waste))
Housing units lacking complete plumbing facilities: 4.5% Housing units lacking complete kitchen facilities: 4.2%
74.8%Utility gas
19.6%Electricity
4.1%Fuel oil, kerosene, etc.
1.1%Bottled, tank, or LP gas
Population in 1990: 6,584. Population change in the 1990s: +483 (+7.3%).
Place of birth for U.S.-born residents:
This state: 5,090
Northeast: 2,055
Midwest: 75
South: 325
West: 169
68% of the 08312 zip code residents lived in the same house 5 years ago. Out of people who lived in different houses, 50% lived in this county. Out of people who lived in different counties, 50% lived in New Jersey.
95% of the 08312 zip code residents lived in the same house 1 year ago. Out of people who lived in different houses, 54% moved from this county. Out of people who lived in different houses, 25% moved from different county within same state. Out of people who lived in different houses, 14% moved from different state. Out of people who lived in different houses, 8% moved from abroad.
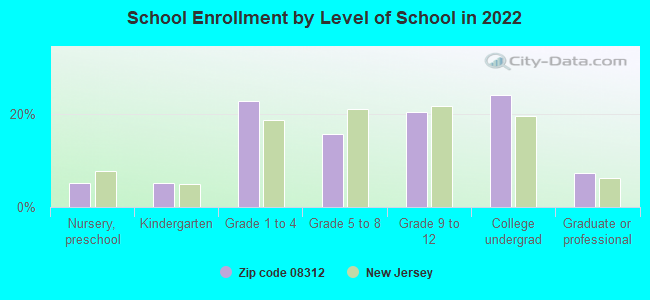
Private vs. public school enrollment:
Students in private schools in grades 1 to 8 (elementary and middle school): 67
Here:
7.7%
New Jersey:
12.3%
Students in private schools in grades 9 to 12 (high school): 47
Here:
10.3%
New Jersey:
13.1%
Students in private undergraduate colleges: 130
Here:
24.0%
New Jersey:
33.2%
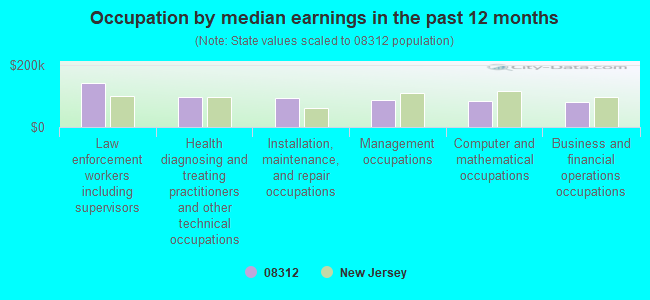
Occupation by median earnings in the past 12 months ($)
142,928Law enforcement workers including supervisors
98,366Health diagnosing and treating practitioners and other technical occupations
92,955Installation, maintenance, and repair occupations
87,464Management occupations
83,703Computer and mathematical occupations
81,916Business and financial operations occupations
Companies with federal contracts located in this zip code:
SHOREWAY INDUSTRY (260 W CLAYTON AVE in CLAYTON, NJ; small business) : $176,624 in 18 contractsfrom 2001 to 2005
Contracts for Bearings, Plain, Unmounted, Hardware, Commercial, Bushings, Rings, Shims, and Spacers, Aircraft Ground Servicing Equipment, and moreby Defense Logistics Agency, Army Signed by year:2000: $0; 2001: $61,530; 2002: $0; 2003: $0; 2004: $50,085; 2005: $65,009; 2006: $0.
Biggest contracts:
$61,530 with Defense Logistics Agency for Bearings, Plain, Unmounted. Signed on 2001-08-23. Completion date: 2001-12-21.
$40,000 with Defense Logistics Agency for Hardware, Commercial. Signed on 2005-02-15. Completion date: 2005-05-31.
$17,550 with Defense Logistics Agency for Bushings, Rings, Shims, and Spacers. Signed on 2004-11-24. Completion date: 2005-01-25.
$9,116 with Defense Logistics Agency for Aircraft Ground Servicing Equipment. Signed on 2004-10-28. Completion date: 2005-01-27.
BKC INDUSTRIES INC (34 MORGAN DR in CLAYTON, NJ; small business) : $90,758 in 4 contractsfrom 2003 to 2005
$29,573 with Army for Miscellaneous Items. Signed on 2003-09-04. Completion date: 2003-11-21.
$22,286 with Army for Miscellaneous Welding, Soldering, and Brazing Supplies and Accessories. Signed on 2004-08-26. Completion date: 2004-09-14.
$19,700 with Army for Safety and Rescue Equipment. Signed on 2004-04-06. Completion date: 2004-05-24.
$19,199, same as above.Signed on 2005-09-12. Completion date: 2005-10-14.
Top industries in this zip code by the number of employees in 2005:
Health Care and Social Assistance: Child Day Care Services (50-99 employees: 1 establishment, 10-19 employees: 1 establishment, 5-9 employees: 1 establishment)
Construction: Other Building Finishing Contractors (20-49: 1)
Construction: Electrical Contractors (20-49: 1)
Construction: Other Foundation, Structure, and Building Exterior Contractors (20-49: 1)
People in group quarters in 2000:
10 people in unknown juvenile institutions
6 people in other noninstitutional group quarters
5 people in homes or halfway houses for drug/alcohol abuse
2 people in other nonhousehold living situations
Fatal accident statistics in 2010:
Fatal accident count: 1
Vehicles involved in fatal accidents: 1
Fatal accidents caused by drunken drivers: 0
Fatalities: 1
Persons involved in fatal accidents: 4
Pedestrians involved in fatal accidents: 0
Home Mortgage Disclosure Act Aggregated Statistics For Year 2009 (Based on 2 full tracts)
A) FHA, FSA/RHS & VA Home Purchase Loans
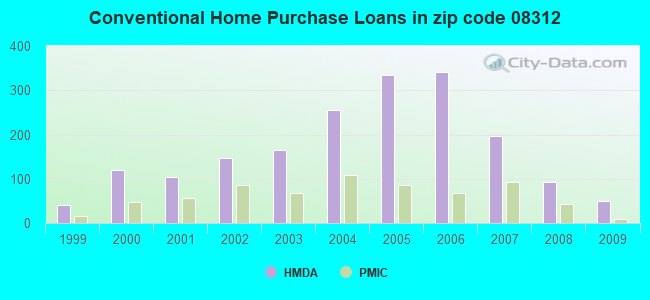
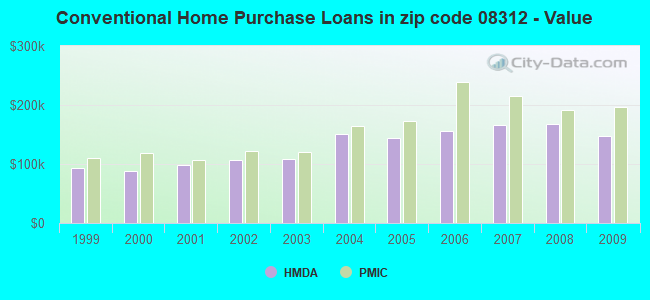
B) Conventional Home Purchase Loans
C) Refinancings
D) Home Improvement Loans
F) Non-occupant Loans on < 5 Family Dwellings (A B C & D)
G) Loans On Manufactured Home Dwelling (A B C & D)
Number
Average Value
Number
Average Value
Number
Average Value
Number
Average Value
Number
Average Value
Number
Average Value
LOANS ORIGINATED
119
$171,566
50
$147,606
346
$157,375
61
$31,125
17
$101,448
2
$48,755
APPLICATIONS APPROVED, NOT ACCEPTED
4
$191,678
4
$177,815
50
$164,126
6
$35,690
0
$0
0
$0
APPLICATIONS DENIED
25
$176,898
11
$125,496
172
$165,710
27
$27,476
10
$121,794
0
$0
APPLICATIONS WITHDRAWN
13
$149,725
6
$177,497
113
$190,980
8
$123,324
0
$0
0
$0
FILES CLOSED FOR INCOMPLETENESS
4
$150,570
2
$152,960
34
$184,283
2
$88,910
0
$0
0
$0
Aggregated Statistics For Year 2008 (Based on 2 full tracts)
A) FHA, FSA/RHS & VA Home Purchase Loans
B) Conventional Home Purchase Loans
C) Refinancings
D) Home Improvement Loans
F) Non-occupant Loans on < 5 Family Dwellings (A B C & D)
G) Loans On Manufactured Home Dwelling (A B C & D)
Number
Average Value
Number
Average Value
Number
Average Value
Number
Average Value
Number
Average Value
Number
Average Value
LOANS ORIGINATED
82
$189,801
92
$168,007
306
$151,098
101
$42,121
31
$116,570
2
$45,890
APPLICATIONS APPROVED, NOT ACCEPTED
2
$139,575
17
$177,366
63
$146,071
21
$36,328
4
$140,532
2
$44,930
APPLICATIONS DENIED
13
$178,698
21
$187,558
184
$183,490
99
$40,577
13
$116,779
0
$0
APPLICATIONS WITHDRAWN
10
$176,669
19
$163,727
111
$169,014
13
$69,568
8
$71,939
0
$0
FILES CLOSED FOR INCOMPLETENESS
0
$0
4
$151,525
42
$193,294
2
$143,400
0
$0
0
$0
Aggregated Statistics For Year 2007 (Based on 2 full tracts)
A) FHA, FSA/RHS & VA Home Purchase Loans
B) Conventional Home Purchase Loans
C) Refinancings
D) Home Improvement Loans
F) Non-occupant Loans on < 5 Family Dwellings (A B C & D)
Number
Average Value
Number
Average Value
Number
Average Value
Number
Average Value
Number
Average Value
LOANS ORIGINATED
29
$183,552
197
$166,742
447
$140,962
122
$44,869
38
$122,519
APPLICATIONS APPROVED, NOT ACCEPTED
4
$236,610
29
$161,003
84
$157,376
29
$36,130
11
$135,578
APPLICATIONS DENIED
6
$242,505
50
$208,484
377
$163,631
130
$45,535
15
$198,848
APPLICATIONS WITHDRAWN
8
$203,389
42
$197,801
176
$165,812
8
$40,869
4
$59,272
FILES CLOSED FOR INCOMPLETENESS
0
$0
6
$149,137
67
$178,729
0
$0
0
$0
Aggregated Statistics For Year 2006 (Based on 2 full tracts)
A) FHA, FSA/RHS & VA Home Purchase Loans
B) Conventional Home Purchase Loans
C) Refinancings
D) Home Improvement Loans
E) Loans on Dwellings For 5+ Families
F) Non-occupant Loans on < 5 Family Dwellings (A B C & D)
G) Loans On Manufactured Home Dwelling (A B C & D)
Number
Average Value
Number
Average Value
Number
Average Value
Number
Average Value
Number
Average Value
Number
Average Value
Number
Average Value
LOANS ORIGINATED
42
$191,701
342
$156,258
522
$135,232
126
$37,861
2
$139,575
48
$109,382
4
$40,630
APPLICATIONS APPROVED, NOT ACCEPTED
0
$0
36
$138,726
109
$150,031
27
$26,626
0
$0
10
$95,600
0
$0
APPLICATIONS DENIED
4
$195,502
84
$146,427
340
$148,377
107
$33,594
0
$0
29
$134,499
4
$124,280
APPLICATIONS WITHDRAWN
4
$146,268
61
$139,764
260
$142,996
11
$95,253
0
$0
17
$164,994
0
$0
FILES CLOSED FOR INCOMPLETENESS
0
$0
17
$132,603
67
$147,253
2
$52,580
0
$0
2
$122,370
0
$0
Aggregated Statistics For Year 2005 (Based on 2 full tracts)
A) FHA, FSA/RHS & VA Home Purchase Loans
B) Conventional Home Purchase Loans
C) Refinancings
D) Home Improvement Loans
F) Non-occupant Loans on < 5 Family Dwellings (A B C & D)
G) Loans On Manufactured Home Dwelling (A B C & D)
Number
Average Value
Number
Average Value
Number
Average Value
Number
Average Value
Number
Average Value
Number
Average Value
LOANS ORIGINATED
42
$145,858
335
$144,781
556
$137,379
166
$42,145
46
$85,749
2
$34,415
APPLICATIONS APPROVED, NOT ACCEPTED
0
$0
25
$145,694
96
$118,723
29
$30,526
2
$120,455
0
$0
APPLICATIONS DENIED
2
$145,310
84
$130,949
352
$129,429
120
$48,995
27
$75,559
13
$122,515
APPLICATIONS WITHDRAWN
2
$120,455
44
$150,092
382
$138,915
38
$102,242
15
$83,745
4
$76,480
FILES CLOSED FOR INCOMPLETENESS
0
$0
10
$143,591
59
$149,039
2
$18,165
4
$107,072
0
$0
Aggregated Statistics For Year 2004 (Based on 2 full tracts)
A) FHA, FSA/RHS & VA Home Purchase Loans
B) Conventional Home Purchase Loans
C) Refinancings
D) Home Improvement Loans
F) Non-occupant Loans on < 5 Family Dwellings (A B C & D)
G) Loans On Manufactured Home Dwelling (A B C & D)
Number
Average Value
Number
Average Value
Number
Average Value
Number
Average Value
Number
Average Value
Number
Average Value
LOANS ORIGINATED
46
$165,596
256
$150,465
501
$113,331
98
$39,177
52
$109,646
2
$80,305
APPLICATIONS APPROVED, NOT ACCEPTED
10
$31,357
15
$150,921
82
$105,510
27
$46,313
10
$17,782
0
$0
APPLICATIONS DENIED
2
$118,545
46
$150,300
270
$108,290
90
$29,232
15
$87,187
0
$0
APPLICATIONS WITHDRAWN
2
$229,440
50
$135,981
249
$113,653
23
$44,807
11
$85,518
2
$162,520
FILES CLOSED FOR INCOMPLETENESS
2
$86,995
10
$162,520
11
$163,389
2
$19,120
0
$0
2
$20,075
Aggregated Statistics For Year 2003 (Based on 2 full tracts)
A) FHA, FSA/RHS & VA Home Purchase Loans
B) Conventional Home Purchase Loans
C) Refinancings
D) Home Improvement Loans
F) Non-occupant Loans on < 5 Family Dwellings (A B C & D)
Number
Average Value
Number
Average Value
Number
Average Value
Number
Average Value
Number
Average Value
LOANS ORIGINATED
67
$115,605
164
$108,145
780
$105,694
80
$34,727
46
$87,993
APPLICATIONS APPROVED, NOT ACCEPTED
2
$119,500
17
$113,483
203
$93,274
25
$22,409
4
$74,568
APPLICATIONS DENIED
6
$108,983
44
$89,169
386
$89,146
120
$25,605
10
$52,962
APPLICATIONS WITHDRAWN
11
$148,441
23
$94,852
277
$100,680
6
$10,197
8
$65,486
FILES CLOSED FOR INCOMPLETENESS
2
$92,730
6
$70,743
48
$107,550
6
$23,900
2
$95,600
Aggregated Statistics For Year 2002 (Based on 2 full tracts)
A) FHA, FSA/RHS & VA Home Purchase Loans
B) Conventional Home Purchase Loans
C) Refinancings
D) Home Improvement Loans
E) Loans on Dwellings For 5+ Families
F) Non-occupant Loans on < 5 Family Dwellings (A B C & D)
Number
Average Value
Number
Average Value
Number
Average Value
Number
Average Value
Number
Average Value
Number
Average Value
LOANS ORIGINATED
84
$107,778
147
$106,188
484
$93,301
119
$25,820
0
$0
34
$69,676
APPLICATIONS APPROVED, NOT ACCEPTED
11
$114,546
8
$86,996
107
$85,164
17
$39,477
0
$0
0
$0
APPLICATIONS DENIED
4
$145,790
27
$70,815
254
$74,877
67
$27,110
2
$358,500
10
$42,064
APPLICATIONS WITHDRAWN
4
$80,782
11
$126,540
176
$94,372
10
$35,372
0
$0
10
$135,752
FILES CLOSED FOR INCOMPLETENESS
2
$73,610
2
$9,560
17
$86,602
2
$19,120
0
$0
0
$0
Aggregated Statistics For Year 2001 (Based on 2 full tracts)
A) FHA, FSA/RHS & VA Home Purchase Loans
B) Conventional Home Purchase Loans
C) Refinancings
D) Home Improvement Loans
E) Loans on Dwellings For 5+ Families
F) Non-occupant Loans on < 5 Family Dwellings (A B C & D)
Number
Average Value
Number
Average Value
Number
Average Value
Number
Average Value
Number
Average Value
Number
Average Value
LOANS ORIGINATED
55
$105,994
105
$98,896
337
$88,871
80
$21,223
0
$0
17
$74,905
APPLICATIONS APPROVED, NOT ACCEPTED
2
$85,085
11
$121,325
78
$74,470
29
$23,076
0
$0
6
$84,447
APPLICATIONS DENIED
8
$123,562
23
$81,883
233
$70,908
61
$21,220
0
$0
13
$60,155
APPLICATIONS WITHDRAWN
10
$108,028
15
$100,061
164
$78,870
17
$32,392
2
$160,610
2
$57,360
FILES CLOSED FOR INCOMPLETENESS
2
$70,745
2
$81,260
38
$107,173
0
$0
0
$0
0
$0
Aggregated Statistics For Year 2000 (Based on 2 full tracts)
A) FHA, FSA/RHS & VA Home Purchase Loans
B) Conventional Home Purchase Loans
C) Refinancings
D) Home Improvement Loans
F) Non-occupant Loans on < 5 Family Dwellings (A B C & D)
Number
Average Value
Number
Average Value
Number
Average Value
Number
Average Value
Number
Average Value
LOANS ORIGINATED
63
$99,606
120
$88,494
120
$65,056
80
$20,052
21
$56,359
APPLICATIONS APPROVED, NOT ACCEPTED
4
$130,495
15
$89,481
50
$87,837
38
$25,963
0
$0
APPLICATIONS DENIED
6
$105,478
21
$66,010
164
$54,795
71
$23,967
8
$45,888
APPLICATIONS WITHDRAWN
10
$124,280
25
$82,292
105
$60,383
8
$33,460
10
$59,272
FILES CLOSED FOR INCOMPLETENESS
0
$0
2
$75,525
19
$66,819
2
$19,120
2
$49,710
Aggregated Statistics For Year 1999 (Based on 1 full tract)
A) FHA, FSA/RHS & VA Home Purchase Loans
B) Conventional Home Purchase Loans
C) Refinancings
D) Home Improvement Loans
F) Non-occupant Loans on < 5 Family Dwellings (A B C & D)
Detailed PMIC statistics for the following Tracts:5015.00
2002 - 2018 National Fire Incident Reporting System (NFIRS) incidents
Based on the data from the years 2002 - 2018 the average number of fires per year is 15. The highest number of fire incidents - 30 took place in 2005, and the least - 0 in 2003. The data has a rising trend.
When looking into fire subcategories, the most incidents belonged to: Structure Fires (54.8%), and Outside Fires (39.6%).
Fire incident types reported to NFIRS in Zip Code 08312


 Nearest zip codes: 08028, 08322, 08328, 08071, 08343, 08074.


 Based on the data from the years 2002 - 2018 the average number of fires per year is 15. The highest number of fire incidents - 30 took place in 2005, and the least - 0 in 2003. The data has a rising trend.
 When looking into fire subcategories, the most incidents belonged to: Structure Fires (54.8%), and Outside Fires (39.6%).