Estimated zip code population in 2022: 13,558
Zip code population in 2010: 13,269
Zip code population in 2000: 13,889
Houses and condos: 5,758
Renter-occupied apartments: 2,024
% of renters here:
39%State:
35%
March 2022 cost of living index in zip code 07734: 116.5
(more than average, U.S. average is 100)
Land area: 1.8
sq. mi.
Water area: 0.4
sq. mi.
Population density: 7,649 people per square mile (high).
OSM Map
Google Map
MSN Map
OSM Map
General Map
Google Map
MSN Map
OSM Map
Google Map
MSN Map
OSM Map
Google Map
MSN Map
Please wait while loading the map...
Real estate property taxes paid for housing units in 2022:
This zip code:
2.1% ($6,290)New Jersey:
2.1% ($8,897)
Median real estate property taxes paid for housing units with mortgages in 2022: $6,305 (2.0%)
Median real estate property taxes paid for housing units with no mortgage in 2022: $6,293 (2.3%)
Business Search - 14 Million verified businesses
Males: 6,463 Females: 7,094
For population 25 years and over in 07734:
High school or higher: 84.8%Bachelor's degree or higher: 19.4%Graduate or professional degree: 3.9%Unemployed: 3.5%Mean travel time to work (commute): 30.6 minutes
For population 15 years and over in 07734:
Never married: 36.6%Now married: 44.2%Separated: 2.5%Widowed: 5.0%Divorced: 11.7%
Zip code 07734 compared to state average:
Foreign-born population percentage significantly below state average. Length of stay since moving in significantly above state average. Percentage of population with a bachelor's degree or higher below state average. 9,338 68.9% White 2,191 16.2% Hispanic or Latino 1,266 9.3% Black 476 3.5% Two or more races 198 1.5% Asian 82 0.6% Some other race 4 0.03% Native Hawaiian and Other
Data:
Median household income ($)
Median household income (% change since 2000)
Household income diversity
Ratio of average income to average house value (%)
Ratio of average income to average rent
Median household income ($) - White
Median household income ($) - Black or African American
Median household income ($) - Asian
Median household income ($) - Hispanic or Latino
Median household income ($) - American Indian and Alaska Native
Median household income ($) - Multirace
Median household income ($) - Other Race
Median household income for houses/condos with a mortgage ($)
Median household income for apartments without a mortgage ($)
Races - White alone (%)
Races - White alone (% change since 2000)
Races - Black alone (%)
Races - Black alone (% change since 2000)
Races - American Indian alone (%)
Races - American Indian alone (% change since 2000)
Races - Asian alone (%)
Races - Asian alone (% change since 2000)
Races - Hispanic (%)
Races - Hispanic (% change since 2000)
Races - Native Hawaiian and Other Pacific Islander alone (%)
Races - Native Hawaiian and Other Pacific Islander alone (% change since 2000)
Races - Two or more races (%)
Races - Two or more races (% change since 2000)
Races - Other race alone (%)
Races - Other race alone (% change since 2000)
Racial diversity
Unemployment (%)
Unemployment (% change since 2000)
Unemployment (%) - White
Unemployment (%) - Black or African American
Unemployment (%) - Asian
Unemployment (%) - Hispanic or Latino
Unemployment (%) - American Indian and Alaska Native
Unemployment (%) - Multirace
Unemployment (%) - Other Race
Population density (people per square mile)
Population - Males (%)
Population - Females (%)
Population - Males (%) - White
Population - Males (%) - Black or African American
Population - Males (%) - Asian
Population - Males (%) - Hispanic or Latino
Population - Males (%) - American Indian and Alaska Native
Population - Males (%) - Multirace
Population - Males (%) - Other Race
Population - Females (%) - White
Population - Females (%) - Black or African American
Population - Females (%) - Asian
Population - Females (%) - Hispanic or Latino
Population - Females (%) - American Indian and Alaska Native
Population - Females (%) - Multirace
Population - Females (%) - Other Race
Coronavirus confirmed cases (Jun 04, 2024)
Deaths caused by coronavirus (Jun 04, 2024)
Coronavirus confirmed cases (per 100k population) (Jun 04, 2024)
Deaths caused by coronavirus (per 100k population) (Jun 04, 2024)
Daily increase in number of cases (Jun 04, 2024)
Weekly increase in number of cases (Jun 04, 2024)
Cases doubled (in days) (Jun 04, 2024)
Hospitalized patients (Apr 18, 2022)
Negative test results (Apr 18, 2022)
Total test results (Apr 18, 2022)
COVID Vaccine doses distributed (per 100k population) (Sep 19, 2023)
COVID Vaccine doses administered (per 100k population) (Sep 19, 2023)
COVID Vaccine doses distributed (Sep 19, 2023)
COVID Vaccine doses administered (Sep 19, 2023)
Likely homosexual households (%)
Likely homosexual households (% change since 2000)
Likely homosexual households - Lesbian couples (%)
Likely homosexual households - Lesbian couples (% change since 2000)
Likely homosexual households - Gay men (%)
Likely homosexual households - Gay men (% change since 2000)
Cost of living index
Median gross rent ($)
Median contract rent ($)
Median monthly housing costs ($)
Median house or condo value ($)
Median house or condo value ($ change since 2000)
Mean house or condo value by units in structure - 1, detached ($)
Mean house or condo value by units in structure - 1, attached ($)
Mean house or condo value by units in structure - 2 ($)
Mean house or condo value by units in structure by units in structure - 3 or 4 ($)
Mean house or condo value by units in structure - 5 or more ($)
Mean house or condo value by units in structure - Boat, RV, van, etc. ($)
Mean house or condo value by units in structure - Mobile home ($)
Median house or condo value ($) - White
Median house or condo value ($) - Black or African American
Median house or condo value ($) - Asian
Median house or condo value ($) - Hispanic or Latino
Median house or condo value ($) - American Indian and Alaska Native
Median house or condo value ($) - Multirace
Median house or condo value ($) - Other Race
Median resident age
Resident age diversity
Median resident age - Males
Median resident age - Females
Median resident age - White
Median resident age - Black or African American
Median resident age - Asian
Median resident age - Hispanic or Latino
Median resident age - American Indian and Alaska Native
Median resident age - Multirace
Median resident age - Other Race
Median resident age - Males - White
Median resident age - Males - Black or African American
Median resident age - Males - Asian
Median resident age - Males - Hispanic or Latino
Median resident age - Males - American Indian and Alaska Native
Median resident age - Males - Multirace
Median resident age - Males - Other Race
Median resident age - Females - White
Median resident age - Females - Black or African American
Median resident age - Females - Asian
Median resident age - Females - Hispanic or Latino
Median resident age - Females - American Indian and Alaska Native
Median resident age - Females - Multirace
Median resident age - Females - Other Race
Commute - mean travel time to work (minutes)
Travel time to work - Less than 5 minutes (%)
Travel time to work - Less than 5 minutes (% change since 2000)
Travel time to work - 5 to 9 minutes (%)
Travel time to work - 5 to 9 minutes (% change since 2000)
Travel time to work - 10 to 19 minutes (%)
Travel time to work - 10 to 19 minutes (% change since 2000)
Travel time to work - 20 to 29 minutes (%)
Travel time to work - 20 to 29 minutes (% change since 2000)
Travel time to work - 30 to 39 minutes (%)
Travel time to work - 30 to 39 minutes (% change since 2000)
Travel time to work - 40 to 59 minutes (%)
Travel time to work - 40 to 59 minutes (% change since 2000)
Travel time to work - 60 to 89 minutes (%)
Travel time to work - 60 to 89 minutes (% change since 2000)
Travel time to work - 90 or more minutes (%)
Travel time to work - 90 or more minutes (% change since 2000)
Marital status - Never married (%)
Marital status - Now married (%)
Marital status - Separated (%)
Marital status - Widowed (%)
Marital status - Divorced (%)
Median family income ($)
Median family income (% change since 2000)
Median non-family income ($)
Median non-family income (% change since 2000)
Median per capita income ($)
Median per capita income (% change since 2000)
Median family income ($) - White
Median family income ($) - Black or African American
Median family income ($) - Asian
Median family income ($) - Hispanic or Latino
Median family income ($) - American Indian and Alaska Native
Median family income ($) - Multirace
Median family income ($) - Other Race
Median year house/condo built
Median year apartment built
Year house built - Built 2005 or later (%)
Year house built - Built 2000 to 2004 (%)
Year house built - Built 1990 to 1999 (%)
Year house built - Built 1980 to 1989 (%)
Year house built - Built 1970 to 1979 (%)
Year house built - Built 1960 to 1969 (%)
Year house built - Built 1950 to 1959 (%)
Year house built - Built 1940 to 1949 (%)
Year house built - Built 1939 or earlier (%)
Average household size
Household density (households per square mile)
Average household size - White
Average household size - Black or African American
Average household size - Asian
Average household size - Hispanic or Latino
Average household size - American Indian and Alaska Native
Average household size - Multirace
Average household size - Other Race
Occupied housing units (%)
Vacant housing units (%)
Owner occupied housing units (%)
Renter occupied housing units (%)
Vacancy status - For rent (%)
Vacancy status - For sale only (%)
Vacancy status - Rented or sold, not occupied (%)
Vacancy status - For seasonal, recreational, or occasional use (%)
Vacancy status - For migrant workers (%)
Vacancy status - Other vacant (%)
Residents with income below the poverty level (%)
Residents with income below 50% of the poverty level (%)
Children below poverty level (%)
Poor families by family type - Married-couple family (%)
Poor families by family type - Male, no wife present (%)
Poor families by family type - Female, no husband present (%)
Poverty status for native-born residents (%)
Poverty status for foreign-born residents (%)
Poverty among high school graduates not in families (%)
Poverty among people who did not graduate high school not in families (%)
Residents with income below the poverty level (%) - White
Residents with income below the poverty level (%) - Black or African American
Residents with income below the poverty level (%) - Asian
Residents with income below the poverty level (%) - Hispanic or Latino
Residents with income below the poverty level (%) - American Indian and Alaska Native
Residents with income below the poverty level (%) - Multirace
Residents with income below the poverty level (%) - Other Race
Air pollution - Air Quality Index (AQI)
Air pollution - CO
Air pollution - NO2
Air pollution - SO2
Air pollution - Ozone
Air pollution - PM10
Air pollution - PM25
Air pollution - Pb
Crime - Murders per 100,000 population
Crime - Rapes per 100,000 population
Crime - Robberies per 100,000 population
Crime - Assaults per 100,000 population
Crime - Burglaries per 100,000 population
Crime - Thefts per 100,000 population
Crime - Auto thefts per 100,000 population
Crime - Arson per 100,000 population
Crime - City-data.com crime index
Crime - Violent crime index
Crime - Property crime index
Crime - Murders per 100,000 population (5 year average)
Crime - Rapes per 100,000 population (5 year average)
Crime - Robberies per 100,000 population (5 year average)
Crime - Assaults per 100,000 population (5 year average)
Crime - Burglaries per 100,000 population (5 year average)
Crime - Thefts per 100,000 population (5 year average)
Crime - Auto thefts per 100,000 population (5 year average)
Crime - Arson per 100,000 population (5 year average)
Crime - City-data.com crime index (5 year average)
Crime - Violent crime index (5 year average)
Crime - Property crime index (5 year average)
1996 Presidential Elections Results (%) - Democratic Party (Clinton)
1996 Presidential Elections Results (%) - Republican Party (Dole)
1996 Presidential Elections Results (%) - Other
2000 Presidential Elections Results (%) - Democratic Party (Gore)
2000 Presidential Elections Results (%) - Republican Party (Bush)
2000 Presidential Elections Results (%) - Other
2004 Presidential Elections Results (%) - Democratic Party (Kerry)
2004 Presidential Elections Results (%) - Republican Party (Bush)
2004 Presidential Elections Results (%) - Other
2008 Presidential Elections Results (%) - Democratic Party (Obama)
2008 Presidential Elections Results (%) - Republican Party (McCain)
2008 Presidential Elections Results (%) - Other
2012 Presidential Elections Results (%) - Democratic Party (Obama)
2012 Presidential Elections Results (%) - Republican Party (Romney)
2012 Presidential Elections Results (%) - Other
2016 Presidential Elections Results (%) - Democratic Party (Clinton)
2016 Presidential Elections Results (%) - Republican Party (Trump)
2016 Presidential Elections Results (%) - Other
2020 Presidential Elections Results (%) - Democratic Party (Biden)
2020 Presidential Elections Results (%) - Republican Party (Trump)
2020 Presidential Elections Results (%) - Other
Ancestries Reported - Arab (%)
Ancestries Reported - Czech (%)
Ancestries Reported - Danish (%)
Ancestries Reported - Dutch (%)
Ancestries Reported - English (%)
Ancestries Reported - French (%)
Ancestries Reported - French Canadian (%)
Ancestries Reported - German (%)
Ancestries Reported - Greek (%)
Ancestries Reported - Hungarian (%)
Ancestries Reported - Irish (%)
Ancestries Reported - Italian (%)
Ancestries Reported - Lithuanian (%)
Ancestries Reported - Norwegian (%)
Ancestries Reported - Polish (%)
Ancestries Reported - Portuguese (%)
Ancestries Reported - Russian (%)
Ancestries Reported - Scotch-Irish (%)
Ancestries Reported - Scottish (%)
Ancestries Reported - Slovak (%)
Ancestries Reported - Subsaharan African (%)
Ancestries Reported - Swedish (%)
Ancestries Reported - Swiss (%)
Ancestries Reported - Ukrainian (%)
Ancestries Reported - United States (%)
Ancestries Reported - Welsh (%)
Ancestries Reported - West Indian (%)
Ancestries Reported - Other (%)
Educational Attainment - No schooling completed (%)
Educational Attainment - Less than high school (%)
Educational Attainment - High school or equivalent (%)
Educational Attainment - Less than 1 year of college (%)
Educational Attainment - 1 or more years of college (%)
Educational Attainment - Associate degree (%)
Educational Attainment - Bachelor's degree (%)
Educational Attainment - Master's degree (%)
Educational Attainment - Professional school degree (%)
Educational Attainment - Doctorate degree (%)
School Enrollment - Nursery, preschool (%)
School Enrollment - Kindergarten (%)
School Enrollment - Grade 1 to 4 (%)
School Enrollment - Grade 5 to 8 (%)
School Enrollment - Grade 9 to 12 (%)
School Enrollment - College undergrad (%)
School Enrollment - Graduate or professional (%)
School Enrollment - Not enrolled in school (%)
School enrollment - Public schools (%)
School enrollment - Private schools (%)
School enrollment - Not enrolled (%)
Median number of rooms in houses and condos
Median number of rooms in apartments
Housing units lacking complete plumbing facilities (%)
Housing units lacking complete kitchen facilities (%)
Density of houses
Urban houses (%)
Rural houses (%)
Households with people 60 years and over (%)
Households with people 65 years and over (%)
Households with people 75 years and over (%)
Households with one or more nonrelatives (%)
Households with no nonrelatives (%)
Population in households (%)
Family households (%)
Nonfamily households (%)
Population in families (%)
Family households with own children (%)
Median number of bedrooms in owner occupied houses
Mean number of bedrooms in owner occupied houses
Median number of bedrooms in renter occupied houses
Mean number of bedrooms in renter occupied houses
Median number of vehichles in owner occupied houses
Mean number of vehichles in owner occupied houses
Median number of vehichles in renter occupied houses
Mean number of vehichles in renter occupied houses
Mortgage status - with mortgage (%)
Mortgage status - with second mortgage (%)
Mortgage status - with home equity loan (%)
Mortgage status - with both second mortgage and home equity loan (%)
Mortgage status - without a mortgage (%)
Average family size
Average family size - White
Average family size - Black or African American
Average family size - Asian
Average family size - Hispanic or Latino
Average family size - American Indian and Alaska Native
Average family size - Multirace
Average family size - Other Race
Geographical mobility - Same house 1 year ago (%)
Geographical mobility - Moved within same county (%)
Geographical mobility - Moved from different county within same state (%)
Geographical mobility - Moved from different state (%)
Geographical mobility - Moved from abroad (%)
Place of birth - Born in state of residence (%)
Place of birth - Born in other state (%)
Place of birth - Native, outside of US (%)
Place of birth - Foreign born (%)
Housing units in structures - 1, detached (%)
Housing units in structures - 1, attached (%)
Housing units in structures - 2 (%)
Housing units in structures - 3 or 4 (%)
Housing units in structures - 5 to 9 (%)
Housing units in structures - 10 to 19 (%)
Housing units in structures - 20 to 49 (%)
Housing units in structures - 50 or more (%)
Housing units in structures - Mobile home (%)
Housing units in structures - Boat, RV, van, etc. (%)
House/condo owner moved in on average (years ago)
Renter moved in on average (years ago)
Year householder moved into unit - Moved in 1999 to March 2000 (%)
Year householder moved into unit - Moved in 1995 to 1998 (%)
Year householder moved into unit - Moved in 1990 to 1994 (%)
Year householder moved into unit - Moved in 1980 to 1989 (%)
Year householder moved into unit - Moved in 1970 to 1979 (%)
Year householder moved into unit - Moved in 1969 or earlier (%)
Means of transportation to work - Drove car alone (%)
Means of transportation to work - Carpooled (%)
Means of transportation to work - Public transportation (%)
Means of transportation to work - Bus or trolley bus (%)
Means of transportation to work - Streetcar or trolley car (%)
Means of transportation to work - Subway or elevated (%)
Means of transportation to work - Railroad (%)
Means of transportation to work - Ferryboat (%)
Means of transportation to work - Taxicab (%)
Means of transportation to work - Motorcycle (%)
Means of transportation to work - Bicycle (%)
Means of transportation to work - Walked (%)
Means of transportation to work - Other means (%)
Working at home (%)
Industry diversity
Most Common Industries - Agriculture, forestry, fishing and hunting, and mining (%)
Most Common Industries - Agriculture, forestry, fishing and hunting (%)
Most Common Industries - Mining, quarrying, and oil and gas extraction (%)
Most Common Industries - Construction (%)
Most Common Industries - Manufacturing (%)
Most Common Industries - Wholesale trade (%)
Most Common Industries - Retail trade (%)
Most Common Industries - Transportation and warehousing, and utilities (%)
Most Common Industries - Transportation and warehousing (%)
Most Common Industries - Utilities (%)
Most Common Industries - Information (%)
Most Common Industries - Finance and insurance, and real estate and rental and leasing (%)
Most Common Industries - Finance and insurance (%)
Most Common Industries - Real estate and rental and leasing (%)
Most Common Industries - Professional, scientific, and management, and administrative and waste management services (%)
Most Common Industries - Professional, scientific, and technical services (%)
Most Common Industries - Management of companies and enterprises (%)
Most Common Industries - Administrative and support and waste management services (%)
Most Common Industries - Educational services, and health care and social assistance (%)
Most Common Industries - Educational services (%)
Most Common Industries - Health care and social assistance (%)
Most Common Industries - Arts, entertainment, and recreation, and accommodation and food services (%)
Most Common Industries - Arts, entertainment, and recreation (%)
Most Common Industries - Accommodation and food services (%)
Most Common Industries - Other services, except public administration (%)
Most Common Industries - Public administration (%)
Occupation diversity
Most Common Occupations - Management, business, science, and arts occupations (%)
Most Common Occupations - Management, business, and financial occupations (%)
Most Common Occupations - Management occupations (%)
Most Common Occupations - Business and financial operations occupations (%)
Most Common Occupations - Computer, engineering, and science occupations (%)
Most Common Occupations - Computer and mathematical occupations (%)
Most Common Occupations - Architecture and engineering occupations (%)
Most Common Occupations - Life, physical, and social science occupations (%)
Most Common Occupations - Education, legal, community service, arts, and media occupations (%)
Most Common Occupations - Community and social service occupations (%)
Most Common Occupations - Legal occupations (%)
Most Common Occupations - Education, training, and library occupations (%)
Most Common Occupations - Arts, design, entertainment, sports, and media occupations (%)
Most Common Occupations - Healthcare practitioners and technical occupations (%)
Most Common Occupations - Health diagnosing and treating practitioners and other technical occupations (%)
Most Common Occupations - Health technologists and technicians (%)
Most Common Occupations - Service occupations (%)
Most Common Occupations - Healthcare support occupations (%)
Most Common Occupations - Protective service occupations (%)
Most Common Occupations - Fire fighting and prevention, and other protective service workers including supervisors (%)
Most Common Occupations - Law enforcement workers including supervisors (%)
Most Common Occupations - Food preparation and serving related occupations (%)
Most Common Occupations - Building and grounds cleaning and maintenance occupations (%)
Most Common Occupations - Personal care and service occupations (%)
Most Common Occupations - Sales and office occupations (%)
Most Common Occupations - Sales and related occupations (%)
Most Common Occupations - Office and administrative support occupations (%)
Most Common Occupations - Natural resources, construction, and maintenance occupations (%)
Most Common Occupations - Farming, fishing, and forestry occupations (%)
Most Common Occupations - Construction and extraction occupations (%)
Most Common Occupations - Installation, maintenance, and repair occupations (%)
Most Common Occupations - Production, transportation, and material moving occupations (%)
Most Common Occupations - Production occupations (%)
Most Common Occupations - Transportation occupations (%)
Most Common Occupations - Material moving occupations (%)
People in Group quarters - Institutionalized population (%)
People in Group quarters - Correctional institutions (%)
People in Group quarters - Federal prisons and detention centers (%)
People in Group quarters - Halfway houses (%)
People in Group quarters - Local jails and other confinement facilities (including police lockups) (%)
People in Group quarters - Military disciplinary barracks (%)
People in Group quarters - State prisons (%)
People in Group quarters - Other types of correctional institutions (%)
People in Group quarters - Nursing homes (%)
People in Group quarters - Hospitals/wards, hospices, and schools for the handicapped (%)
People in Group quarters - Hospitals/wards and hospices for chronically ill (%)
People in Group quarters - Hospices or homes for chronically ill (%)
People in Group quarters - Military hospitals or wards for chronically ill (%)
People in Group quarters - Other hospitals or wards for chronically ill (%)
People in Group quarters - Hospitals or wards for drug/alcohol abuse (%)
People in Group quarters - Mental (Psychiatric) hospitals or wards (%)
People in Group quarters - Schools, hospitals, or wards for the mentally retarded (%)
People in Group quarters - Schools, hospitals, or wards for the physically handicapped (%)
People in Group quarters - Institutions for the deaf (%)
People in Group quarters - Institutions for the blind (%)
People in Group quarters - Orthopedic wards and institutions for the physically handicapped (%)
People in Group quarters - Wards in general hospitals for patients who have no usual home elsewhere (%)
People in Group quarters - Wards in military hospitals for patients who have no usual home elsewhere (%)
People in Group quarters - Juvenile institutions (%)
People in Group quarters - Long-term care (%)
People in Group quarters - Homes for abused, dependent, and neglected children (%)
People in Group quarters - Residential treatment centers for emotionally disturbed children (%)
People in Group quarters - Training schools for juvenile delinquents (%)
People in Group quarters - Short-term care, detention or diagnostic centers for delinquent children (%)
People in Group quarters - Type of juvenile institution unknown (%)
People in Group quarters - Noninstitutionalized population (%)
People in Group quarters - College dormitories (includes college quarters off campus) (%)
People in Group quarters - Military quarters (%)
People in Group quarters - On base (%)
People in Group quarters - Barracks, unaccompanied personnel housing (UPH), (Enlisted/Officer), ;and similar group living quarters for military personnel (%)
People in Group quarters - Transient quarters for temporary residents (%)
People in Group quarters - Military ships (%)
People in Group quarters - Group homes (%)
People in Group quarters - Homes or halfway houses for drug/alcohol abuse (%)
People in Group quarters - Homes for the mentally ill (%)
People in Group quarters - Homes for the mentally retarded (%)
People in Group quarters - Homes for the physically handicapped (%)
People in Group quarters - Other group homes (%)
People in Group quarters - Religious group quarters (%)
People in Group quarters - Dormitories (%)
People in Group quarters - Agriculture workers' dormitories on farms (%)
People in Group quarters - Job Corps and vocational training facilities (%)
People in Group quarters - Other workers' dormitories (%)
People in Group quarters - Crews of maritime vessels (%)
People in Group quarters - Other nonhousehold living situations (%)
People in Group quarters - Other noninstitutional group quarters (%)
Residents speaking English at home (%)
Residents speaking English at home - Born in the United States (%)
Residents speaking English at home - Native, born elsewhere (%)
Residents speaking English at home - Foreign born (%)
Residents speaking Spanish at home (%)
Residents speaking Spanish at home - Born in the United States (%)
Residents speaking Spanish at home - Native, born elsewhere (%)
Residents speaking Spanish at home - Foreign born (%)
Residents speaking other language at home (%)
Residents speaking other language at home - Born in the United States (%)
Residents speaking other language at home - Native, born elsewhere (%)
Residents speaking other language at home - Foreign born (%)
Class of Workers - Employee of private company (%)
Class of Workers - Self-employed in own incorporated business (%)
Class of Workers - Private not-for-profit wage and salary workers (%)
Class of Workers - Local government workers (%)
Class of Workers - State government workers (%)
Class of Workers - Federal government workers (%)
Class of Workers - Self-employed workers in own not incorporated business and Unpaid family workers (%)
House heating fuel used in houses and condos - Utility gas (%)
House heating fuel used in houses and condos - Bottled, tank, or LP gas (%)
House heating fuel used in houses and condos - Electricity (%)
House heating fuel used in houses and condos - Fuel oil, kerosene, etc. (%)
House heating fuel used in houses and condos - Coal or coke (%)
House heating fuel used in houses and condos - Wood (%)
House heating fuel used in houses and condos - Solar energy (%)
House heating fuel used in houses and condos - Other fuel (%)
House heating fuel used in houses and condos - No fuel used (%)
House heating fuel used in apartments - Utility gas (%)
House heating fuel used in apartments - Bottled, tank, or LP gas (%)
House heating fuel used in apartments - Electricity (%)
House heating fuel used in apartments - Fuel oil, kerosene, etc. (%)
House heating fuel used in apartments - Coal or coke (%)
House heating fuel used in apartments - Wood (%)
House heating fuel used in apartments - Solar energy (%)
House heating fuel used in apartments - Other fuel (%)
House heating fuel used in apartments - No fuel used (%)
Armed forces status - In Armed Forces (%)
Armed forces status - Civilian (%)
Armed forces status - Civilian - Veteran (%)
Armed forces status - Civilian - Nonveteran (%)
Fatal accidents locations in years 2005-2021
Fatal accidents locations in 2005
Fatal accidents locations in 2006
Fatal accidents locations in 2007
Fatal accidents locations in 2008
Fatal accidents locations in 2009
Fatal accidents locations in 2010
Fatal accidents locations in 2011
Fatal accidents locations in 2012
Fatal accidents locations in 2013
Fatal accidents locations in 2014
Fatal accidents locations in 2015
Fatal accidents locations in 2016
Fatal accidents locations in 2017
Fatal accidents locations in 2018
Fatal accidents locations in 2019
Fatal accidents locations in 2020
Fatal accidents locations in 2021
Alcohol use - People drinking some alcohol every month (%)
Alcohol use - People not drinking at all (%)
Alcohol use - Average days/month drinking alcohol
Alcohol use - Average drinks/week
Alcohol use - Average days/year people drink much
Audiometry - Average condition of hearing (%)
Audiometry - People that can hear a whisper from across a quiet room (%)
Audiometry - People that can hear normal voice from across a quiet room (%)
Audiometry - Ears ringing, roaring, buzzing (%)
Audiometry - Had a job exposure to loud noise (%)
Audiometry - Had off-work exposure to loud noise (%)
Blood Pressure & Cholesterol - Has high blood pressure (%)
Blood Pressure & Cholesterol - Checking blood pressure at home (%)
Blood Pressure & Cholesterol - Frequently checking blood cholesterol (%)
Blood Pressure & Cholesterol - Has high cholesterol level (%)
Consumer Behavior - Money monthly spent on food at supermarket/grocery store
Consumer Behavior - Money monthly spent on food at other stores
Consumer Behavior - Money monthly spent on eating out
Consumer Behavior - Money monthly spent on carryout/delivered foods
Consumer Behavior - Income spent on food at supermarket/grocery store (%)
Consumer Behavior - Income spent on food at other stores (%)
Consumer Behavior - Income spent on eating out (%)
Consumer Behavior - Income spent on carryout/delivered foods (%)
Current Health Status - General health condition (%)
Current Health Status - Blood donors (%)
Current Health Status - Has blood ever tested for HIV virus (%)
Current Health Status - Left-handed people (%)
Dermatology - People using sunscreen (%)
Diabetes - Diabetics (%)
Diabetes - Had a blood test for high blood sugar (%)
Diabetes - People taking insulin (%)
Diet Behavior & Nutrition - Diet health (%)
Diet Behavior & Nutrition - Milk product consumption (# of products/month)
Diet Behavior & Nutrition - Meals not home prepared (#/week)
Diet Behavior & Nutrition - Meals from fast food or pizza place (#/week)
Diet Behavior & Nutrition - Ready-to-eat foods (#/month)
Diet Behavior & Nutrition - Frozen meals/pizza (#/month)
Drug Use - People that ever used marijuana or hashish (%)
Drug Use - Ever used hard drugs (%)
Drug Use - Ever used any form of cocaine (%)
Drug Use - Ever used heroin (%)
Drug Use - Ever used methamphetamine (%)
Health Insurance - People covered by health insurance (%)
Kidney Conditions-Urology - Avg. # of times urinating at night
Medical Conditions - People with asthma (%)
Medical Conditions - People with anemia (%)
Medical Conditions - People with psoriasis (%)
Medical Conditions - People with overweight (%)
Medical Conditions - Elderly people having difficulties in thinking or remembering (%)
Medical Conditions - People who ever received blood transfusion (%)
Medical Conditions - People having trouble seeing even with glass/contacts (%)
Medical Conditions - People with arthritis (%)
Medical Conditions - People with gout (%)
Medical Conditions - People with congestive heart failure (%)
Medical Conditions - People with coronary heart disease (%)
Medical Conditions - People with angina pectoris (%)
Medical Conditions - People who ever had heart attack (%)
Medical Conditions - People who ever had stroke (%)
Medical Conditions - People with emphysema (%)
Medical Conditions - People with thyroid problem (%)
Medical Conditions - People with chronic bronchitis (%)
Medical Conditions - People with any liver condition (%)
Medical Conditions - People who ever had cancer or malignancy (%)
Mental Health - People who have little interest in doing things (%)
Mental Health - People feeling down, depressed, or hopeless (%)
Mental Health - People who have trouble sleeping or sleeping too much (%)
Mental Health - People feeling tired or having little energy (%)
Mental Health - People with poor appetite or overeating (%)
Mental Health - People feeling bad about themself (%)
Mental Health - People who have trouble concentrating on things (%)
Mental Health - People moving or speaking slowly or too fast (%)
Mental Health - People having thoughts they would be better off dead (%)
Oral Health - Average years since last visit a dentist
Oral Health - People embarrassed because of mouth (%)
Oral Health - People with gum disease (%)
Oral Health - General health of teeth and gums (%)
Oral Health - Average days a week using dental floss/device
Oral Health - Average days a week using mouthwash for dental problem
Oral Health - Average number of teeth
Pesticide Use - Households using pesticides to control insects (%)
Pesticide Use - Households using pesticides to kill weeds (%)
Physical Activity - People doing vigorous-intensity work activities (%)
Physical Activity - People doing moderate-intensity work activities (%)
Physical Activity - People walking or bicycling (%)
Physical Activity - People doing vigorous-intensity recreational activities (%)
Physical Activity - People doing moderate-intensity recreational activities (%)
Physical Activity - Average hours a day doing sedentary activities
Physical Activity - Average hours a day watching TV or videos
Physical Activity - Average hours a day using computer
Physical Functioning - People having limitations keeping them from working (%)
Physical Functioning - People limited in amount of work they can do (%)
Physical Functioning - People that need special equipment to walk (%)
Physical Functioning - People experiencing confusion/memory problems (%)
Physical Functioning - People requiring special healthcare equipment (%)
Prescription Medications - Average number of prescription medicines taking
Preventive Aspirin Use - Adults 40+ taking low-dose aspirin (%)
Reproductive Health - Vaginal deliveries (%)
Reproductive Health - Cesarean deliveries (%)
Reproductive Health - Deliveries resulted in a live birth (%)
Reproductive Health - Pregnancies resulted in a delivery (%)
Reproductive Health - Women breastfeeding newborns (%)
Reproductive Health - Women that had a hysterectomy (%)
Reproductive Health - Women that had both ovaries removed (%)
Reproductive Health - Women that have ever taken birth control pills (%)
Reproductive Health - Women taking birth control pills (%)
Reproductive Health - Women that have ever used Depo-Provera or injectables (%)
Reproductive Health - Women that have ever used female hormones (%)
Sexual Behavior - People 18+ that ever had sex (vaginal, anal, or oral) (%)
Sexual Behavior - Males 18+ that ever had vaginal sex with a woman (%)
Sexual Behavior - Males 18+ that ever performed oral sex on a woman (%)
Sexual Behavior - Males 18+ that ever had anal sex with a woman (%)
Sexual Behavior - Males 18+ that ever had any sex with a man (%)
Sexual Behavior - Females 18+ that ever had vaginal sex with a man (%)
Sexual Behavior - Females 18+ that ever performed oral sex on a man (%)
Sexual Behavior - Females 18+ that ever had anal sex with a man (%)
Sexual Behavior - Females 18+ that ever had any kind of sex with a woman (%)
Sexual Behavior - Average age people first had sex
Sexual Behavior - Average number of female sex partners in lifetime (males 18+)
Sexual Behavior - Average number of female vaginal sex partners in lifetime (males 18+)
Sexual Behavior - Average age people first performed oral sex on a woman (18+)
Sexual Behavior - Average number of woman performed oral sex on in lifetime (18+)
Sexual Behavior - Average number of male sex partners in lifetime (males 18+)
Sexual Behavior - Average number of male anal sex partners in lifetime (males 18+)
Sexual Behavior - Average age people first performed oral sex on a man (18+)
Sexual Behavior - Average number of male oral sex partners in lifetime (18+)
Sexual Behavior - People using protection when performing oral sex (%)
Sexual Behavior - Average number of times people have vaginal or anal sex a year
Sexual Behavior - People having sex without condom (%)
Sexual Behavior - Average number of male sex partners in lifetime (females 18+)
Sexual Behavior - Average number of male vaginal sex partners in lifetime (females 18+)
Sexual Behavior - Average number of female sex partners in lifetime (females 18+)
Sexual Behavior - Circumcised males 18+ (%)
Sleep Disorders - Average hours sleeping at night
Sleep Disorders - People that has trouble sleeping (%)
Smoking-Cigarette Use - People smoking cigarettes (%)
Taste & Smell - People 40+ having problems with smell (%)
Taste & Smell - People 40+ having problems with taste (%)
Taste & Smell - People 40+ that ever had wisdom teeth removed (%)
Taste & Smell - People 40+ that ever had tonsils teeth removed (%)
Taste & Smell - People 40+ that ever had a loss of consciousness because of a head injury (%)
Taste & Smell - People 40+ that ever had a broken nose or other serious injury to face or skull (%)
Taste & Smell - People 40+ that ever had two or more sinus infections (%)
Weight - Average height (inches)
Weight - Average weight (pounds)
Weight - Average BMI
Weight - People that are obese (%)
Weight - People that ever were obese (%)
Weight - People trying to lose weight (%)
100%
urban population.
Estimated median house/condo value in 2022: $302,602
07734:
$302,602New Jersey:
$428,900
Median resident age: This zip code:
42.2 yearsNew Jersey median age:
40.4 years
Average household size: This zip code:
2.6 peopleNew Jersey:
2.6 people
Averages for the 2020 tax year for zip code 07734, filed in 2021:
Average Adjusted Gross Income (AGI) in 2020: $53,007 (Individual Income Tax Returns) Here:
$53,007State:
$95,247
Salary/wage: $47,659 (reported on 85.3% of returns )Here:
$47,659State:
$80,635
(% of AGI for various income ranges: 1132.7% for AGIs below $25k , 3480.5% for AGIs $25k-50k , 6457.4% for AGIs $50k-75k , 9694.7% for AGIs $75k-100k , 17164.3% for AGIs $100k-200k , 51705.0% for AGIs over 200k ) Taxable interest for individuals: $584 (reported on 17.4% of returns )This zip code:
$584New Jersey:
$2,414
(% of AGI for various income ranges: 6.7% for AGIs below $25k , 8.6% for AGIs $25k-50k , 11.7% for AGIs $50k-75k , 28.6% for AGIs $75k-100k , 37.8% for AGIs $100k-200k , 72.5% for AGIs over 200k ) Ordinary dividends: $2,126 (reported on 11.8% of returns )(% of AGI for various income ranges: 10.3% for AGIs below $25k , 9.6% for AGIs $25k-50k , 23.3% for AGIs $50k-75k , 38.4% for AGIs $75k-100k , 156.1% for AGIs $100k-200k , 452.5% for AGIs over 200k ) Net capital gain/loss in AGI: +$6,381 (reported on 9.5% of returns )Here:
+$6,381State:
+$25,022
(% of AGI for various income ranges: 2.9% for AGIs below $25k , 15.6% for AGIs $25k-50k , 44.8% for AGIs $50k-75k , 58.8% for AGIs $75k-100k , 383.5% for AGIs $100k-200k , 2715.0% for AGIs over 200k ) Profit/loss from business: +$8,794 (reported on 11.4% of returns )Here:
+$8,794State:
+$18,035
(% of AGI for various income ranges: 89.3% for AGIs below $25k , 122.6% for AGIs $25k-50k , 60.5% for AGIs $50k-75k , 206.7% for AGIs $75k-100k , 398.8% for AGIs $100k-200k ) Taxable individual retirement arrangement distribution: $14,004 (reported on 4.3% of returns )07734:
$14,004New Jersey:
$21,558
(% of AGI for various income ranges: 21.2% for AGIs below $25k , 56.2% for AGIs $25k-50k , 92.3% for AGIs $50k-75k , 142.3% for AGIs $75k-100k , 304.1% for AGIs $100k-200k ) Total itemized deductions: $22,754 (reported on 9.5% of returns )Here:
$22,754State:
$32,863
(% of AGI for various income ranges: 39.4% for AGIs below $25k , 120.4% for AGIs $25k-50k , 451.1% for AGIs $50k-75k , 673.7% for AGIs $75k-100k , 952.7% for AGIs $100k-200k , 1707.5% for AGIs over 200k ) Charity contributions: $3,091 (reported on 7.2% of returns )(% of AGI for various income ranges: 10.8% for AGIs $25k-50k , 39.5% for AGIs $50k-75k , 61.2% for AGIs $75k-100k , 123.9% for AGIs $100k-200k , 292.5% for AGIs over 200k ) Taxes paid: $8,458 (reported on 9.5% of returns )(% of AGI for various income ranges: 10.6% for AGIs below $25k , 43.1% for AGIs $25k-50k , 164.5% for AGIs $50k-75k , 276.3% for AGIs $75k-100k , 353.3% for AGIs $100k-200k , 627.5% for AGIs over 200k ) Earned income credit: $2,202 (reported on 18.5% of returns )(% of AGI for various income ranges: 99.9% for AGIs below $25k , 74.5% for AGIs $25k-50k ) Percentage of individuals using paid preparers for their 2020 taxes: 92.6%(% for various income ranges: 92.0% for AGIs below $25k , 92.9% for AGIs $25k-50k , 93.2% for AGIs $50k-75k , 91.9% for AGIs $75k-100k , 93.6% for AGIs $100k-200k , 90.0% for AGIs over 200k )
Averages for the 2012 tax year for zip code 07734, filed in 2013:
Average Adjusted Gross Income (AGI) in 2012: $45,794 (Individual Income Tax Returns) Here:
$45,794State:
$79,688
Salary/wage: $42,245 (reported on 87.7% of returns )Here:
$42,245State:
$68,122
(% of AGI for various income ranges: 72.9% for AGIs below $25k , 80.1% for AGIs $25k-50k , 80.9% for AGIs $50k-75k , 83.8% for AGIs $75k-100k , 84.6% for AGIs $100k-200k , 69.5% for AGIs over 200k ) Taxable interest for individuals: $561 (reported on 23.8% of returns )This zip code:
$561New Jersey:
$2,193
(% of AGI for various income ranges: 0.5% for AGIs below $25k , 0.2% for AGIs $25k-50k , 0.4% for AGIs $50k-75k , 0.2% for AGIs $75k-100k , 0.2% for AGIs $100k-200k , 0.1% for AGIs over 200k ) Ordinary dividends: $1,730 (reported on 13.0% of returns )(% of AGI for various income ranges: 0.4% for AGIs below $25k , 0.3% for AGIs $25k-50k , 0.4% for AGIs $50k-75k , 0.4% for AGIs $75k-100k , 0.8% for AGIs $100k-200k ) Net capital gain/loss in AGI: +$62 (reported on 8.0% of returns )(% of AGI for various income ranges: 0.1% for AGIs $100k-200k ) Profit/loss from business: +$9,958 (reported on 8.5% of returns )Here:
+$9,958State:
+$19,577
(% of AGI for various income ranges: 5.3% for AGIs below $25k , 3.0% for AGIs $25k-50k , 1.7% for AGIs $50k-75k , 0.9% for AGIs $75k-100k , 0.7% for AGIs $100k-200k ) Taxable individual retirement arrangement distribution: $10,877 (reported on 5.5% of returns )07734:
$10,877New Jersey:
$18,214
(% of AGI for various income ranges: 1.5% for AGIs below $25k , 1.3% for AGIs $25k-50k , 1.1% for AGIs $50k-75k , 1.4% for AGIs $75k-100k , 1.6% for AGIs $100k-200k ) Total itemized deductions: $21,343 (28% of AGI, reported on 36.7% of returns )Here:
$21,343State:
$30,827
Here:
27.5% of AGIState:
21.2% of AGI
(% of AGI for various income ranges: 9.2% for AGIs below $25k , 14.8% for AGIs $25k-50k , 19.7% for AGIs $50k-75k , 19.3% for AGIs $75k-100k , 18.2% for AGIs $100k-200k , 18.4% for AGIs over 200k ) Charity contributions: $1,839 (reported on 30.2% of returns )(% of AGI for various income ranges: 0.5% for AGIs below $25k , 1.0% for AGIs $25k-50k , 1.3% for AGIs $50k-75k , 1.5% for AGIs $75k-100k , 1.5% for AGIs $100k-200k , 1.0% for AGIs over 200k ) Taxes paid: $7,959 (reported on 36.5% of returns )07734:
$7,959State:
$15,801
(% of AGI for various income ranges: 3.3% for AGIs below $25k , 4.7% for AGIs $25k-50k , 6.5% for AGIs $50k-75k , 7.2% for AGIs $75k-100k , 7.9% for AGIs $100k-200k , 7.0% for AGIs over 200k ) Earned income credit: $2,076 (reported on 18.3% of returns )(% of AGI for various income ranges: 5.9% for AGIs below $25k , 1.0% for AGIs $25k-50k ) Percentage of individuals using paid preparers for their 2012 taxes: 59.8%(% for various income ranges: 53.7% for AGIs below $25k , 58.1% for AGIs $25k-50k , 65.5% for AGIs $50k-75k , 66.7% for AGIs $75k-100k , 72.7% for AGIs $100k-200k , 75.0% for AGIs over 200k )
Averages for the 2004 tax year for zip code 07734, filed in 2005:
Average Adjusted Gross Income (AGI) in 2004: $39,508 (Individual Income Tax Returns) Here:
$39,508State:
$64,921
Salary/wage: $37,711 (reported on 90.6% of returns )Here:
$37,711State:
$57,755
(% of AGI for various income ranges: 94.5% for AGIs below $10k , 80.0% for AGIs $10k-25k , 87.5% for AGIs $25k-50k , 89.2% for AGIs $50k-75k , 88.9% for AGIs $75k-100k , 81.9% for AGIs over 100k ) Taxable interest for individuals: $647 (reported on 33.4% of returns )This zip code:
$647New Jersey:
$2,068
(% of AGI for various income ranges: 2.1% for AGIs below $10k , 0.8% for AGIs $10k-25k , 0.6% for AGIs $25k-50k , 0.4% for AGIs $50k-75k , 0.3% for AGIs $75k-100k , 0.6% for AGIs over 100k ) Taxable dividends: $959 (reported on 15.4% of returns )(% of AGI for various income ranges: 1.1% for AGIs below $10k , 0.4% for AGIs $10k-25k , 0.3% for AGIs $25k-50k , 0.3% for AGIs $50k-75k , 0.4% for AGIs $75k-100k , 0.5% for AGIs over 100k ) Net capital gain/loss: +$2,362 (reported on 10.1% of returns )Here:
+$2,362State:
+$13,591
(% of AGI for various income ranges: -0.9% for AGIs below $10k , -0.1% for AGIs $10k-25k , 0.3% for AGIs $25k-50k , -0.1% for AGIs $50k-75k , 0.1% for AGIs $75k-100k , 2.8% for AGIs over 100k ) Profit/loss from business: +$6,930 (reported on 7.6% of returns )Here:
+$6,930State:
+$17,520
(% of AGI for various income ranges: 4.8% for AGIs below $10k , 4.3% for AGIs $10k-25k , 1.9% for AGIs $25k-50k , 0.6% for AGIs $50k-75k , 1.0% for AGIs $75k-100k , -0.1% for AGIs over 100k ) IRA payment deduction: $2,489 (reported on 1.5% of returns )07734:
$2,489New Jersey:
$3,270
(% of AGI for various income ranges: 0.1% for AGIs $10k-25k , 0.2% for AGIs $25k-50k , 0.1% for AGIs $50k-75k , 0.1% for AGIs $75k-100k , 0.1% for AGIs over 100k ) Total itemized deductions: $17,421 (27% of AGI, reported on 39.5% of returns )Here:
$17,421State:
$23,924
Here:
26.7% of AGIState:
21.1% of AGI
(% of AGI for various income ranges: 10.2% for AGIs below $10k , 11.2% for AGIs $10k-25k , 15.5% for AGIs $25k-50k , 19.8% for AGIs $50k-75k , 19.4% for AGIs $75k-100k , 18.7% for AGIs over 100k ) Charity contributions deductions: $1,904 (3% of AGI, reported on 36.2% of returns )Here:
2.8% of AGIState:
2.7% of AGI
(% of AGI for various income ranges: 0.4% for AGIs below $10k , 0.9% for AGIs $10k-25k , 1.5% for AGIs $25k-50k , 1.9% for AGIs $50k-75k , 2.2% for AGIs $75k-100k , 2.0% for AGIs over 100k ) Total tax: $4,700 (reported on 75.0% of returns )07734:
$4,700State:
$12,321
(% of AGI for various income ranges: 1.8% for AGIs below $10k , 4.1% for AGIs $10k-25k , 7.2% for AGIs $25k-50k , 8.1% for AGIs $50k-75k , 10.0% for AGIs $75k-100k , 14.4% for AGIs over 100k ) Earned income credit: $1,648 (reported on 16.3% of returns )Percentage of individuals using paid preparers for their 2004 taxes: 61.1%(% for various income ranges: 51.0% for AGIs below $10k , 63.5% for AGIs $10k-25k , 60.4% for AGIs $25k-50k , 65.4% for AGIs $50k-75k , 63.6% for AGIs $75k-100k , 74.0% for AGIs over 100k )
Estimated median household income in 2022: This zip code:
$83,829New Jersey:
$96,346
Nearest zip codes: 07758 ,
07735 ,
07730 ,
07748 ,
07718 ,
07737 .
Keansburg Zip Code Map
Percentage of family households: This zip code:
51.8%New Jersey:
47.0%
Percentage of households with unmarried partners: This zip code:
7.2%New Jersey:
49.9%
Likely homosexual households (counted as self-reported same-sex unmarried-partner households)
Lesbian couples: 0.2% of all households Gay men: 0.0% of all households
Household received Food Stamps/SNAP in the past 12 months: 936Household did not receive Food Stamps/SNAP in the past 12 months: 4,336
Women who had a birth in the past 12 months: 111 (61 now married , 48 unmarried) Women who did not have a birth in the past 12 months: 2,990 (1,244 now married , 1,745 unmarried)
Housing units in zip code 07734 with a mortgage: 2,166 (108
second mortgage , 72
both second mortgage and home equity loan )
Houses without a mortgage: 37
Median monthly owner costs for units with a mortgage: $2,052
Median monthly owner costs for units without a mortgage: $907
Residents with income below the poverty level in 2022:
This zip code:
12.3%Whole state:
9.7%
Residents with income below 50% of the poverty level in 2022:
This zip code:
3.0%Whole state:
5.2%
Median number of rooms in houses and condos: Median number of rooms in apartments:
Year house built (houses)
0 2020 or later404 2010 to 201951 2000 to 2009293 1990 to 1999649 1980 to 1989540 1970 to 1979988 1960 to 19691,387 1950 to 1959368 1940 to 1949993 1939 or earlier
Zip code 07734 household income distribution in 2022 399 Less than $10,000130 $10,000 to $14,999126 $15,000 to $19,999212 $20,000 to $24,999104 $25,000 to $29,999237 $30,000 to $34,999109 $35,000 to $39,999214 $40,000 to $44,999101 $45,000 to $49,999192 $50,000 to $59,999457 $60,000 to $74,9991,108 $75,000 to $99,999513 $100,000 to $124,999527 $125,000 to $149,999303 $150,000 to $199,999502 $200,000 or moreEstimate of home value of owner-occupied houses/condos in 2022 in zip code 07734 53 Less than $10,00038 $10,000 to $14,99929 $30,000 to $34,99937 $40,000 to $49,99923 $60,000 to $69,99932 $80,000 to $89,99947 $90,000 to $99,99952 $100,000 to $124,99997 $125,000 to $149,999141 $150,000 to $174,99962 $175,000 to $199,999369 $200,000 to $249,999549 $250,000 to $299,999931 $300,000 to $399,999395 $400,000 to $499,99978 $500,000 to $749,999Rent paid by renters in 2022 in zip code 07734 27 $150 to $19971 $200 to $24940 $250 to $29916 $350 to $39916 $450 to $49913 $700 to $74915 $750 to $79969 $800 to $89980 $900 to $999515 $1,000 to $1,249298 $1,250 to $1,499646 $1,500 to $1,999135 $2,000 to $2,49966 $2,500 to $2,999
Median gross rent in 2022: $1,536.
Median price asked for vacant for-sale houses and condos in 2022: $172,603.
Estimated median house (or condo) value in 2022 for: White Non-Hispanic householders: $300,399Black or African American householders: $323,252American Indian or Alaska Native householders: $378,596Asian householders: $384,379Some other race householders: $447,432Two or more races householders: $319,398Hispanic or Latino householders: $319,948Estimated median house or condo value in 2022: $302,602
07734:
$302,602New Jersey:
$428,900
Lower value quartile - upper value quartile: $230,026 - $383,925
Mean price in 2022: Detached houses: $272,557Here:
$272,557State:
$537,591
Townhouses or other attached units: $192,906Here:
$192,906State:
$381,113
In 2-unit structures: $387,099Here:
$387,099State:
$444,476
In 5-or-more-unit structures: $2,043,416Here:
$2,043,416State:
$368,745
Mobile homes: $20,146Here:
$20,146State:
$119,788
Housing units in structures:
One, detached: 3,682One, attached: 245Two: 3833 or 4: 4685 to 9: 21210 to 19: 12050 or more: 343Mobile homes: 306Unemployment : 3.5%
Means of transportation to work in zip code 07734 69.6% 4,709 Drove a car alone7.3% 496 Carpooled3.3% 224 Bus or trolley bus1.5% 102 Subway or elevated1.8% 120 Taxi2.3% 153 Bicycle1.4% 94 Walked4.1% 274 Other means6.3% 426 Worked at homeTravel time to work (commute) in zip code 07734 257 Less than 5 minutes369 5 to 9 minutes752 10 to 14 minutes1,150 15 to 19 minutes723 20 to 24 minutes414 25 to 29 minutes604 30 to 34 minutes199 35 to 39 minutes200 40 to 44 minutes506 45 to 59 minutes610 60 to 89 minutes372 90 or more minutes
Percentage of zip code residents living and working in this county: 72.4%
Household type by relationship:
Households: 13,558
Male householders: 2,303 (585 living alone ), Female householders: 2,923 (814 living alone )2,301 spouses (2,274 opposite-sex spouses ), 665 unmarried partners , (665 opposite-sex unmarried partners ), 4,161 children (4,066 natural , 56 adopted , 45 stepchildren ), 364 grandchildren , 85 brothers or sisters , 191 parents , 12 foster children , 232 other relatives , 224 non-relatives In group quarters: 143 (-1 institutionalized population )
Size of family households: 1,211 2-persons , 1,110 3-persons , 534 4-persons , 375 5-persons , 202 6-persons , 71 7-or-more-persons
Size of nonfamily households: 1,399 1-person , 306 2-persons , 9 7-or-more-persons
1,485 married couples with children. single-parent households (289 men , 655 women ).
85.6% of residents of 07734 zip code speak English at home. of residents speak Spanish at home (72% very well, 12% well, 16% not well ).of residents speak other Indo-European language at home (75% very well, 6% well, 19% not well ).of residents speak Asian or Pacific Island language at home (100% very well ).of residents speak other language at home (56% very well, 22% well, 23% not well ).
Foreign born population: 1,136 (8.4%)
(67.8%
of them are naturalized citizens )
This zip code:
8.4%Whole state:
23.5%
21% Saudi Arabia 18% Honduras 13% Dominica 11% St. Vincent and the Grenadines 9% Chile 6% Colombia 4% Nepal 16% Irish 10% Italian 6% English 5% Syrian 4% American 3% Trinidadian and Tobagonian 3% German
Year of entry for the foreign-born population
143 2010 or later 582 2000 to 2009 144 1990 to 1999 248 Before 1990
Facilities with environmental interests located in this zip code:
ALL BRITE WASH & CLEAN (240 MAIN STREET in KEANSBURG, NJ)
AIR MINOR (AIRS/AFS) STATE MASTER (New Jersey environmental info) - NJEMS-L2083, AIR PROGRAM Business SIC classification: DRYCLEANING PLANTS, EXCEPT RUG CLEANINGOrganizations: ALL BRITE WASH & CLEAN INCAlternative names: ALL BRITE WASH & CLEAN, INC.
BAYSHORE OIL CO (5 CIRCUIT STREET in KEANSBURG, NJ)
STATE MASTER (New Jersey environmental info) - NJEMS-G000029992, STATE CLEANUP SITE, NJEMS-NJD981494073, TRANSPORTER (Resource Conservation and Recovery Act (tracking hazardous waste)) Organizations: OIL TRANSFER COAlternative names: OIL TRANSFER CO
EZACT LINE COLLISION (2 HUDSON AVE in WEST KEANSBURG, NJ)
STATE MASTER (New Jersey environmental info) - NJEMS-78303500000, EPCRA, NJEMS-G2053, AIR PROGRAM, NJEMS-NJD986617546, HAZARDOUS WASTE PROGRAM Small Quantity Generators, between 100 kg and 1000 kg of hazardous waste/month (Resource Conservation and Recovery Act (tracking hazardous waste)) Business SIC classification: MOTOR VEHICLE DEALERS (NEW AND USED); TOP, BODY, AND UPHOLSTERY REPAIR SHOPS AND PAINT SHOPSOrganizations: EZACT LINE COLLISION INC
PORT MONMOUTH RD SCHOOL (142 PORT MONMOUTH ROAD in KEANSBURG, NJ)
(National Center for Education Statistics) - STATE ID-040 Organizations: KEANSBURG BORO (SCHOOL DISTRICT)
ALIBERTI & WOBITO CONSTRUCTION COMPANY (347 MAIN STREET in KEANSBURG, NJ)
(Resource Conservation and Recovery Act (tracking hazardous waste))
AMOCO SERVICE STATION (39 RTE 36 E in KEANSBURG, NJ)
(Resource Conservation and Recovery Act (tracking hazardous waste))
H & H SERVICE CENTER (CARR AVE & CHURCH ST in KEANSBURG, NJ)
(Resource Conservation and Recovery Act (tracking hazardous waste))
Housing units lacking complete plumbing facilities: 4.9%
Housing units lacking complete kitchen facilities: 3.1%
84.1% Utility gas 9.9% Electricity 3.5% Bottled, tank, or LP gas 1.5% Fuel oil, kerosene, etc. 0.9% No fuel used
Population in 1990: 21,931.
Place of birth for U.S.-born residents:
This state: 9,075Northeast: 2,697Midwest: 107South: 297West: 201
62% of the 07734 zip code residents lived in the same house 5 years ago.
Out of people who lived in different houses, 67% lived in this county.
Out of people who lived in different counties, 50% lived in New Jersey.
91% of the 07734 zip code residents lived in the same house 1 year ago.
Out of people who lived in different houses, 75% moved from this county.
Out of people who lived in different houses, 7% moved from different county within same state.
Out of people who lived in different houses, 13% moved from different state.
Private vs. public school enrollment:
Students in private schools in grades 1 to 8 (elementary and middle school): 77
Here:
5.2%New Jersey:
12.3%
Students in private schools in grades 9 to 12 (high school): 77
Here:
11.4%New Jersey:
13.1%
Students in private undergraduate colleges: 244
Here:
36.8%New Jersey:
33.2%
Occupation by median earnings in the past 12 months ($)
201,633 Legal occupations 98,037 Installation, maintenance, and repair occupations 89,576 Computer and mathematical occupations 87,211 Management occupations 75,465 Life, physical, and social science occupations 70,991 Construction and extraction occupations
Companies with federal contracts located in this zip code:
RPCONSTRUCTION&PAINTING (7 SAINT MARKS PL in KEANSBURG, NJ; small business) in 6 contracts from 2004 to 2006
Contracts for Maintenance, Repair or Alteration of Real Property -- Office Buildings by ArmySigned by year: 2000: $0; 2001: $0; 2002: $0; 2003: $0; 2004: $135,400; 2005: $0; 2006: $65,225.
Biggest contracts: with Army for Maintenance, Repair or Alteration of Real Property -- Office Buildings. Signed on 2004-09-12. Completion date: 2004-12-20.
, same as above. Signed on 2004-09-15. Completion date: 2004-12-22.
, same as above. Signed on 2006-04-25. Completion date: 2006-06-26.
, same as above. Signed on 2006-06-30. Completion date: 2006-09-05.
JOHN J FACCAS INC (290 LAUREL AVENUE in W KEANSBURG, NJ; small business) in 2 contracts from 2000 to 2001
$25,000 with Navy for Maintenance, Repair or Alteration of Real Property -- Airport Runways. Signed on 2000-12-13. Completion date: 2001-02-15.
, same as above. Signed on 2001-09-22. Completion date: 2001-02-15.
Top industries in this zip code by the number of employees in 2005:
Health Care and Social Assistance: Nursing Care Facilities (100-249 employees: 1 establishment)Health Care and Social Assistance: Homes for the Elderly (100-249: 1)Accommodation and Food Services: Drinking Places (Alcoholic Beverages) (10-19: 1, 5-9: 3, 1-4: 2)Accommodation and Food Services: Food Service Contractors (10-19: 1, 5-9: 2, 1-4: 2)Other Services (except Public Administration): Industrial Launderers (20-49: 1)Educational Services: Elementary and Secondary Schools (20-49: 1)Accommodation and Food Services: Limited-Service Restaurants (10-19: 1, 5-9: 1, 1-4: 4)Construction: Electrical Contractors (5-9: 2, 1-4: 6)
People in group quarters in 2010:
265 people in nursing facilities/skilled-nursing facilities
23 people in other noninstitutional facilities
People in group quarters in 2000:
118 people in nursing homes
76 people in other noninstitutional group quarters
15 people in homes for the mentally ill
11 people in religious group quarters
Fatal accident statistics in 2014:
Fatal accident count: 1Vehicles involved in fatal accidents: 2Fatal accidents caused by drunken drivers: 0Fatalities: 1Persons involved in fatal accidents: 1Pedestrians involved in fatal accidents: 1
Fatal accident statistics in 2012:
Fatal accident count: 1Vehicles involved in fatal accidents: 2Fatal accidents caused by drunken drivers: 1Fatalities: 1Persons involved in fatal accidents: 2Pedestrians involved in fatal accidents: 0
Home Mortgage Disclosure Act Aggregated Statistics For Year 2009(Based on 5 full and 2 partial tracts) A) FHA, FSA/RHS & VA B) Conventional C) Refinancings D) Home Improvement Loans E) Loans on Dwellings For 5+ Families F) Non-occupant Loans on G) Loans On Manufactured Number Average Value Number Average Value Number Average Value Number Average Value Number Average Value Number Average Value Number Average Value
LOANS ORIGINATED 137 $192,199 66 $156,320 518 $198,019 35 $69,220 10 $800,768 27 $147,961 2 $30,830 APPLICATIONS APPROVED, NOT ACCEPTED 19 $202,887 13 $142,055 54 $194,221 6 $11,167 2 $147,980 3 $197,123 0 $0 APPLICATIONS DENIED 35 $145,709 29 $138,866 319 $191,188 69 $62,492 0 $0 33 $153,681 1 $42,600 APPLICATIONS WITHDRAWN 39 $162,209 7 $182,029 169 $209,968 11 $174,038 2 $1,696,770 7 $219,151 0 $0 FILES CLOSED FOR INCOMPLETENESS 12 $198,694 1 $160,000 48 $225,297 0 $0 0 $0 2 $126,760 0 $0
Aggregated Statistics For Year 2008(Based on 5 full and 2 partial tracts) A) FHA, FSA/RHS & VA B) Conventional C) Refinancings D) Home Improvement Loans E) Loans on Dwellings For 5+ Families F) Non-occupant Loans on G) Loans On Manufactured Number Average Value Number Average Value Number Average Value Number Average Value Number Average Value Number Average Value Number Average Value
LOANS ORIGINATED 108 $226,471 150 $189,977 461 $191,539 80 $81,956 1 $135,000 59 $159,043 3 $47,150 APPLICATIONS APPROVED, NOT ACCEPTED 7 $241,136 33 $187,033 140 $190,976 23 $65,822 0 $0 19 $154,266 0 $0 APPLICATIONS DENIED 21 $219,610 67 $159,293 446 $194,964 154 $48,986 0 $0 70 $136,075 4 $28,852 APPLICATIONS WITHDRAWN 19 $192,576 33 $199,417 150 $223,382 28 $115,700 0 $0 20 $183,246 0 $0 FILES CLOSED FOR INCOMPLETENESS 3 $231,703 5 $147,884 38 $234,050 0 $0 0 $0 2 $70,865 0 $0
Aggregated Statistics For Year 2007(Based on 5 full and 2 partial tracts) A) FHA, FSA/RHS & VA B) Conventional C) Refinancings D) Home Improvement Loans E) Loans on Dwellings For 5+ Families F) Non-occupant Loans on G) Loans On Manufactured Number Average Value Number Average Value Number Average Value Number Average Value Number Average Value Number Average Value Number Average Value
LOANS ORIGINATED 51 $234,701 377 $195,504 837 $185,966 174 $72,197 4 $1,359,420 186 $174,847 2 $83,515 APPLICATIONS APPROVED, NOT ACCEPTED 2 $258,720 61 $168,505 183 $192,489 39 $52,387 0 $0 30 $184,904 3 $48,203 APPLICATIONS DENIED 9 $228,276 127 $197,949 692 $191,542 258 $70,782 0 $0 88 $167,429 5 $17,296 APPLICATIONS WITHDRAWN 16 $191,269 59 $194,341 334 $209,012 36 $107,621 0 $0 21 $215,884 0 $0 FILES CLOSED FOR INCOMPLETENESS 0 $0 21 $159,144 106 $223,097 8 $119,614 0 $0 1 $224,200 0 $0
Aggregated Statistics For Year 2006(Based on 5 full and 2 partial tracts) A) FHA, FSA/RHS & VA B) Conventional C) Refinancings D) Home Improvement Loans E) Loans on Dwellings For 5+ Families F) Non-occupant Loans on G) Loans On Manufactured Number Average Value Number Average Value Number Average Value Number Average Value Number Average Value Number Average Value Number Average Value
LOANS ORIGINATED 42 $239,789 584 $170,785 1,217 $180,929 254 $77,504 12 $307,252 253 $178,434 1 $33,630 APPLICATIONS APPROVED, NOT ACCEPTED 2 $163,690 116 $154,901 228 $161,356 64 $79,176 0 $0 46 $173,355 3 $44,817 APPLICATIONS DENIED 7 $233,190 214 $170,883 684 $197,138 308 $80,879 0 $0 77 $173,478 13 $60,814 APPLICATIONS WITHDRAWN 11 $249,825 102 $191,707 515 $196,194 93 $135,490 2 $419,200 53 $170,284 0 $0 FILES CLOSED FOR INCOMPLETENESS 0 $0 30 $197,323 210 $218,892 9 $173,878 0 $0 9 $206,198 2 $189,140
Aggregated Statistics For Year 2005(Based on 5 full and 2 partial tracts) A) FHA, FSA/RHS & VA B) Conventional C) Refinancings D) Home Improvement Loans E) Loans on Dwellings For 5+ Families F) Non-occupant Loans on G) Loans On Manufactured Number Average Value Number Average Value Number Average Value Number Average Value Number Average Value Number Average Value Number Average Value
LOANS ORIGINATED 52 $219,278 738 $171,114 1,434 $170,095 206 $83,722 2 $334,365 327 $167,350 5 $61,422 APPLICATIONS APPROVED, NOT ACCEPTED 7 $172,561 123 $156,089 234 $176,337 53 $71,805 0 $0 45 $182,770 2 $21,010 APPLICATIONS DENIED 6 $195,308 202 $169,259 727 $175,017 253 $67,546 0 $0 117 $152,272 16 $62,372 APPLICATIONS WITHDRAWN 20 $189,092 153 $162,675 721 $169,840 97 $153,553 2 $164,685 80 $190,714 1 $59,410 FILES CLOSED FOR INCOMPLETENESS 4 $190,178 30 $157,755 203 $186,961 5 $107,024 0 $0 15 $165,500 2 $246,960
Aggregated Statistics For Year 2004(Based on 5 full and 2 partial tracts) A) FHA, FSA/RHS & VA B) Conventional C) Refinancings D) Home Improvement Loans E) Loans on Dwellings For 5+ Families F) Non-occupant Loans on G) Loans On Manufactured Number Average Value Number Average Value Number Average Value Number Average Value Number Average Value Number Average Value Number Average Value
LOANS ORIGINATED 77 $182,686 768 $163,624 1,265 $142,846 181 $79,929 8 $215,261 366 $148,640 4 $57,170 APPLICATIONS APPROVED, NOT ACCEPTED 9 $194,387 148 $186,894 246 $145,233 63 $44,548 2 $209,600 74 $167,155 1 $72,860 APPLICATIONS DENIED 12 $168,981 192 $166,453 630 $143,713 179 $53,770 5 $52,168 77 $161,965 11 $57,036 APPLICATIONS WITHDRAWN 34 $188,369 134 $158,346 488 $151,269 70 $74,385 4 $257,717 69 $141,476 3 $136,480 FILES CLOSED FOR INCOMPLETENESS 2 $161,690 40 $166,967 93 $151,043 6 $53,303 0 $0 21 $149,083 0 $0
Aggregated Statistics For Year 2003(Based on 5 full and 2 partial tracts) A) FHA, FSA/RHS & VA B) Conventional C) Refinancings D) Home Improvement Loans E) Loans on Dwellings For 5+ Families F) Non-occupant Loans on Number Average Value Number Average Value Number Average Value Number Average Value Number Average Value Number Average Value
LOANS ORIGINATED 154 $157,583 633 $143,842 1,893 $124,143 124 $54,934 4 $321,970 348 $123,626 APPLICATIONS APPROVED, NOT ACCEPTED 21 $162,383 112 $136,684 358 $118,283 52 $28,478 0 $0 37 $127,963 APPLICATIONS DENIED 21 $143,841 144 $118,338 718 $126,421 177 $30,513 0 $0 71 $121,937 APPLICATIONS WITHDRAWN 25 $155,324 105 $142,860 658 $132,684 28 $45,196 0 $0 46 $109,824 FILES CLOSED FOR INCOMPLETENESS 3 $191,120 30 $142,592 90 $131,652 11 $43,679 0 $0 12 $116,661
Aggregated Statistics For Year 2002(Based on 5 full and 2 partial tracts) A) FHA, FSA/RHS & VA B) Conventional C) Refinancings D) Home Improvement Loans E) Loans on Dwellings For 5+ Families F) Non-occupant Loans on Number Average Value Number Average Value Number Average Value Number Average Value Number Average Value Number Average Value
LOANS ORIGINATED 165 $1,069,426 479 $219,888 1,151 $140,478 143 $37,325 5 $1,210,054 199 $98,905 APPLICATIONS APPROVED, NOT ACCEPTED 16 $135,101 72 $102,375 289 $104,265 64 $34,500 0 $0 37 $108,378 APPLICATIONS DENIED 12 $123,386 84 $88,796 596 $99,627 173 $27,395 0 $0 47 $83,357 APPLICATIONS WITHDRAWN 19 $761,495 78 $115,118 462 $158,192 37 $28,665 0 $0 19 $122,064 FILES CLOSED FOR INCOMPLETENESS 6 $111,915 25 $111,997 107 $106,266 3 $46,350 0 $0 17 $101,634
Aggregated Statistics For Year 2001(Based on 5 full and 2 partial tracts) A) FHA, FSA/RHS & VA B) Conventional C) Refinancings D) Home Improvement Loans E) Loans on Dwellings For 5+ Families F) Non-occupant Loans on Number Average Value Number Average Value Number Average Value Number Average Value Number Average Value Number Average Value
LOANS ORIGINATED 213 $111,132 381 $97,272 770 $100,452 87 $29,999 2 $331,370 126 $76,121 APPLICATIONS APPROVED, NOT ACCEPTED 11 $110,518 64 $90,502 169 $87,606 55 $27,155 0 $0 40 $69,262 APPLICATIONS DENIED 28 $111,253 96 $78,432 485 $77,919 177 $22,644 2 $132,300 33 $77,361 APPLICATIONS WITHDRAWN 12 $106,138 43 $95,270 277 $96,252 42 $28,689 0 $0 19 $86,499 FILES CLOSED FOR INCOMPLETENESS 7 $103,911 7 $84,420 137 $91,971 9 $46,313 0 $0 6 $73,582
Aggregated Statistics For Year 2000(Based on 5 full and 2 partial tracts) A) FHA, FSA/RHS & VA B) Conventional C) Refinancings D) Home Improvement Loans E) Loans on Dwellings For 5+ Families F) Non-occupant Loans on Number Average Value Number Average Value Number Average Value Number Average Value Number Average Value Number Average Value
LOANS ORIGINATED 205 $97,545 282 $90,867 281 $77,329 91 $27,767 2 $81,845 73 $71,045 APPLICATIONS APPROVED, NOT ACCEPTED 15 $78,425 58 $73,398 112 $76,004 67 $27,781 0 $0 20 $69,594 APPLICATIONS DENIED 30 $96,074 117 $76,146 353 $60,010 161 $22,171 4 $105,798 23 $56,824 APPLICATIONS WITHDRAWN 22 $77,955 37 $83,647 212 $62,712 18 $54,765 2 $96,040 17 $72,357 FILES CLOSED FOR INCOMPLETENESS 3 $112,870 17 $58,388 111 $97,975 4 $17,698 0 $0 12 $71,369
Aggregated Statistics For Year 1999(Based on 1 full and 2 partial tracts) A) FHA, FSA/RHS & VA B) Conventional C) Refinancings D) Home Improvement Loans E) Loans on Dwellings For 5+ Families F) Non-occupant Loans on Number Average Value Number Average Value Number Average Value Number Average Value Number Average Value Number Average Value
LOANS ORIGINATED 75 $91,264 98 $71,590 168 $74,468 27 $26,944 4 $327,202 37 $69,659 APPLICATIONS APPROVED, NOT ACCEPTED 2 $104,680 20 $73,812 66 $72,789 20 $25,604 0 $0 10 $67,243 APPLICATIONS DENIED 12 $82,820 27 $71,604 148 $63,115 51 $23,391 0 $0 16 $69,434 APPLICATIONS WITHDRAWN 9 $86,282 22 $69,978 115 $73,067 7 $56,427 1 $38,110 10 $60,594 FILES CLOSED FOR INCOMPLETENESS 2 $82,820 5 $100,228 25 $93,431 0 $0 0 $0 1 $75,440
Detailed HMDA statistics for the following Tracts:
8006.01
,
8016.00 ,
8017.00 ,
8022.00
Private Mortgage Insurance Companies Aggregated Statistics For Year 2009(Based on 5 full and 2 partial tracts) A) Conventional B) Refinancings Number Average Value Number Average Value
LOANS ORIGINATED 14 $222,226 8 $246,830 APPLICATIONS APPROVED, NOT ACCEPTED 11 $237,687 9 $188,343 APPLICATIONS DENIED 0 $0 4 $314,152 APPLICATIONS WITHDRAWN 2 $259,500 0 $0 FILES CLOSED FOR INCOMPLETENESS 0 $0 0 $0
Aggregated Statistics For Year 2008(Based on 5 full and 2 partial tracts) A) Conventional B) Refinancings C) Non-occupant Loans on Number Average Value Number Average Value Number Average Value
LOANS ORIGINATED 75 $215,172 36 $236,118 11 $190,965 APPLICATIONS APPROVED, NOT ACCEPTED 29 $220,153 42 $255,476 10 $157,602 APPLICATIONS DENIED 10 $224,608 15 $226,767 12 $178,153 APPLICATIONS WITHDRAWN 7 $206,866 16 $203,881 6 $196,327 FILES CLOSED FOR INCOMPLETENESS 5 $263,416 0 $0 4 $251,520
Aggregated Statistics For Year 2007(Based on 5 full and 2 partial tracts) A) Conventional B) Refinancings C) Non-occupant Loans on Number Average Value Number Average Value Number Average Value
LOANS ORIGINATED 129 $228,812 70 $260,638 30 $218,447 APPLICATIONS APPROVED, NOT ACCEPTED 33 $214,097 16 $300,130 0 $0 APPLICATIONS DENIED 2 $201,880 5 $258,104 2 $201,880 APPLICATIONS WITHDRAWN 8 $202,186 7 $292,441 6 $243,693 FILES CLOSED FOR INCOMPLETENESS 0 $0 0 $0 0 $0
Aggregated Statistics For Year 2006(Based on 5 full and 2 partial tracts) A) Conventional B) Refinancings C) Non-occupant Loans on Number Average Value Number Average Value Number Average Value
LOANS ORIGINATED 102 $212,703 61 $252,513 21 $225,906 APPLICATIONS APPROVED, NOT ACCEPTED 32 $210,117 19 $261,512 6 $153,027 APPLICATIONS DENIED 0 $0 6 $187,180 0 $0 APPLICATIONS WITHDRAWN 1 $320,000 5 $279,794 0 $0 FILES CLOSED FOR INCOMPLETENESS 2 $247,530 0 $0 2 $247,530
Aggregated Statistics For Year 2005(Based on 5 full and 2 partial tracts) A) Conventional B) Refinancings C) Non-occupant Loans on Number Average Value Number Average Value Number Average Value
LOANS ORIGINATED 129 $212,200 61 $221,237 29 $168,907 APPLICATIONS APPROVED, NOT ACCEPTED 45 $199,712 22 $190,877 13 $216,642 APPLICATIONS DENIED 0 $0 0 $0 0 $0 APPLICATIONS WITHDRAWN 3 $268,533 1 $320,000 0 $0 FILES CLOSED FOR INCOMPLETENESS 1 $284,000 2 $160,720 0 $0
Aggregated Statistics For Year 2004(Based on 5 full and 2 partial tracts) A) Conventional B) Refinancings C) Non-occupant Loans on Number Average Value Number Average Value Number Average Value
LOANS ORIGINATED 195 $183,197 72 $180,977 52 $157,795 APPLICATIONS APPROVED, NOT ACCEPTED 45 $184,962 31 $171,607 20 $180,598 APPLICATIONS DENIED 9 $191,539 4 $198,725 4 $190,785 APPLICATIONS WITHDRAWN 9 $147,627 0 $0 0 $0 FILES CLOSED FOR INCOMPLETENESS 4 $99,310 3 $201,000 3 $101,243
Aggregated Statistics For Year 2003(Based on 5 full and 2 partial tracts) A) Conventional B) Refinancings C) Non-occupant Loans on Number Average Value Number Average Value Number Average Value
LOANS ORIGINATED 261 $152,826 77 $151,975 67 $122,014 APPLICATIONS APPROVED, NOT ACCEPTED 71 $124,611 40 $163,204 32 $106,406 APPLICATIONS DENIED 7 $135,599 0 $0 2 $85,835 APPLICATIONS WITHDRAWN 20 $146,550 11 $147,016 8 $161,650 FILES CLOSED FOR INCOMPLETENESS 0 $0 2 $124,460 0 $0
Aggregated Statistics For Year 2002(Based on 5 full and 2 partial tracts) A) Conventional B) Refinancings C) Non-occupant Loans on Number Average Value Number Average Value Number Average Value
LOANS ORIGINATED 218 $138,283 82 $129,757 66 $120,014 APPLICATIONS APPROVED, NOT ACCEPTED 40 $133,788 30 $119,343 13 $102,668 APPLICATIONS DENIED 11 $106,237 5 $135,480 11 $124,022 APPLICATIONS WITHDRAWN 17 $106,176 2 $123,480 7 $107,214 FILES CLOSED FOR INCOMPLETENESS 1 $163,670 1 $180,000 0 $0
Aggregated Statistics For Year 2001(Based on 5 full and 2 partial tracts) A) Conventional B) Refinancings C) Non-occupant Loans on Number Average Value Number Average Value Number Average Value
LOANS ORIGINATED 175 $107,873 68 $124,681 36 $86,556 APPLICATIONS APPROVED, NOT ACCEPTED 26 $98,133 11 $148,748 10 $84,027 APPLICATIONS DENIED 10 $73,460 3 $110,307 6 $71,198 APPLICATIONS WITHDRAWN 3 $118,000 1 $160,300 0 $0 FILES CLOSED FOR INCOMPLETENESS 0 $0 0 $0 0 $0
Aggregated Statistics For Year 2000(Based on 5 full and 2 partial tracts) A) Conventional B) Refinancings C) Non-occupant Loans on Number Average Value Number Average Value Number Average Value
LOANS ORIGINATED 132 $94,602 25 $108,669 19 $64,210 APPLICATIONS APPROVED, NOT ACCEPTED 17 $108,871 11 $110,161 2 $96,040 APPLICATIONS DENIED 4 $78,342 1 $96,000 1 $50,000 APPLICATIONS WITHDRAWN 1 $63,000 0 $0 1 $63,000 FILES CLOSED FOR INCOMPLETENESS 3 $121,560 2 $141,730 2 $107,795
Aggregated Statistics For Year 1999(Based on 1 full and 2 partial tracts) A) Conventional B) Refinancings C) Non-occupant Loans on Number Average Value Number Average Value Number Average Value
LOANS ORIGINATED 38 $91,565 23 $107,677 9 $69,579 APPLICATIONS APPROVED, NOT ACCEPTED 5 $74,826 6 $107,232 0 $0 APPLICATIONS DENIED 2 $59,955 1 $108,820 0 $0 APPLICATIONS WITHDRAWN 2 $66,135 2 $86,220 0 $0 FILES CLOSED FOR INCOMPLETENESS 1 $56,820 1 $61,630 1 $56,820
Detailed PMIC statistics for the following Tracts:
8006.01
,
8016.00 ,
8017.00 ,
8022.00
2005 - 2018 National Fire Incident Reporting System (NFIRS) incidents See full 2006 National Fire Incident Reporting System statistics for zip code 07734, New Jersey
Most common first names in zip code 07734 among deceased individuals Name Count Lived (average)
John 319 69.3 years Mary 228 78.2 years Joseph 203 72.6 years William 184 73.1 years Margaret 151 76.6 years James 145 70.5 years Charles 128 72.1 years Catherine 121 77.5 years Helen 119 76.1 years George 119 71.3 years
Most common last names in zip code 07734 among deceased individuals Last name Count Lived (average)
Smith 66 71.8 years Johnson 29 70.8 years Miller 22 74.2 years Kelly 22 71.1 years Sullivan 21 73.0 years Moore 21 75.3 years King 20 72.9 years Brown 20 66.5 years Martin 17 71.6 years Burke 17 69.0 years
Businesses in zip code 07734
CVS: 1Dunkin Donuts: 2UPS: 1
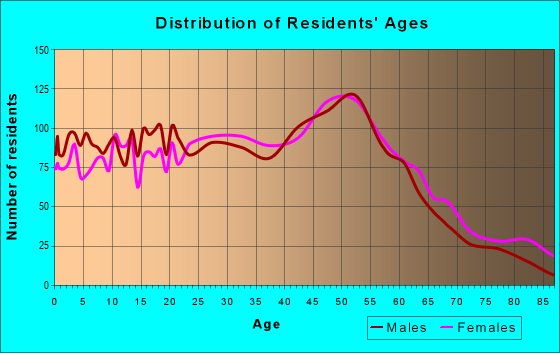


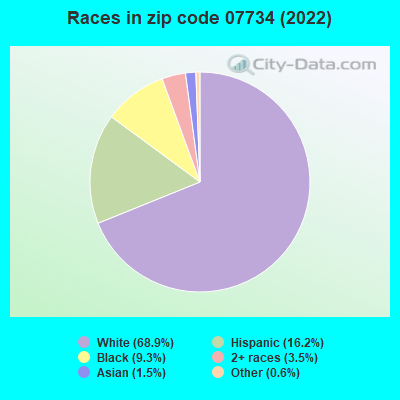


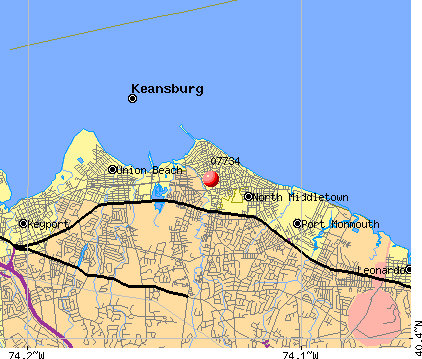 Nearest zip codes: 07758, 07735, 07730, 07748, 07718, 07737.
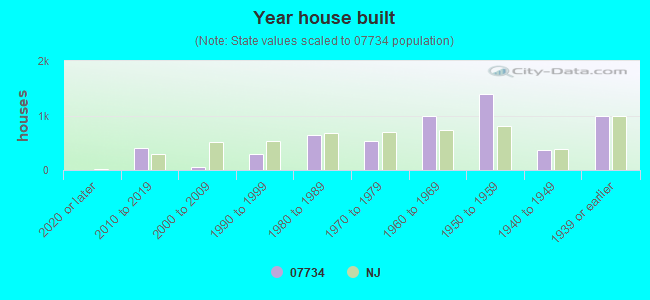
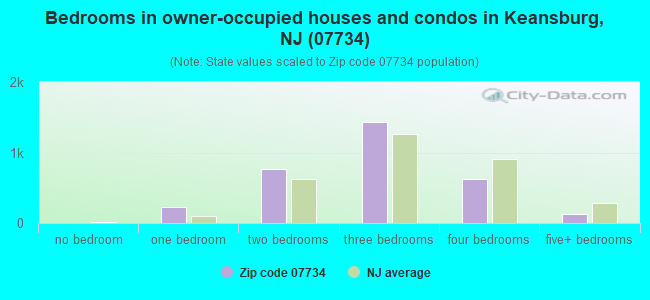
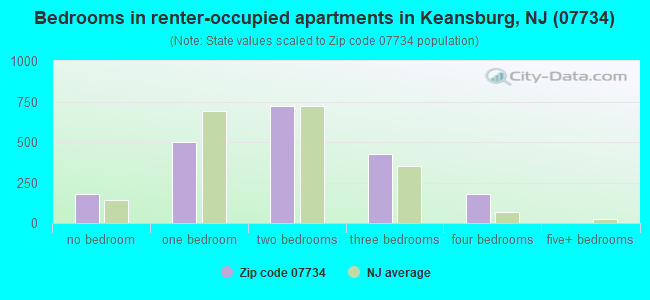
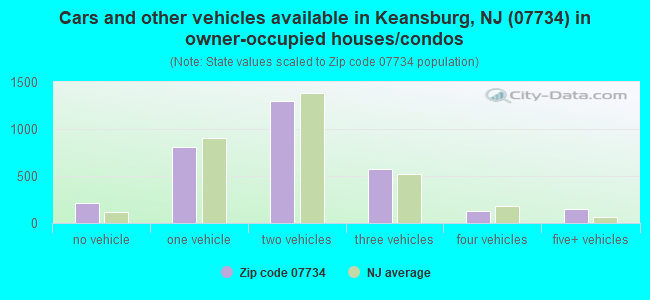
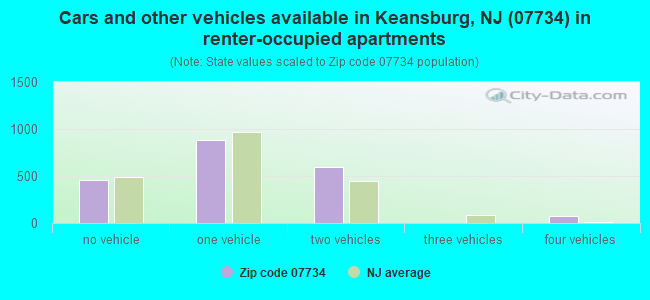


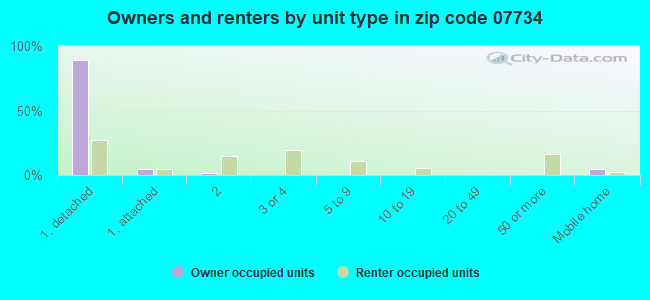
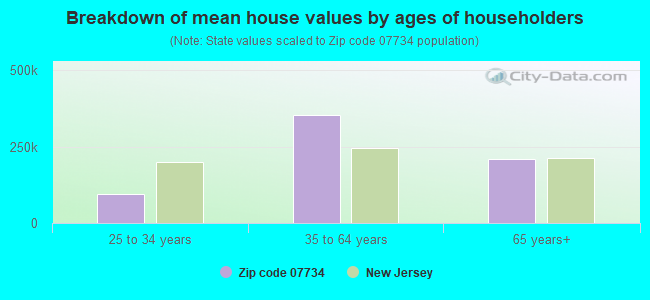


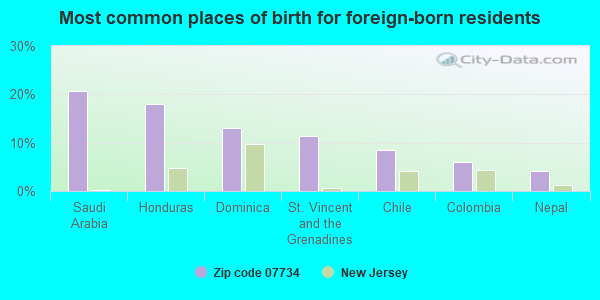
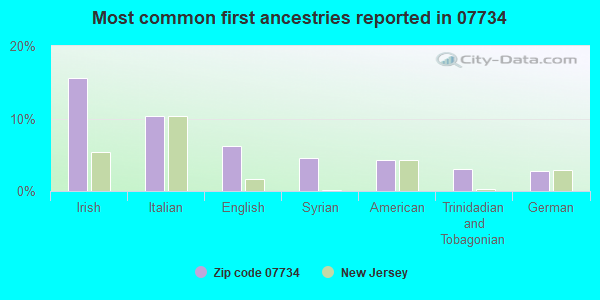
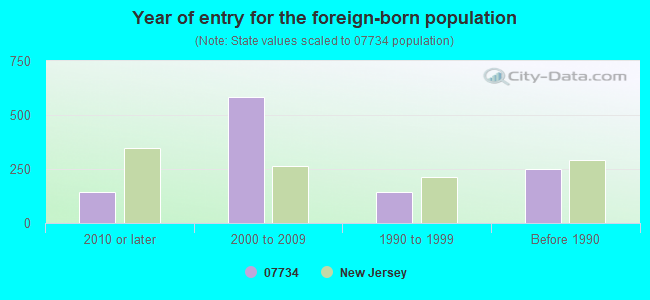


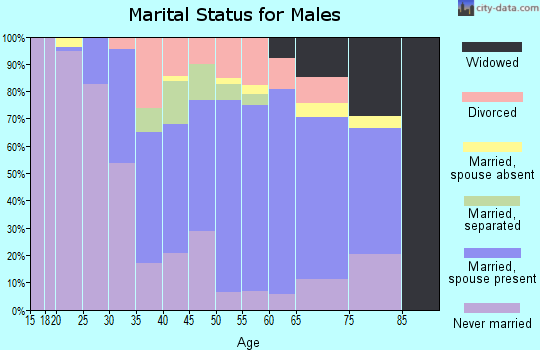

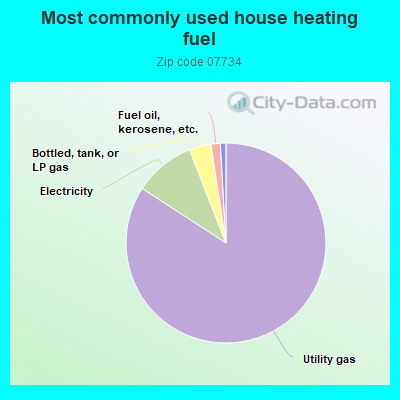
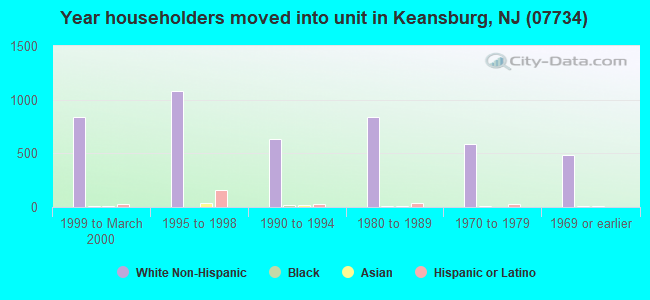

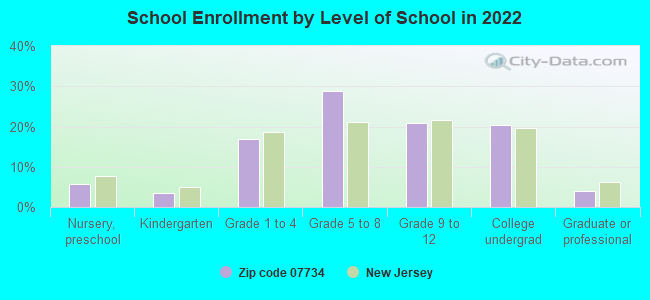
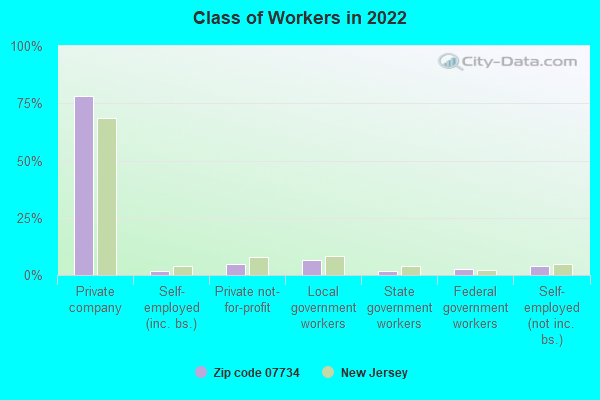
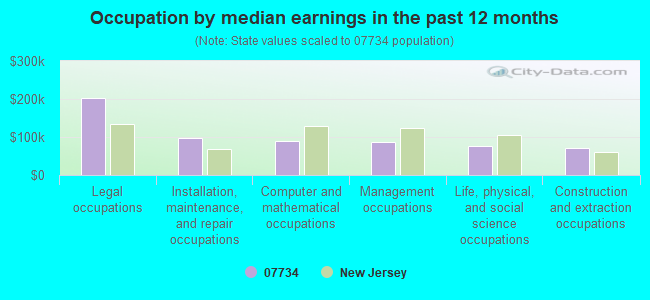
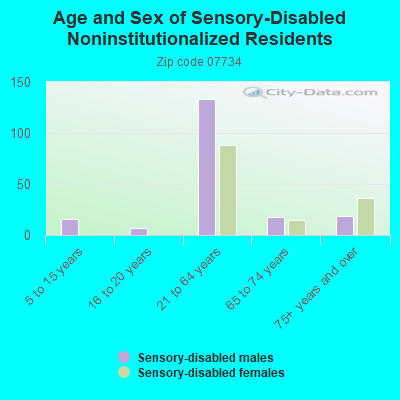
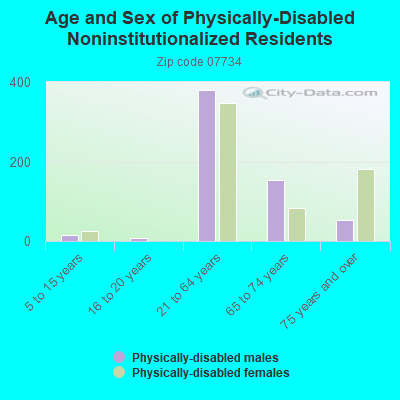
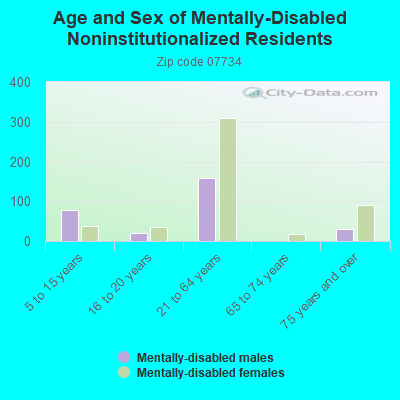

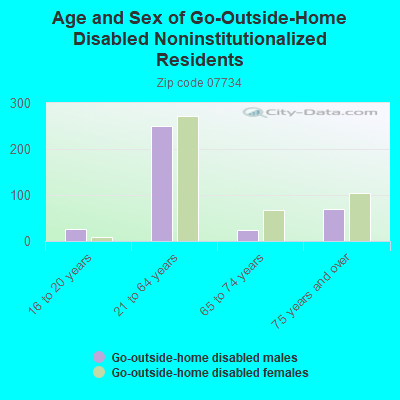
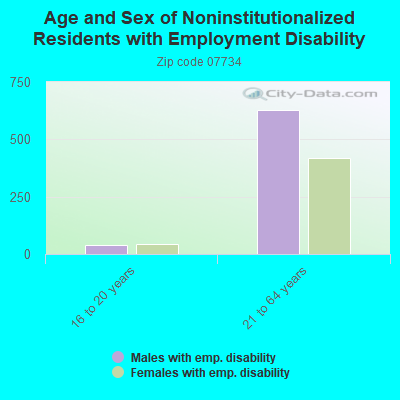

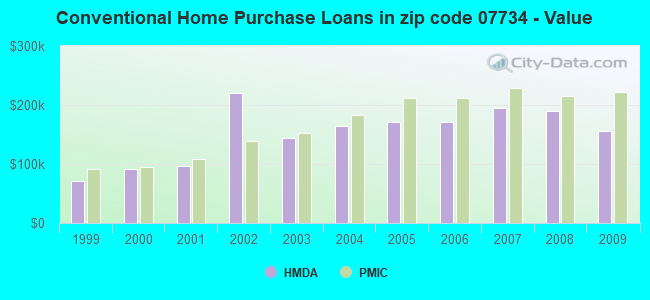
 Based on the data from the years 2005 - 2018 the average number of fires per year is 47. The highest number of fires - 79 took place in 2005, and the least - 20 in 2009. The data has a decreasing trend.
 When looking into fire subcategories, the most reports belonged to: Structure Fires (51.1%), and Outside Fires (36.1%).