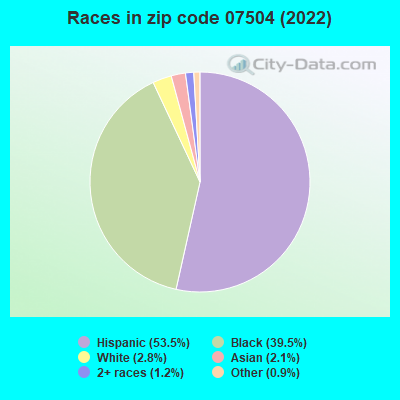
Estimated zip code population in 2022: 13,799 Zip code population in 2010: 12,882 Zip code population in 2000: 13,072
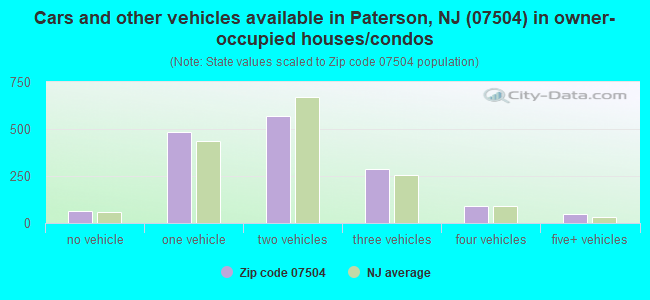
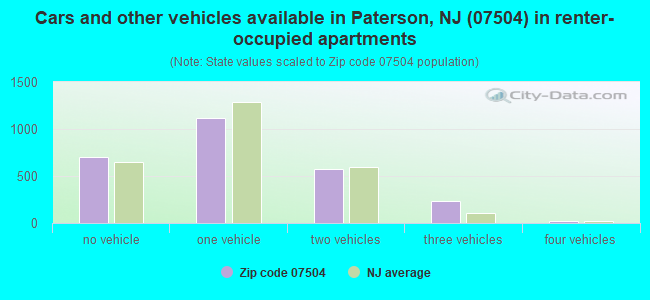
Houses and condos: 4,382 Renter-occupied apartments: 2,674
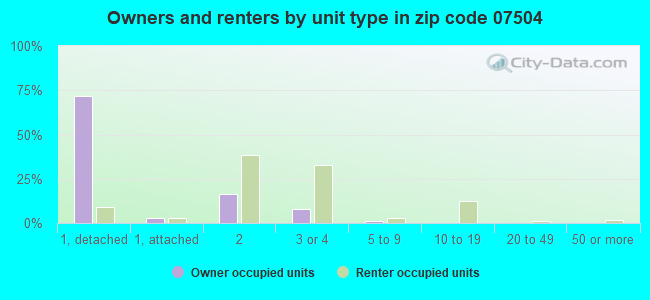
% of renters here:
63%
State:
35%
March 2022 cost of living index in zip code 07504: 118.8 (more than average, U.S. average is 100)
Land area: 0.8 sq. mi. Water area: 0.0 sq. mi.
Population density: 16,673 people per square mile
(very high).
OSM Map
Google Map
MSN Map
OSM Map
General Map
Google Map
MSN Map
OSM Map
Google Map
MSN Map
OSM Map
Google Map
MSN Map
Please wait while loading the map...
Real estate property taxes paid for housing units in 2022:
This zip code:
2.3% ($8,896)
New Jersey:
2.1% ($8,897)
Median real estate property taxes paid for housing units with mortgages in 2022: $9,149 (2.3%) Median real estate property taxes paid for housing units with no mortgage in 2022: $7,775 (2.2%)
Averages for the 2020 tax year for zip code 07504, filed in 2021:
Average Adjusted Gross Income (AGI) in 2020: $36,916 (Individual Income Tax Returns)
Here:
$36,916
State:
$95,247
Salary/wage: $34,370 (reported on 84.0% of returns)
Here:
$34,370
State:
$80,635
(% of AGI for various income ranges: 1079.5% for AGIs below $25k, 3494.8% for AGIs $25k-50k, 7076.2% for AGIs $50k-75k, 9827.4% for AGIs $75k-100k, 15477.5% for AGIs $100k-200k)
Taxable interest for individuals: $389 (reported on 8.4% of returns)
This zip code:
$389
New Jersey:
$2,414
(% of AGI for various income ranges: 1.4% for AGIs below $25k, 2.6% for AGIs $25k-50k, 5.9% for AGIs $50k-75k, 11.9% for AGIs $75k-100k, 31.5% for AGIs $100k-200k)
Ordinary dividends: $1,936 (reported on 3.2% of returns)
Here:
$1,936
State:
$8,057
(% of AGI for various income ranges: 1.3% for AGIs below $25k, 1.0% for AGIs $25k-50k, 10.0% for AGIs $50k-75k, 5.2% for AGIs $75k-100k, 170.5% for AGIs $100k-200k)
Net capital gain/loss in AGI: +$3,873 (reported on 3.3% of returns)
Here:
+$3,873
State:
+$25,022
(% of AGI for various income ranges: 7.4% for AGIs $25k-50k, 26.2% for AGIs $50k-75k, 20.7% for AGIs $75k-100k, 304.0% for AGIs $100k-200k)
Profit/loss from business: +$6,576 (reported on 18.3% of returns)
Here:
+$6,576
State:
+$18,035
(% of AGI for various income ranges: 149.2% for AGIs below $25k, 104.4% for AGIs $25k-50k, 188.5% for AGIs $50k-75k, 138.5% for AGIs $75k-100k, 699.5% for AGIs $100k-200k)
Taxable individual retirement arrangement distribution: $12,815 (reported on 1.7% of returns)
07504:
$12,815
New Jersey:
$21,558
(% of AGI for various income ranges: 5.5% for AGIs below $25k, 11.2% for AGIs $25k-50k, 48.1% for AGIs $50k-75k, 129.3% for AGIs $75k-100k, 285.5% for AGIs $100k-200k)
Total itemized deductions: $25,969 (reported on 7.1% of returns)
Here:
$25,969
State:
$32,863
(% of AGI for various income ranges: 54.9% for AGIs below $25k, 140.5% for AGIs $25k-50k, 411.2% for AGIs $50k-75k, 836.3% for AGIs $75k-100k, 1752.5% for AGIs $100k-200k)
Charity contributions: $6,947 (reported on 5.5% of returns)
Here:
$6,947
State:
$7,880
(% of AGI for various income ranges: 5.6% for AGIs below $25k, 21.2% for AGIs $25k-50k, 71.1% for AGIs $50k-75k, 200.0% for AGIs $75k-100k, 470.0% for AGIs $100k-200k)
Taxes paid: $9,091 (reported on 7.1% of returns)
07504:
$9,091
State:
$9,183
(% of AGI for various income ranges: 17.7% for AGIs below $25k, 48.8% for AGIs $25k-50k, 157.1% for AGIs $50k-75k, 310.0% for AGIs $75k-100k, 590.0% for AGIs $100k-200k)
Earned income credit: $2,370 (reported on 29.7% of returns)
Here:
$2,370
State:
$2,148
(% of AGI for various income ranges: 138.3% for AGIs below $25k, 85.2% for AGIs $25k-50k)
Percentage of individuals using paid preparers for their 2020 taxes: 92.3%
Here:
92%
State:
92%
(% for various income ranges: 90.9% for AGIs below $25k, 94.2% for AGIs $25k-50k, 92.0% for AGIs $50k-75k, 92.1% for AGIs $75k-100k, 90.9% for AGIs $100k-200k, 100.0% for AGIs over 200k)
Averages for the 2012 tax year for zip code 07504, filed in 2013:
Average Adjusted Gross Income (AGI) in 2012: $32,809 (Individual Income Tax Returns)
Here:
$32,809
State:
$79,688
Salary/wage: $31,132 (reported on 88.1% of returns)
Here:
$31,132
State:
$68,122
(% of AGI for various income ranges: 78.6% for AGIs below $25k, 91.5% for AGIs $25k-50k, 85.6% for AGIs $50k-75k, 83.5% for AGIs $75k-100k, 79.1% for AGIs $100k-200k, 53.9% for AGIs over 200k)
Taxable interest for individuals: $600 (reported on 10.4% of returns)
This zip code:
$600
New Jersey:
$2,193
(% of AGI for various income ranges: 0.1% for AGIs below $25k, 0.2% for AGIs $25k-50k, 0.3% for AGIs $50k-75k, 0.2% for AGIs $100k-200k)
Ordinary dividends: $1,708 (reported on 4.0% of returns)
Here:
$1,708
State:
$6,828
(% of AGI for various income ranges: 0.2% for AGIs $50k-75k, 0.3% for AGIs $75k-100k, 0.7% for AGIs $100k-200k)
Net capital gain/loss in AGI: +$559 (reported on 2.6% of returns)
Here:
+$559
State:
+$15,358
(% of AGI for various income ranges: 0.6% for AGIs $100k-200k)
Profit/loss from business: +$7,441 (reported on 11.4% of returns)
Here:
+$7,441
State:
+$19,577
(% of AGI for various income ranges: 9.0% for AGIs below $25k, 1.2% for AGIs $25k-50k, 0.9% for AGIs $50k-75k, 0.2% for AGIs $75k-100k, 0.6% for AGIs $100k-200k)
Taxable individual retirement arrangement distribution: $11,060 (reported on 2.3% of returns)
07504:
$11,060
New Jersey:
$18,214
(% of AGI for various income ranges: 0.3% for AGIs below $25k, 0.3% for AGIs $25k-50k, 0.9% for AGIs $50k-75k, 1.3% for AGIs $75k-100k, 2.1% for AGIs $100k-200k)
Total itemized deductions: $20,782 (33% of AGI, reported on 22.2% of returns)
Here:
$20,782
State:
$30,827
Here:
32.6% of AGI
State:
21.2% of AGI
(% of AGI for various income ranges: 7.0% for AGIs below $25k, 11.6% for AGIs $25k-50k, 16.4% for AGIs $50k-75k, 20.5% for AGIs $75k-100k, 21.6% for AGIs $100k-200k, 17.8% for AGIs over 200k)
Charity contributions: $3,722 (reported on 17.2% of returns)
Here:
$3,722
State:
$3,451
(% of AGI for various income ranges: 0.5% for AGIs below $25k, 1.4% for AGIs $25k-50k, 2.4% for AGIs $50k-75k, 3.5% for AGIs $75k-100k, 3.4% for AGIs $100k-200k, 2.8% for AGIs over 200k)
Taxes paid: $8,243 (reported on 22.1% of returns)
07504:
$8,243
State:
$15,801
(% of AGI for various income ranges: 2.9% for AGIs below $25k, 3.6% for AGIs $25k-50k, 6.2% for AGIs $50k-75k, 8.6% for AGIs $75k-100k, 10.0% for AGIs $100k-200k, 8.7% for AGIs over 200k)
Earned income credit: $2,386 (reported on 34.9% of returns)
Here:
$2,386
State:
$2,182
(% of AGI for various income ranges: 9.5% for AGIs below $25k, 1.6% for AGIs $25k-50k)
Percentage of individuals using paid preparers for their 2012 taxes: 73.8%
Here:
74%
State:
65%
(% for various income ranges: 75.5% for AGIs below $25k, 72.7% for AGIs $25k-50k, 73.5% for AGIs $50k-75k, 64.0% for AGIs $75k-100k, 70.8% for AGIs $100k-200k, 66.7% for AGIs over 200k)
Averages for the 2004 tax year for zip code 07504, filed in 2005:
Average Adjusted Gross Income (AGI) in 2004: $30,425 (Individual Income Tax Returns)
Here:
$30,425
State:
$64,921
Salary/wage: $29,733 (reported on 92.0% of returns)
Here:
$29,733
State:
$57,755
(% of AGI for various income ranges: 95.1% for AGIs below $10k, 90.5% for AGIs $10k-25k, 95.3% for AGIs $25k-50k, 92.5% for AGIs $50k-75k, 87.4% for AGIs $75k-100k, 74.1% for AGIs over 100k)
Taxable interest for individuals: $570 (reported on 21.3% of returns)
This zip code:
$570
New Jersey:
$2,068
(% of AGI for various income ranges: 1.1% for AGIs below $10k, 0.2% for AGIs $10k-25k, 0.3% for AGIs $25k-50k, 0.3% for AGIs $50k-75k, 0.4% for AGIs $75k-100k, 0.8% for AGIs over 100k)
Taxable dividends: $1,795 (reported on 6.0% of returns)
Here:
$1,795
State:
$3,959
(% of AGI for various income ranges: 0.3% for AGIs below $10k, 0.2% for AGIs $10k-25k, 0.2% for AGIs $25k-50k, 0.2% for AGIs $50k-75k, 0.3% for AGIs $75k-100k, 1.4% for AGIs over 100k)
Net capital gain/loss: +$8,996 (reported on 4.3% of returns)
Here:
+$8,996
State:
+$13,591
(% of AGI for various income ranges: -0.3% for AGIs below $10k, -0.0% for AGIs $10k-25k, 0.1% for AGIs $25k-50k, 1.0% for AGIs $50k-75k, 1.9% for AGIs $75k-100k, 5.9% for AGIs over 100k)
Profit/loss from business: +$6,039 (reported on 9.7% of returns)
Here:
+$6,039
State:
+$17,520
(% of AGI for various income ranges: 13.5% for AGIs below $10k, 4.2% for AGIs $10k-25k, 0.8% for AGIs $25k-50k, 0.4% for AGIs $50k-75k, 0.1% for AGIs $75k-100k, 2.1% for AGIs over 100k)
IRA payment deduction: $2,143 (reported on 0.8% of returns)
07504:
$2,143
New Jersey:
$3,270
Total itemized deductions: $18,886 (34% of AGI, reported on 27.5% of returns)
Here:
$18,886
State:
$23,924
Here:
34.3% of AGI
State:
21.1% of AGI
(% of AGI for various income ranges: 13.4% for AGIs below $10k, 9.6% for AGIs $10k-25k, 15.7% for AGIs $25k-50k, 22.0% for AGIs $50k-75k, 21.2% for AGIs $75k-100k, 22.1% for AGIs over 100k)
Charity contributions deductions: $3,698 (6% of AGI, reported on 24.2% of returns)
Here:
$3,698
State:
$3,242
Here:
6.4% of AGI
State:
2.7% of AGI
(% of AGI for various income ranges: 0.9% for AGIs below $10k, 1.1% for AGIs $10k-25k, 2.8% for AGIs $25k-50k, 3.6% for AGIs $50k-75k, 3.9% for AGIs $75k-100k, 4.7% for AGIs over 100k)
Total tax: $3,461 (reported on 61.8% of returns)
07504:
$3,461
State:
$12,321
(% of AGI for various income ranges: 3.0% for AGIs below $10k, 2.7% for AGIs $10k-25k, 5.3% for AGIs $25k-50k, 8.1% for AGIs $50k-75k, 9.9% for AGIs $75k-100k, 14.2% for AGIs over 100k)
Earned income credit: $1,801 (reported on 31.9% of returns)
Here:
$1,801
State:
$1,711
Percentage of individuals using paid preparers for their 2004 taxes: 72.3%
Here:
72%
State:
65%
(% for various income ranges: 67.3% for AGIs below $10k, 76.5% for AGIs $10k-25k, 71.6% for AGIs $25k-50k, 67.7% for AGIs $50k-75k, 72.8% for AGIs $75k-100k, 77.7% for AGIs over 100k)
Household received Food Stamps/SNAP in the past 12 months: 1,461 Household did not receive Food Stamps/SNAP in the past 12 months: 2,928
Women who had a birth in the past 12 months: 262 (98 now married, 158 unmarried) Women who did not have a birth in the past 12 months: 3,246 (801 now married, 2,455 unmarried)
Housing units in zip code 07504 with a mortgage: 1,069 (13 second mortgage, 14 both second mortgage and home equity loan) Houses without a mortgage: 17
Median monthly owner costs for units with a mortgage: $2,544 Median monthly owner costs for units without a mortgage: $1,198
Residents with income below the poverty level in 2022:
This zip code:
19.4%
Whole state:
9.7%
Residents with income below 50% of the poverty level in 2022:
This zip code:
11.5%
Whole state:
5.2%
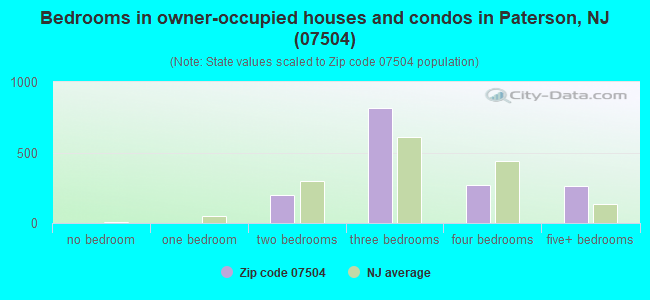
Median number of rooms in houses and condos:
Here:
6.6
State:
6.8
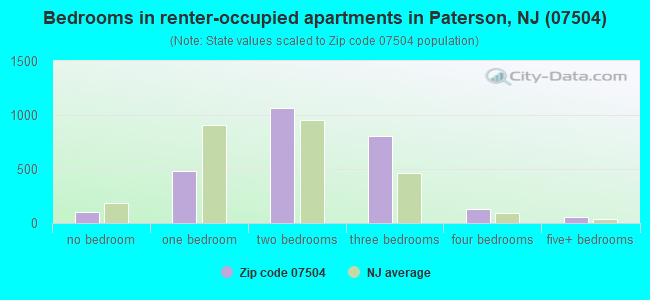
Median number of rooms in apartments:
Here:
4.1
State:
3.9
Notable locations in this zip code not listed on our city pages
Churches in zip code 07504 include: B'nai Jeshurun Temple (A), Saint Teresa Roman Catholic Church (B), Community Synagogue (C), East Side Presbyterian Church (D), Wesley Methodist Episcopal Church (E), Reformed Church of the Covenant (F), Eastside Terrace Methodist Episcopal Church (G). Display/hide their locations on the map
1,440 married couples with children.
757 single-parent households (61 men, 696 women).
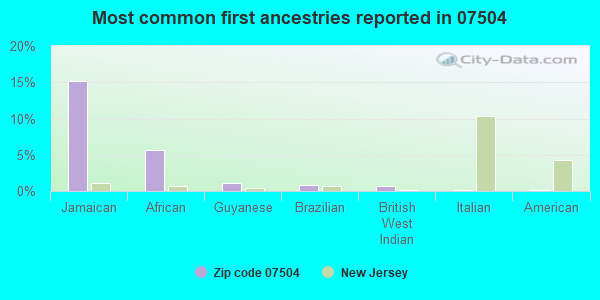
50.2% of residents of 07504 zip code speak English at home.
48.8% of residents speak Spanish at home (45% very well, 14% well, 22% not well, 19% not at all).
0.9% of residents speak other Indo-European language at home (9% very well, 39% not well, 52% not at all).
0.5% of residents speak Asian or Pacific Island language at home (20% very well, 56% well, 23% not well).
0.3% of residents speak other language at home (73% very well, 27% not at all).
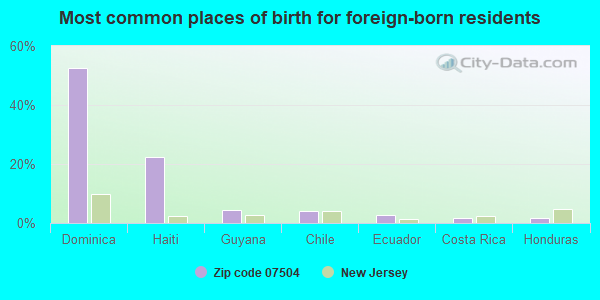
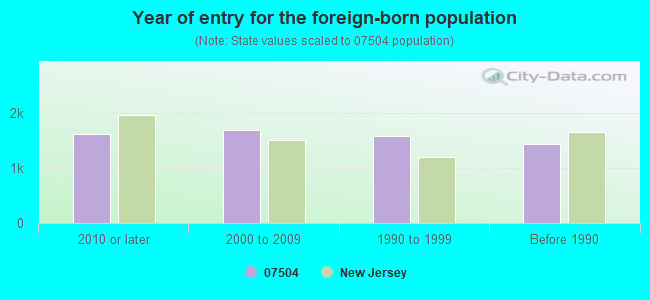
Foreign born population: 6,103 (44.2%) (55.6% of them are naturalized citizens)
Facilities with environmental interests located in this zip code:
30TH. STREET CLEANERS (498 EAST 30 STREET CLEANERS in PATERSON, NJ)
AIR MINOR (AIRS/AFS) (Integrated Compliance Information System) - ICIS-02-2004-1272, ENFORCEMENT/COMPLIANCE ACTIVITY FORMAL ENFORCEMENT ACTION (Integrated Compliance Information System) - ICIS-02-2004-1272, ENFORCEMENT/COMPLIANCE ACTIVITY Business SIC classification: DRYCLEANING PLANTS, EXCEPT RUG CLEANING
BL WHITE WELDING & STEEL CO (527 E 33RD ST in PATERSON CITY, NJ)
STATE MASTER (New Jersey environmental info) - NJEMS-217869, National Pollutant Discharge Elimination System Permit, NJEMS-30602200000, EPCRA, NJEMS-32034, AIR PROGRAM National Pollutant Discharge Elimination System NON-MAJOR (Tracking pollutant discharge elimination systems) - permit Business SIC classification: FABRICATED STRUCTURAL METAL; ARCHITECTURAL AND ORNAMENTAL METALWORK
PABRICO STEEL FABRICATORS INC (518 E 36TH ST in PATERSON CITY, NJ)
STATE MASTER (New Jersey environmental info) - NJEMS-031823, STATE CLEANUP SITE, NJEMS-07258700000, EPCRA, NJEMS-194872, National Pollutant Discharge Elimination System Permit, NJEMS-30445, AIR PROGRAM National Pollutant Discharge Elimination System NON-MAJOR (Tracking pollutant discharge elimination systems) - permit Business SIC classification: FABRICATED STRUCTURAL METAL; FABRICATED PLATE WORK (BOILER SHOPS)
BETAL ENVIRONMENTAL (250 VREELAND AVE in PATERSON, NJ)
(Integrated Compliance Information System) - ICIS-02-2001-7108, FORMAL ENFORCEMENT ACTION TRANSPORTER (Resource Conservation and Recovery Act (tracking hazardous waste)) - ICIS-, ENFORCEMENT/COMPLIANCE ACTIVITY Business SIC classification: SPECIAL TRADE CONTRACTORS Organizations: BRANKO ROVCANIN (CONTACT/OWNER)
NESTY CLEANERS (SB) (518 PARK AVENUE in PATERSON, NJ)
ENFORCEMENT/COMPLIANCE ACTIVITY (Integrated Compliance Information System) - ICIS-02-2004-0920, FORMAL ENFORCEMENT ACTION (Integrated Compliance Information System) - ICIS-02-2004-0920, FORMAL ENFORCEMENT ACTION
EXXON SERVICE STATION #35570 (770 20TH AVENUE in PATERSON, NJ)
ENFORCEMENT/COMPLIANCE ACTIVITY (Integrated Compliance Information System) STATE MASTER (New Jersey environmental info) - NJEMS-00000010109, EPCRA, NJEMS-008448, STATE CLEANUP SITE, NJEMS-219068, REFUSE DISPOSAL, NJEMS-64893700000, EPCRA, NJEMS-A3166, AIR PROGRAM (Resource Conservation and Recovery Act (tracking hazardous waste)) Business SIC classification: GASOLINE SERVICE STATIONS Organizations: EXXON CO USA, EXXON MOBIL CORP Alternative names: EXXON CO USA 35570, EXXON COMPANY USA #35570
NEW ERA CONVERTING MACHINERY INC (235 MCLEAN BOULEVARD in PATERSON, NJ)
STATE MASTER (New Jersey environmental info) - NJEMS-217790, GROUND WATER PROGRAM, NJEMS-31065, AIR PROGRAM, NJEMS-81807500000, EPCRA, NJEMS-NJR000023085, HAZARDOUS WASTE PROGRAM Conditionally Exempt Small Quantity Generators, less than 100 kg/month of hazardous waste (Resource Conservation and Recovery Act (tracking hazardous waste)) - notification Business SIC classification: INDUSTRIAL AND COMMERCIAL MACHINERY AND EQUIPMENT; MOTORS AND GENERATORS Organizations: LEMBO RESEARCH & DEVELOPING CO (CONTACT/OWNER)
PARK AVENUE GULF SERVICE CENTER (310 PARK AVE in PATERSON CITY, NJ)
ENFORCEMENT/COMPLIANCE ACTIVITY (Integrated Compliance Information System) STATE MASTER (New Jersey environmental info) - NJEMS-001941, STATE CLEANUP SITE, NJEMS-24506700000, EPCRA, NJEMS-A3188, AIR PROGRAM Business SIC classification: GASOLINE SERVICE STATIONS Organizations: PARK AVENUE SERVICE STATION, FERNANDEZ YUDELLA (CONTACT/OWNER)
NUMBER 13 (690 EAST 23RD ST. in PATERSON, NJ)
(National Center for Education Statistics) - STATE ID-170 Organizations: PATERSON CITY (SCHOOL DISTRICT)
GILMORE, THE WRIGHT REALTY, INC. (500 PARK AVENUE in PATERSON, NJ)
ENFORCEMENT/COMPLIANCE ACTIVITY (Integrated Compliance Information System) COMPLIANCE ACTIVITY (Tracking inspections of insecticide, fungicide, and rodenticide, and toxic substances) Business SIC classification: REAL ESTATE AGENTS AND MANAGERS
FEDERAL HOME LOAN MORTGAGE (485 E 33RD ST in PATERSON, NJ)
(Resource Conservation and Recovery Act (tracking hazardous waste))
Housing units lacking complete plumbing facilities: 0.2% Housing units lacking complete kitchen facilities: 3.7%
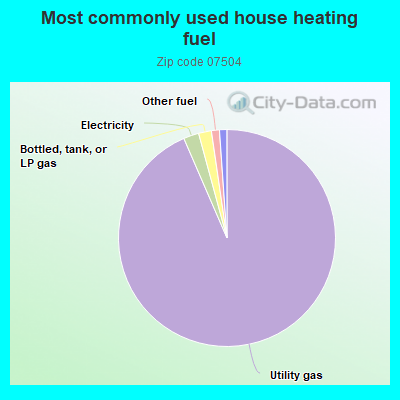
93.5%Utility gas
2.3%Electricity
1.9%Bottled, tank, or LP gas
1.2%Other fuel
1.1%Fuel oil, kerosene, etc.
Population in 1990: 12,152. Population change in the 1990s: +920 (+7.6%).
Place of birth for U.S.-born residents:
This state: 5,973
Northeast: 819
South: 587
West: 17
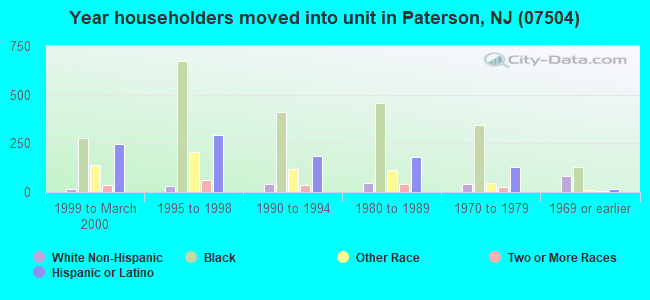
66% of the 07504 zip code residents lived in the same house 5 years ago. Out of people who lived in different houses, 85% lived in this county. Out of people who lived in different counties, 50% lived in New Jersey.
97% of the 07504 zip code residents lived in the same house 1 year ago. Out of people who lived in different houses, 78% moved from this county. Out of people who lived in different houses, 12% moved from different county within same state. Out of people who lived in different houses, 6% moved from different state. Out of people who lived in different houses, 7% moved from abroad.
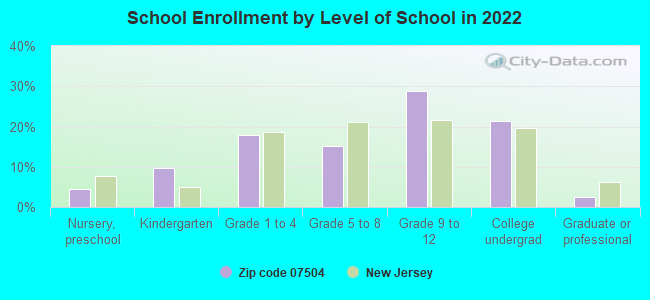
Private vs. public school enrollment:
Students in private schools in grades 1 to 8 (elementary and middle school):
Here:
0.0%
New Jersey:
12.3%
Students in private schools in grades 9 to 12 (high school): 30
Here:
3.1%
New Jersey:
13.1%
Students in private undergraduate colleges: 14
Here:
2.0%
New Jersey:
33.2%
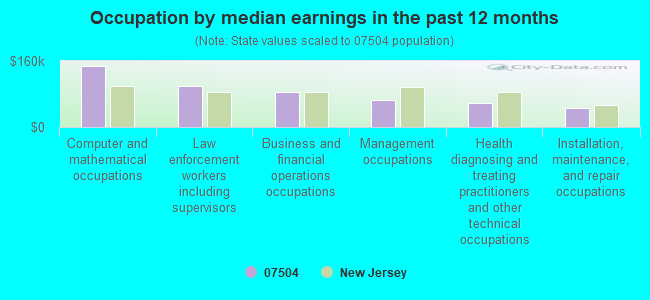
Occupation by median earnings in the past 12 months ($)
147,731Computer and mathematical occupations
100,492Law enforcement workers including supervisors
83,841Business and financial operations occupations
64,636Management occupations
58,980Health diagnosing and treating practitioners and other technical occupations
47,210Installation, maintenance, and repair occupations
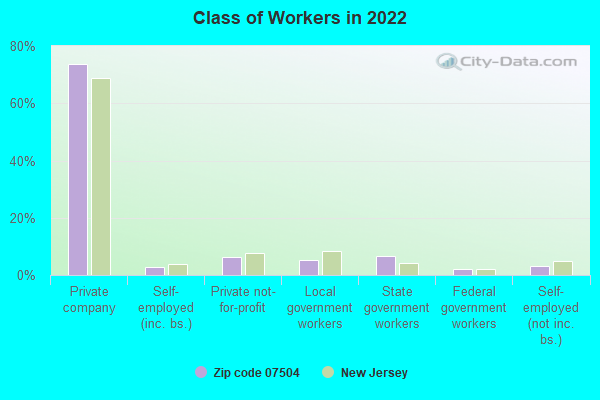
Companies with federal contracts located in this zip code:
SYNERGY MICROWAVE CORP (201 MCLEAN BLVD in PATERSON, NJ; small business) : $816,928 in 3 contractsfrom 2002 to 2005
$800,000 with Department of Defense for Other Defense -- Advanced Development (R&D). Signed on 2002-09-26. Completion date: 2003-09-25.
$12,327 with Navy for Electrical Hardware and Supplies. Signed on 2005-09-08. Completion date: 2005-10-28.
$4,601 with Navy for Electrical and Electronic assemblies, Boards, Cards, and Associated Hardware. Signed on 2004-09-15. Completion date: 2004-11-03.
Top industries in this zip code by the number of employees in 2005:
Health Care and Social Assistance: Child Day Care Services (100-249 employees: 1 establishment, 20-49 employees: 1 establishment, 10-19 employees: 1 establishment)
Administrative and Support and Waste Management and Remediation Services: Remediation Services (100-249: 1, 1-4: 1)
People in group quarters in 2010:
16 people in residential treatment centers for juveniles (non-correctional)
3 people in other noninstitutional facilities
People in group quarters in 2000:
9 people in other noninstitutional group quarters
5 people in religious group quarters
4 people in homes for the mentally ill
Fatal accident statistics in 2012:
Fatal accident count: 1
Vehicles involved in fatal accidents: 1
Fatal accidents caused by drunken drivers: 0
Fatalities: 1
Persons involved in fatal accidents: 1
Pedestrians involved in fatal accidents: 1
Fatal accident statistics in 2011:
Fatal accident count: 4
Vehicles involved in fatal accidents: 6
Fatal accidents caused by drunken drivers: 2
Fatalities: 5
Persons involved in fatal accidents: 8
Pedestrians involved in fatal accidents: 1
Home Mortgage Disclosure Act Aggregated Statistics For Year 2009 (Based on 8 partial tracts)
A) FHA, FSA/RHS & VA Home Purchase Loans
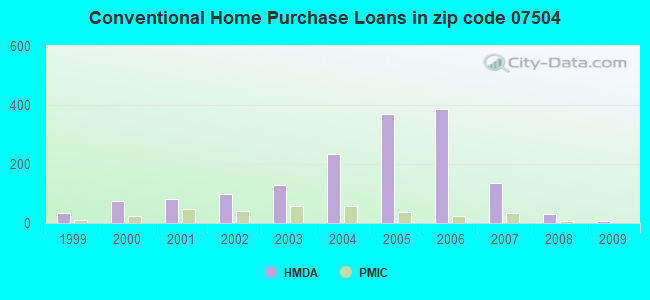
B) Conventional Home Purchase Loans
C) Refinancings
D) Home Improvement Loans
E) Loans on Dwellings For 5+ Families
F) Non-occupant Loans on < 5 Family Dwellings (A B C & D)
G) Loans On Manufactured Home Dwelling (A B C & D)
Number
Average Value
Number
Average Value
Number
Average Value
Number
Average Value
Number
Average Value
Number
Average Value
Number
Average Value
LOANS ORIGINATED
56
$241,699
8
$178,386
113
$240,375
7
$37,437
3
$544,767
2
$263,185
0
$0
APPLICATIONS APPROVED, NOT ACCEPTED
5
$209,966
1
$182,960
10
$260,828
4
$53,105
0
$0
0
$0
0
$0
APPLICATIONS DENIED
19
$203,835
9
$165,076
139
$239,089
33
$91,832
1
$475,700
11
$186,041
1
$422,140
APPLICATIONS WITHDRAWN
18
$261,403
1
$336,100
62
$273,273
6
$71,392
0
$0
3
$253,093
0
$0
FILES CLOSED FOR INCOMPLETENESS
7
$190,186
1
$266,730
30
$277,121
2
$224,450
0
$0
2
$291,185
0
$0
Aggregated Statistics For Year 2008 (Based on 8 partial tracts)
A) FHA, FSA/RHS & VA Home Purchase Loans
B) Conventional Home Purchase Loans
C) Refinancings
D) Home Improvement Loans
E) Loans on Dwellings For 5+ Families
F) Non-occupant Loans on < 5 Family Dwellings (A B C & D)
G) Loans On Manufactured Home Dwelling (A B C & D)
Number
Average Value
Number
Average Value
Number
Average Value
Number
Average Value
Number
Average Value
Number
Average Value
Number
Average Value
LOANS ORIGINATED
40
$292,280
31
$245,274
147
$259,617
23
$62,063
3
$1,231,553
7
$207,893
0
$0
APPLICATIONS APPROVED, NOT ACCEPTED
2
$384,230
10
$277,791
57
$230,630
7
$18,974
0
$0
4
$214,120
0
$0
APPLICATIONS DENIED
18
$273,206
22
$216,945
206
$274,694
50
$60,664
2
$300,970
22
$228,303
1
$102,170
APPLICATIONS WITHDRAWN
14
$327,803
9
$270,186
83
$295,246
10
$136,135
0
$0
7
$284,549
0
$0
FILES CLOSED FOR INCOMPLETENESS
0
$0
5
$258,108
24
$286,750
1
$22,850
0
$0
1
$192,470
0
$0
Aggregated Statistics For Year 2007 (Based on 8 partial tracts)
A) FHA, FSA/RHS & VA Home Purchase Loans
B) Conventional Home Purchase Loans
C) Refinancings
D) Home Improvement Loans
E) Loans on Dwellings For 5+ Families
F) Non-occupant Loans on < 5 Family Dwellings (A B C & D)
Number
Average Value
Number
Average Value
Number
Average Value
Number
Average Value
Number
Average Value
Number
Average Value
LOANS ORIGINATED
16
$359,433
134
$274,282
386
$266,208
52
$80,185
12
$2,293,162
42
$274,265
APPLICATIONS APPROVED, NOT ACCEPTED
1
$375,070
44
$301,452
108
$277,113
23
$63,551
0
$0
17
$256,507
APPLICATIONS DENIED
4
$444,352
110
$288,342
370
$276,729
113
$70,862
2
$276,270
36
$223,200
APPLICATIONS WITHDRAWN
2
$255,510
36
$318,971
141
$263,392
16
$104,157
2
$456,870
11
$322,368
FILES CLOSED FOR INCOMPLETENESS
1
$370,860
12
$302,719
64
$278,112
0
$0
0
$0
4
$326,072
Aggregated Statistics For Year 2006 (Based on 8 partial tracts)
A) FHA, FSA/RHS & VA Home Purchase Loans
B) Conventional Home Purchase Loans
C) Refinancings
D) Home Improvement Loans
E) Loans on Dwellings For 5+ Families
F) Non-occupant Loans on < 5 Family Dwellings (A B C & D)
G) Loans On Manufactured Home Dwelling (A B C & D)
Number
Average Value
Number
Average Value
Number
Average Value
Number
Average Value
Number
Average Value
Number
Average Value
Number
Average Value
LOANS ORIGINATED
13
$383,224
387
$230,812
549
$252,475
85
$88,492
11
$372,278
64
$268,299
0
$0
APPLICATIONS APPROVED, NOT ACCEPTED
1
$578,090
67
$238,329
128
$230,096
23
$60,426
0
$0
11
$224,661
1
$18,300
APPLICATIONS DENIED
1
$414,080
194
$245,818
369
$252,191
125
$88,955
5
$372,110
35
$218,201
1
$185,370
APPLICATIONS WITHDRAWN
2
$401,865
120
$222,514
206
$255,748
15
$133,657
2
$288,730
17
$281,504
0
$0
FILES CLOSED FOR INCOMPLETENESS
1
$319,270
25
$242,607
45
$271,204
4
$147,512
0
$0
3
$232,183
0
$0
Aggregated Statistics For Year 2005 (Based on 8 partial tracts)
A) FHA, FSA/RHS & VA Home Purchase Loans
B) Conventional Home Purchase Loans
C) Refinancings
D) Home Improvement Loans
E) Loans on Dwellings For 5+ Families
F) Non-occupant Loans on < 5 Family Dwellings (A B C & D)
G) Loans On Manufactured Home Dwelling (A B C & D)
Number
Average Value
Number
Average Value
Number
Average Value
Number
Average Value
Number
Average Value
Number
Average Value
Number
Average Value
LOANS ORIGINATED
22
$307,583
369
$219,396
594
$231,360
79
$121,082
8
$473,845
102
$240,703
1
$22,870
APPLICATIONS APPROVED, NOT ACCEPTED
0
$0
47
$186,997
106
$198,491
24
$45,112
1
$353,580
12
$176,237
0
$0
APPLICATIONS DENIED
4
$259,308
115
$211,190
382
$231,296
113
$67,387
1
$764,770
52
$238,813
1
$100,630
APPLICATIONS WITHDRAWN
4
$291,962
89
$237,363
256
$225,129
24
$123,526
2
$79,150
36
$221,059
0
$0
FILES CLOSED FOR INCOMPLETENESS
1
$407,350
22
$186,647
78
$225,772
1
$13,440
0
$0
7
$236,993
0
$0
Aggregated Statistics For Year 2004 (Based on 8 partial tracts)
A) FHA, FSA/RHS & VA Home Purchase Loans
B) Conventional Home Purchase Loans
C) Refinancings
D) Home Improvement Loans
E) Loans on Dwellings For 5+ Families
F) Non-occupant Loans on < 5 Family Dwellings (A B C & D)
G) Loans On Manufactured Home Dwelling (A B C & D)
Number
Average Value
Number
Average Value
Number
Average Value
Number
Average Value
Number
Average Value
Number
Average Value
Number
Average Value
LOANS ORIGINATED
44
$261,042
233
$212,050
452
$198,078
62
$94,761
4
$495,582
70
$194,652
0
$0
APPLICATIONS APPROVED, NOT ACCEPTED
6
$257,498
44
$221,792
101
$183,221
16
$60,062
0
$0
16
$229,048
0
$0
APPLICATIONS DENIED
14
$227,898
72
$213,642
316
$195,576
110
$61,934
3
$381,023
56
$178,215
2
$92,050
APPLICATIONS WITHDRAWN
13
$263,282
48
$226,891
178
$198,803
11
$108,457
2
$251,285
21
$207,595
0
$0
FILES CLOSED FOR INCOMPLETENESS
3
$204,533
12
$241,332
48
$227,357
1
$91,480
0
$0
5
$260,538
0
$0
Aggregated Statistics For Year 2003 (Based on 8 partial tracts)
A) FHA, FSA/RHS & VA Home Purchase Loans
B) Conventional Home Purchase Loans
C) Refinancings
D) Home Improvement Loans
E) Loans on Dwellings For 5+ Families
F) Non-occupant Loans on < 5 Family Dwellings (A B C & D)
Number
Average Value
Number
Average Value
Number
Average Value
Number
Average Value
Number
Average Value
Number
Average Value
LOANS ORIGINATED
65
$231,798
130
$202,853
592
$162,894
55
$37,009
10
$1,562,531
58
$164,169
APPLICATIONS APPROVED, NOT ACCEPTED
4
$204,975
23
$192,783
151
$155,664
19
$53,034
2
$201,255
13
$163,559
APPLICATIONS DENIED
5
$206,586
41
$173,052
447
$163,159
95
$53,077
1
$141,280
31
$144,006
APPLICATIONS WITHDRAWN
13
$225,336
33
$210,777
175
$164,274
18
$37,024
0
$0
10
$188,348
FILES CLOSED FOR INCOMPLETENESS
2
$184,790
4
$184,520
22
$152,585
0
$0
0
$0
2
$219,040
Aggregated Statistics For Year 2002 (Based on 8 partial tracts)
A) FHA, FSA/RHS & VA Home Purchase Loans
B) Conventional Home Purchase Loans
C) Refinancings
D) Home Improvement Loans
E) Loans on Dwellings For 5+ Families
F) Non-occupant Loans on < 5 Family Dwellings (A B C & D)
Number
Average Value
Number
Average Value
Number
Average Value
Number
Average Value
Number
Average Value
Number
Average Value
LOANS ORIGINATED
52
$191,482
98
$169,080
367
$144,236
60
$27,821
6
$608,968
41
$153,490
APPLICATIONS APPROVED, NOT ACCEPTED
7
$152,829
21
$173,772
121
$141,490
35
$40,028
0
$0
5
$138,408
APPLICATIONS DENIED
10
$179,331
30
$161,498
325
$137,142
92
$35,113
2
$300,055
18
$141,718
APPLICATIONS WITHDRAWN
6
$207,735
19
$195,029
163
$194,584
14
$69,808
3
$287,660
5
$152,032
FILES CLOSED FOR INCOMPLETENESS
2
$118,415
10
$216,990
67
$149,312
2
$19,180
0
$0
3
$141,243
Aggregated Statistics For Year 2001 (Based on 8 partial tracts)
A) FHA, FSA/RHS & VA Home Purchase Loans
B) Conventional Home Purchase Loans
C) Refinancings
D) Home Improvement Loans
E) Loans on Dwellings For 5+ Families
F) Non-occupant Loans on < 5 Family Dwellings (A B C & D)
Number
Average Value
Number
Average Value
Number
Average Value
Number
Average Value
Number
Average Value
Number
Average Value
LOANS ORIGINATED
58
$169,129
81
$157,915
269
$126,462
75
$27,478
7
$491,636
23
$137,503
APPLICATIONS APPROVED, NOT ACCEPTED
4
$168,128
16
$133,876
74
$119,550
19
$41,649
0
$0
5
$99,442
APPLICATIONS DENIED
7
$160,646
28
$135,514
309
$112,583
120
$24,696
1
$114,350
16
$157,081
APPLICATIONS WITHDRAWN
9
$126,554
17
$151,821
141
$137,135
29
$24,122
1
$184,790
8
$107,216
FILES CLOSED FOR INCOMPLETENESS
2
$171,600
3
$144,690
31
$122,361
2
$31,740
0
$0
0
$0
Aggregated Statistics For Year 2000 (Based on 8 partial tracts)
A) FHA, FSA/RHS & VA Home Purchase Loans
B) Conventional Home Purchase Loans
C) Refinancings
D) Home Improvement Loans
E) Loans on Dwellings For 5+ Families
F) Non-occupant Loans on < 5 Family Dwellings (A B C & D)
Number
Average Value
Number
Average Value
Number
Average Value
Number
Average Value
Number
Average Value
Number
Average Value
LOANS ORIGINATED
72
$153,680
75
$125,378
156
$103,720
54
$24,651
3
$518,027
25
$111,292
APPLICATIONS APPROVED, NOT ACCEPTED
8
$139,651
8
$146,015
58
$96,800
43
$22,107
0
$0
4
$68,098
APPLICATIONS DENIED
13
$142,403
47
$116,398
253
$85,417
121
$23,124
0
$0
8
$101,414
APPLICATIONS WITHDRAWN
10
$155,985
30
$135,355
124
$94,111
20
$39,229
0
$0
11
$97,244
FILES CLOSED FOR INCOMPLETENESS
6
$142,577
7
$141,387
36
$129,335
3
$28,970
0
$0
1
$174,640
Aggregated Statistics For Year 1999 (Based on 4 partial tracts)
A) FHA, FSA/RHS & VA Home Purchase Loans
B) Conventional Home Purchase Loans
C) Refinancings
D) Home Improvement Loans
E) Loans on Dwellings For 5+ Families
F) Non-occupant Loans on < 5 Family Dwellings (A B C & D)
2002 - 2018 National Fire Incident Reporting System (NFIRS) incidents
Based on the data from the years 2002 - 2018 the average number of fire incidents per year is 7. The highest number of reported fire incidents - 48 took place in 2002, and the least - 0 in 2004. The data has a dropping trend.
When looking into fire subcategories, the most incidents belonged to: Structure Fires (38.9%), and Other (28.6%).
Fire incident types reported to NFIRS in Zip Code 07504


 Nearest zip codes: 07513, 07514, 07503, 07407, 07524, 07501.


 Based on the data from the years 2002 - 2018 the average number of fire incidents per year is 7. The highest number of reported fire incidents - 48 took place in 2002, and the least - 0 in 2004. The data has a dropping trend.
 When looking into fire subcategories, the most incidents belonged to: Structure Fires (38.9%), and Other (28.6%).