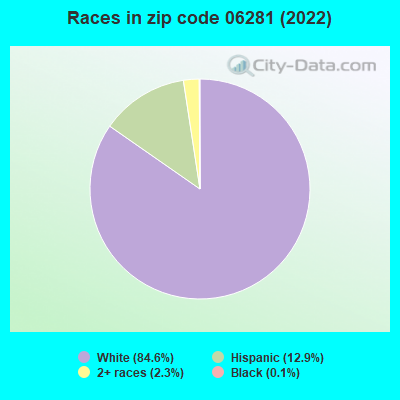
Estimated zip code population in 2022: 7,399 Zip code population in 2010: 6,930 Zip code population in 2000: 6,003
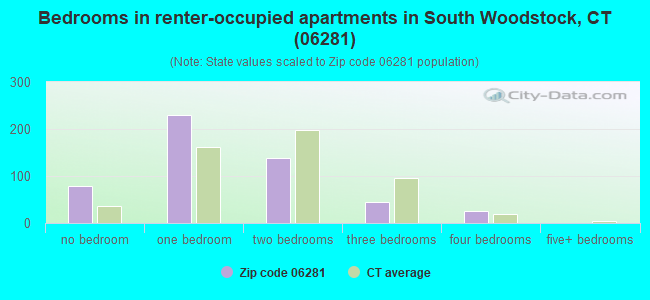
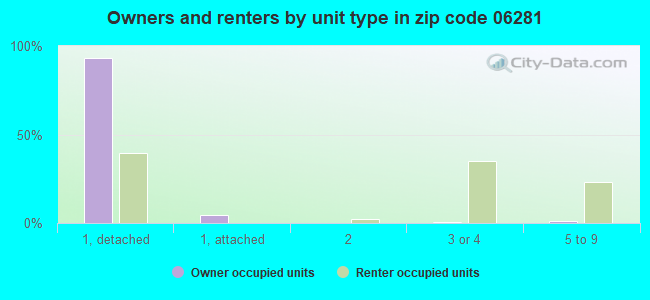
Houses and condos: 3,236 Renter-occupied apartments: 505
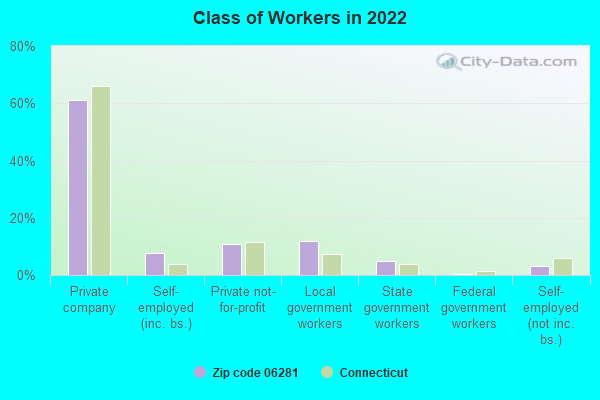
% of renters here:
17%
State:
34%
March 2022 cost of living index in zip code 06281: 109.2 (more than average, U.S. average is 100)
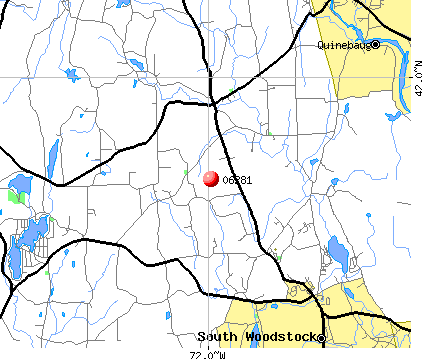
Land area: 55.4 sq. mi. Water area: 0.8 sq. mi.
Population density: 133 people per square mile
(very low).
OSM Map
Google Map
MSN Map
OSM Map
General Map
Google Map
MSN Map
OSM Map
Google Map
MSN Map
OSM Map
Google Map
MSN Map
Please wait while loading the map...
Real estate property taxes paid for housing units in 2022:
This zip code:
1.4% ($5,218)
Connecticut:
1.8% ($6,189)
Median real estate property taxes paid for housing units with mortgages in 2022: $5,046 (1.4%) Median real estate property taxes paid for housing units with no mortgage in 2022: $5,816 (1.4%)
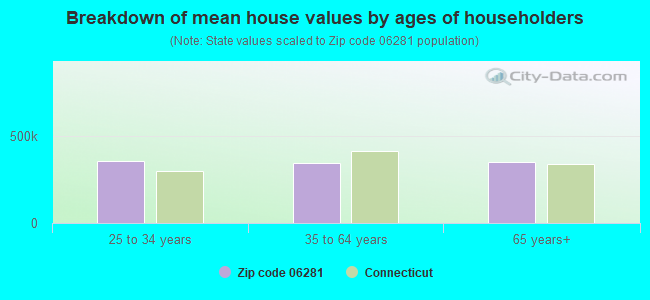
Estimated median house/condo value in 2022: $367,365
06281:
$367,365
Connecticut:
$347,200
According to our research of Connecticut and other state lists, there were 7 registered sex offenders living in 06281 zip code as of June 03, 2024. The ratio of all residents to sex offenders in zip code 06281 is 989 to 1. The ratio of registered sex offenders to all residents in this zip code is lower than the state average.
Median resident age:
This zip code:
42.8 years
Connecticut median age:
40.9 years
Average household size:
This zip code:
2.5 people
Connecticut:
2.5 people
Averages for the 2020 tax year for zip code 06281, filed in 2021:
Average Adjusted Gross Income (AGI) in 2020: $99,821 (Individual Income Tax Returns)
Here:
$99,821
State:
$105,931
Salary/wage: $80,884 (reported on 81.1% of returns)
Here:
$80,884
State:
$83,540
(% of AGI for various income ranges: 1116.1% for AGIs below $25k, 3652.4% for AGIs $25k-50k, 6093.6% for AGIs $50k-75k, 9121.4% for AGIs $75k-100k, 17226.9% for AGIs $100k-200k, 67843.6% for AGIs over 200k)
Taxable interest for individuals: $2,019 (reported on 43.3% of returns)
This zip code:
$2,019
Connecticut:
$3,402
(% of AGI for various income ranges: 25.9% for AGIs below $25k, 21.9% for AGIs $25k-50k, 67.2% for AGIs $50k-75k, 78.3% for AGIs $75k-100k, 101.7% for AGIs $100k-200k, 1672.7% for AGIs over 200k)
Ordinary dividends: $7,355 (reported on 24.6% of returns)
Here:
$7,355
State:
$12,683
(% of AGI for various income ranges: 29.8% for AGIs below $25k, 62.9% for AGIs $25k-50k, 99.2% for AGIs $50k-75k, 207.9% for AGIs $75k-100k, 288.5% for AGIs $100k-200k, 3204.5% for AGIs over 200k)
Net capital gain/loss in AGI: +$24,691 (reported on 22.3% of returns)
Here:
+$24,691
State:
+$44,158
(% of AGI for various income ranges: 33.5% for AGIs below $25k, 51.4% for AGIs $25k-50k, 98.2% for AGIs $50k-75k, 223.1% for AGIs $75k-100k, 595.4% for AGIs $100k-200k, 13612.7% for AGIs over 200k)
Profit/loss from business: +$25,881 (reported on 16.3% of returns)
Here:
+$25,881
State:
+$22,988
(% of AGI for various income ranges: 103.3% for AGIs below $25k, 201.0% for AGIs $25k-50k, 238.2% for AGIs $50k-75k, 476.9% for AGIs $75k-100k, 846.2% for AGIs $100k-200k, 6341.8% for AGIs over 200k)
Taxable individual retirement arrangement distribution: $17,914 (reported on 10.6% of returns)
06281:
$17,914
Connecticut:
$22,031
(% of AGI for various income ranges: 79.4% for AGIs below $25k, 161.9% for AGIs $25k-50k, 301.3% for AGIs $50k-75k, 259.3% for AGIs $75k-100k, 615.6% for AGIs $100k-200k, 579.1% for AGIs over 200k)
Self-employed (Keogh) retirement plans: $24,025 (reported on 1.1% of returns)
06281:
$24,025
Connecticut:
$29,016
(% of AGI for various income ranges: 200.2% for AGIs $100k-200k)
Total itemized deductions: $34,188 (reported on 11.5% of returns)
Here:
$34,188
State:
$37,613
(% of AGI for various income ranges: 204.8% for AGIs $25k-50k, 296.2% for AGIs $50k-75k, 503.1% for AGIs $75k-100k, 845.4% for AGIs $100k-200k, 5584.5% for AGIs over 200k)
Charity contributions: $8,533 (reported on 8.6% of returns)
Here:
$8,533
State:
$13,557
(% of AGI for various income ranges: 23.6% for AGIs $25k-50k, 26.2% for AGIs $50k-75k, 26.2% for AGIs $75k-100k, 143.1% for AGIs $100k-200k, 1450.9% for AGIs over 200k)
Taxes paid: $8,874 (reported on 11.2% of returns)
06281:
$8,874
State:
$9,096
(% of AGI for various income ranges: 73.6% for AGIs $25k-50k, 89.2% for AGIs $50k-75k, 214.5% for AGIs $75k-100k, 249.2% for AGIs $100k-200k, 896.4% for AGIs over 200k)
Earned income credit: $1,776 (reported on 6.0% of returns)
Here:
$1,776
State:
$2,059
(% of AGI for various income ranges: 42.2% for AGIs below $25k, 34.5% for AGIs $25k-50k)
Percentage of individuals using paid preparers for their 2020 taxes: 94.0%
Here:
94%
State:
93%
(% for various income ranges: 91.6% for AGIs below $25k, 93.1% for AGIs $25k-50k, 94.6% for AGIs $50k-75k, 95.2% for AGIs $75k-100k, 96.2% for AGIs $100k-200k, 93.5% for AGIs over 200k)
Averages for the 2012 tax year for zip code 06281, filed in 2013:
Average Adjusted Gross Income (AGI) in 2012: $76,861 (Individual Income Tax Returns)
Here:
$76,861
State:
$93,290
Salary/wage: $65,015 (reported on 83.4% of returns)
Here:
$65,015
State:
$73,117
(% of AGI for various income ranges: 71.1% for AGIs below $25k, 70.9% for AGIs $25k-50k, 75.1% for AGIs $50k-75k, 76.9% for AGIs $75k-100k, 77.3% for AGIs $100k-200k, 56.9% for AGIs over 200k)
Taxable interest for individuals: $2,262 (reported on 53.1% of returns)
This zip code:
$2,262
Connecticut:
$2,530
(% of AGI for various income ranges: 1.8% for AGIs below $25k, 1.2% for AGIs $25k-50k, 0.6% for AGIs $50k-75k, 0.7% for AGIs $75k-100k, 0.9% for AGIs $100k-200k, 3.3% for AGIs over 200k)
Ordinary dividends: $6,121 (reported on 26.9% of returns)
Here:
$6,121
State:
$10,909
(% of AGI for various income ranges: 2.1% for AGIs below $25k, 1.5% for AGIs $25k-50k, 1.7% for AGIs $50k-75k, 1.6% for AGIs $75k-100k, 1.4% for AGIs $100k-200k, 3.7% for AGIs over 200k)
Net capital gain/loss in AGI: +$11,543 (reported on 20.9% of returns)
Here:
+$11,543
State:
+$34,090
(% of AGI for various income ranges: 1.0% for AGIs $25k-50k, 1.1% for AGIs $50k-75k, 0.6% for AGIs $75k-100k, 2.1% for AGIs $100k-200k, 7.8% for AGIs over 200k)
Profit/loss from business: +$15,820 (reported on 17.2% of returns)
Here:
+$15,820
State:
+$22,741
(% of AGI for various income ranges: 6.7% for AGIs below $25k, 4.6% for AGIs $25k-50k, 3.3% for AGIs $50k-75k, 4.7% for AGIs $75k-100k, 2.6% for AGIs $100k-200k, 3.4% for AGIs over 200k)
Taxable individual retirement arrangement distribution: $16,697 (reported on 11.9% of returns)
06281:
$16,697
Connecticut:
$19,976
(% of AGI for various income ranges: 4.2% for AGIs below $25k, 2.9% for AGIs $25k-50k, 2.8% for AGIs $50k-75k, 2.7% for AGIs $75k-100k, 2.8% for AGIs $100k-200k, 1.8% for AGIs over 200k)
Self-employment retirement plans: $22,367 (reported on 0.9% of returns)
06281:
$22,367
Connecticut:
$24,004
Total itemized deductions: $24,265 (19% of AGI, reported on 46.9% of returns)
Here:
$24,265
State:
$33,239
Here:
19.3% of AGI
State:
18.9% of AGI
(% of AGI for various income ranges: 11.3% for AGIs below $25k, 11.2% for AGIs $25k-50k, 14.8% for AGIs $50k-75k, 16.3% for AGIs $75k-100k, 16.5% for AGIs $100k-200k, 13.7% for AGIs over 200k)
Charity contributions: $2,928 (reported on 37.5% of returns)
Here:
$2,928
State:
$4,947
(% of AGI for various income ranges: 0.6% for AGIs below $25k, 0.9% for AGIs $25k-50k, 1.0% for AGIs $50k-75k, 1.5% for AGIs $75k-100k, 1.4% for AGIs $100k-200k, 1.9% for AGIs over 200k)
Taxes paid: $11,631 (reported on 46.9% of returns)
06281:
$11,631
State:
$17,397
(% of AGI for various income ranges: 3.3% for AGIs below $25k, 3.5% for AGIs $25k-50k, 5.7% for AGIs $50k-75k, 6.8% for AGIs $75k-100k, 8.0% for AGIs $100k-200k, 8.6% for AGIs over 200k)
Earned income credit: $1,537 (reported on 8.4% of returns)
Here:
$1,537
State:
$2,053
(% of AGI for various income ranges: 2.8% for AGIs below $25k, 0.5% for AGIs $25k-50k)
Percentage of individuals using paid preparers for their 2012 taxes: 58.8%
Here:
59%
State:
55%
(% for various income ranges: 50.0% for AGIs below $25k, 53.4% for AGIs $25k-50k, 64.0% for AGIs $50k-75k, 61.5% for AGIs $75k-100k, 67.2% for AGIs $100k-200k, 75.0% for AGIs over 200k)
Averages for the 2004 tax year for zip code 06281, filed in 2005:
Average Adjusted Gross Income (AGI) in 2004: $66,941 (Individual Income Tax Returns)
Here:
$66,941
State:
$73,265
Salary/wage: $57,102 (reported on 84.4% of returns)
Here:
$57,102
State:
$62,030
(% of AGI for various income ranges: 170.1% for AGIs below $10k, 69.0% for AGIs $10k-25k, 74.0% for AGIs $25k-50k, 78.7% for AGIs $50k-75k, 84.2% for AGIs $75k-100k, 64.8% for AGIs over 100k)
Taxable interest for individuals: $1,415 (reported on 68.1% of returns)
This zip code:
$1,415
Connecticut:
$2,287
(% of AGI for various income ranges: 12.9% for AGIs below $10k, 4.1% for AGIs $10k-25k, 2.3% for AGIs $25k-50k, 1.1% for AGIs $50k-75k, 0.6% for AGIs $75k-100k, 1.3% for AGIs over 100k)
Taxable dividends: $4,256 (reported on 34.9% of returns)
Here:
$4,256
State:
$5,735
(% of AGI for various income ranges: 12.6% for AGIs below $10k, 2.6% for AGIs $10k-25k, 1.9% for AGIs $25k-50k, 1.6% for AGIs $50k-75k, 1.2% for AGIs $75k-100k, 2.7% for AGIs over 100k)
Net capital gain/loss: +$13,290 (reported on 28.5% of returns)
Here:
+$13,290
State:
+$23,694
(% of AGI for various income ranges: -5.2% for AGIs below $10k, 0.1% for AGIs $10k-25k, 2.1% for AGIs $25k-50k, 1.4% for AGIs $50k-75k, 2.4% for AGIs $75k-100k, 9.4% for AGIs over 100k)
Profit/loss from business: +$13,686 (reported on 18.6% of returns)
Here:
+$13,686
State:
+$20,783
(% of AGI for various income ranges: -4.8% for AGIs below $10k, 6.1% for AGIs $10k-25k, 5.5% for AGIs $25k-50k, 4.9% for AGIs $50k-75k, 2.5% for AGIs $75k-100k, 3.4% for AGIs over 100k)
Profit/loss from farming: +$421 (reported on 1.3% of returns)
Here:
+$421
State:
-$3,306
IRA payment deduction: $3,412 (reported on 4.1% of returns)
06281:
$3,412
Connecticut:
$3,216
(% of AGI for various income ranges: 0.6% for AGIs $25k-50k, 0.4% for AGIs $50k-75k, 0.2% for AGIs $75k-100k, 0.1% for AGIs over 100k)
Self-employed pension: $13,049 (reported on 2.1% of returns)
Here:
$13,049
Connecticut:
$17,335
Total itemized deductions: $19,410 (18% of AGI, reported on 50.5% of returns)
Here:
$19,410
State:
$24,919
Here:
18.4% of AGI
State:
18.6% of AGI
(% of AGI for various income ranges: 35.6% for AGIs below $10k, 15.1% for AGIs $10k-25k, 16.2% for AGIs $25k-50k, 16.9% for AGIs $50k-75k, 18.6% for AGIs $75k-100k, 12.0% for AGIs over 100k)
Charity contributions deductions: $2,133 (2% of AGI, reported on 44.9% of returns)
Here:
$2,133
State:
$3,762
Here:
1.9% of AGI
State:
2.7% of AGI
(% of AGI for various income ranges: 1.4% for AGIs below $10k, 1.2% for AGIs $10k-25k, 1.3% for AGIs $25k-50k, 1.5% for AGIs $50k-75k, 1.6% for AGIs $75k-100k, 1.4% for AGIs over 100k)
Total tax: $10,997 (reported on 83.3% of returns)
06281:
$10,997
State:
$15,148
(% of AGI for various income ranges: 8.0% for AGIs below $10k, 4.8% for AGIs $10k-25k, 7.4% for AGIs $25k-50k, 9.0% for AGIs $50k-75k, 9.6% for AGIs $75k-100k, 18.8% for AGIs over 100k)
Earned income credit: $1,578 (reported on 5.8% of returns)
Here:
$1,578
State:
$1,570
Percentage of individuals using paid preparers for their 2004 taxes: 60.6%
Here:
61%
State:
59%
(% for various income ranges: 50.1% for AGIs below $10k, 53.5% for AGIs $10k-25k, 61.3% for AGIs $25k-50k, 63.0% for AGIs $50k-75k, 63.3% for AGIs $75k-100k, 72.5% for AGIs over 100k)
Household received Food Stamps/SNAP in the past 12 months: 25 Household did not receive Food Stamps/SNAP in the past 12 months: 2,954
Women who had a birth in the past 12 months: 49 (12 now married, 40 unmarried) Women who did not have a birth in the past 12 months: 1,535 (591 now married, 941 unmarried)
Housing units in zip code 06281 with a mortgage: 1,697 (249 second mortgage, 236 both second mortgage and home equity loan) Houses without a mortgage: 26
Median monthly owner costs for units with a mortgage: $2,131 Median monthly owner costs for units without a mortgage: $810
Residents with income below the poverty level in 2022:
This zip code:
4.0%
Whole state:
9.8%
Residents with income below 50% of the poverty level in 2022:
This zip code:
2.9%
Whole state:
4.8%
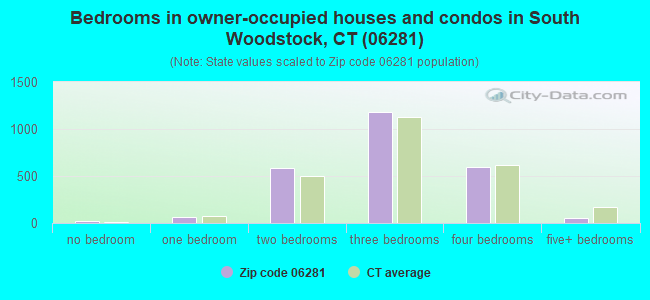
Median number of rooms in houses and condos:
Here:
6.3
State:
6.5
Median number of rooms in apartments:
Here:
3.2
State:
4.0
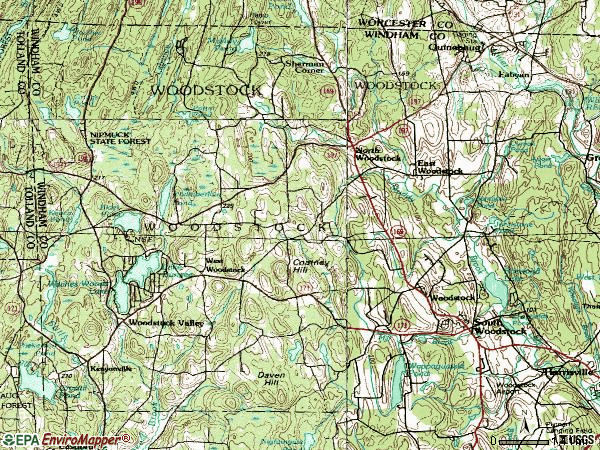
Notable locations in this zip code not listed on our city pages
Notable locations in zip code 06281: Saint Mary Camp (A), Woodstock Golf Course (B), Woodstock Fairgrounds (C), Camp Woodstock (D), Meadowside Campground (E), Manna Campground (F), Black Pond Campground (G), Harrisville Golf Club (H), Chamberlain Lake Campground (I), Evergreen Park (J), Woodstock Fire Department Station 76 (K), Woodstock Town Highway Garage (L), Woodstock Town Hall (M), West Woodstock Library (N), Roseland Cottage (O), Photomobile Model Museum (P), North Woodstock Library (Q), Muddy Brook Fire Department Station 75 (R), May Memorial Library (S), John Eliot Library (T). Display/hide their locations on the map
Churches in zip code 06281 include: Church of the Good Shepherd (A), East Woodstock Congregational Church (B), Evangelical Covenant Church (C), First Congregational Church of Woodstock (D), South Woodstock Baptist Church (E). Display/hide their locations on the map
Cemeteries: Quasset Cemetery (1), Woodstock Hill Cemetery (2), Woodstock Central Cemetery (3), Elmvale Cemetery (4), Marcy Cemetery (5), East Woodstock Cemetery (6), North Woodstock Cemetery (7). Display/hide their locations on the map
Lakes, reservoirs, and swamps: Cedar Swamp Pond (A), Wappaquasset Pond (B), Coman Pond (C), Hatchet Pond (D), Keach Pond (E), Potter Pond (F), Morse Pond (G), Muddy Pond (H). Display/hide their locations on the map
Streams, rivers, and creeks: Little Brook (A), Mascraft Brook (B), May Brook (C), Mill Brook (D), Muddy Brook (E), North Running Brook (F), Peake Brook (G), Peckham Brook (H), Redhead Meadows Brook (I). Display/hide their locations on the map
In group quarters: 10 (-1 institutionalized population)
Size of family households: 1,032 2-persons, 398 3-persons, 446 4-persons, 106 5-persons, 65 6-persons
Size of nonfamily households: 766 1-person, 174 2-persons
1,043 married couples with children.
514 single-parent households (99 men, 415 women).
92.2% of residents of 06281 zip code speak English at home.
7.1% of residents speak Spanish at home (64% very well, 21% well, 15% not well).
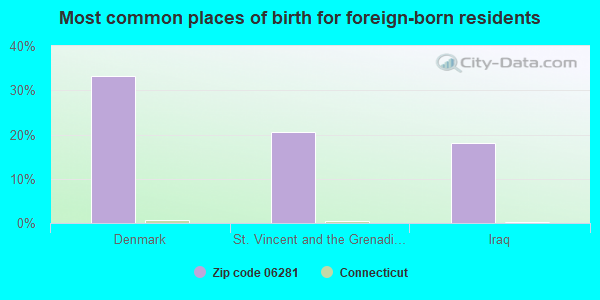
Foreign born population: 172 (2.3%) (100.0% of them are naturalized citizens)
This zip code:
2.3%
Whole state:
15.7%
33%Denmark
20%St. Vincent and the Grenadines
18%Iraq
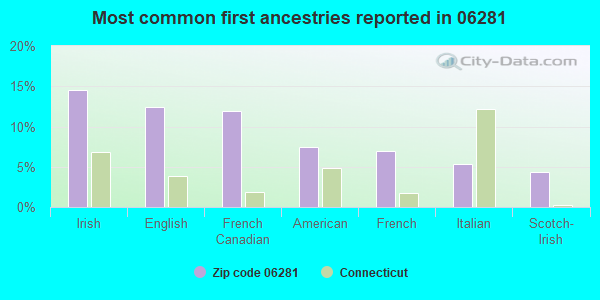
15%Irish
12%English
12%French Canadian
7%American
7%French
5%Italian
4%Scotch-Irish
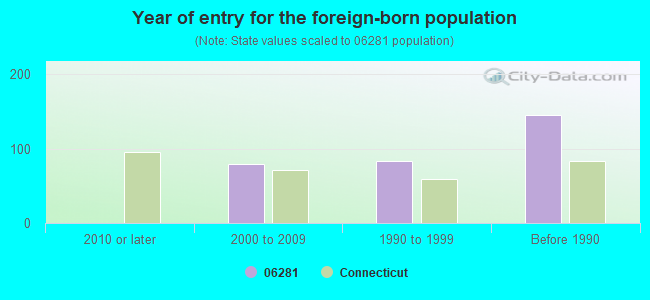
Year of entry for the foreign-born population
02010 or later
792000 to 2009
831990 to 1999
145Before 1990
Facilities with environmental interests located in this zip code:
BROOKWOOD APARTMENTS (NO LOCATION ADDRESS IN ICIS OR SDWIS in WOODSTOCK, CT)
(Integrated Compliance Information System) - ICIS-01-2000-0129, FORMAL ENFORCEMENT ACTION COMMUNITY WATER SYSTEM (SDWIS) - SDWIS-CT1699011 11469, WATER TREATMENT PLANT
HOMEBOUND (24 FROG POND ROAD in WOODSTOCK, CT)
(National Center for Education Statistics) - STATE ID-88 Organizations: WOODSTOCK SCHOOL DISTRICT (SCHOOL DISTRICT)
ASHLAND INDUSTRIES FUEL CORPORATION (HARRISVILLE ROAD in WOODSTOCK, CT)
National Pollutant Discharge Elimination System NON-MAJOR (Tracking pollutant discharge elimination systems) - permit
NU SPILL (23 BEAVER DAM RD in WOODSTOCK, CT)
COMPLIANCE ACTIVITY (Tracking inspections of insecticide, fungicide, and rodenticide, and toxic substances)
Housing units lacking complete plumbing facilities: 2.8% Housing units lacking complete kitchen facilities: 3.4%
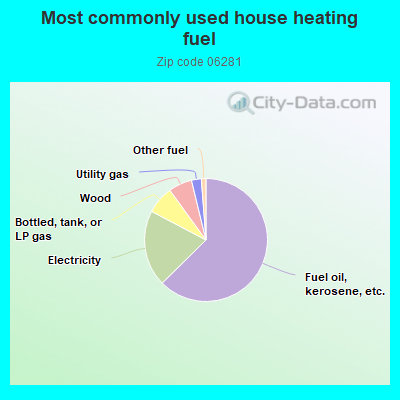
62.7%Fuel oil, kerosene, etc.
20.1%Electricity
7.3%Bottled, tank, or LP gas
6.2%Wood
2.6%Utility gas
1.2%Other fuel
Population in 1990: 5,698. Population change in the 1990s: +305 (+5.4%).
Place of birth for U.S.-born residents:
This state: 3,747
Northeast: 2,834
Midwest: 106
South: 161
West: 233
62% of the 06281 zip code residents lived in the same house 5 years ago. Out of people who lived in different houses, 60% lived in this county. Out of people who lived in different counties, 50% lived in Connecticut.
96% of the 06281 zip code residents lived in the same house 1 year ago. Out of people who lived in different houses, 46% moved from this county. Out of people who lived in different houses, 67% moved from different state.
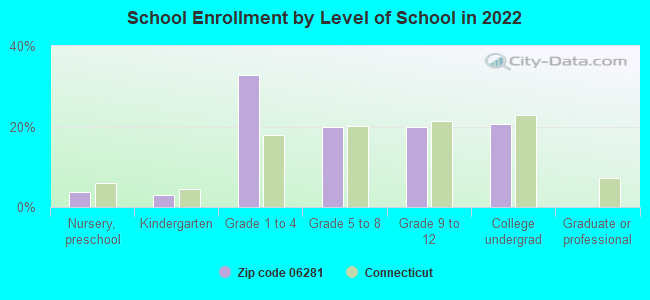
Private vs. public school enrollment:
Students in private schools in grades 1 to 8 (elementary and middle school): 28
Here:
2.9%
Connecticut:
9.5%
Students in private schools in grades 9 to 12 (high school): 27
Here:
7.3%
Connecticut:
12.9%
Students in private undergraduate colleges: 35
Here:
9.2%
Connecticut:
35.5%
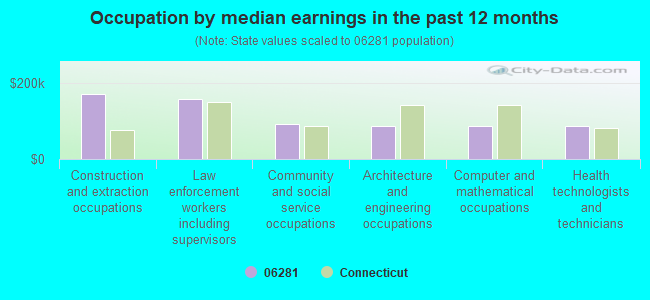
Occupation by median earnings in the past 12 months ($)
172,663Construction and extraction occupations
157,532Law enforcement workers including supervisors
93,246Community and social service occupations
87,728Architecture and engineering occupations
86,717Computer and mathematical occupations
86,629Health technologists and technicians
Top industries in this zip code by the number of employees in 2005:
Educational Services: Elementary and Secondary Schools (100-249 employees: 2 establishments)
Management of Companies and Enterprises: Corporate, Subsidiary, and Regional Managing Offices (100-249: 1, 10-19: 1)
Health Care and Social Assistance: Child Day Care Services (20-49: 1, 10-19: 2)
Construction: New Single-Family Housing Construction (except Operative Builders) (20-49: 1, 5-9: 2, 1-4: 1)
Accommodation and Food Services: Bed-and-Breakfast Inns (20-49: 1)
Construction: New Multifamily Housing Construction (except Operative Builders) (20-49: 1)
Accommodation and Food Services: Limited-Service Restaurants (10-19: 1, 1-4: 1)
People in group quarters in 2000:
12 people in other nonhousehold living situations
Fatal accident statistics in 2014:
Fatal accident count: 1
Vehicles involved in fatal accidents: 1
Fatal accidents caused by drunken drivers: 0
Fatalities: 1
Persons involved in fatal accidents: 1
Pedestrians involved in fatal accidents: 1
Fatal accident statistics in 2013:
Fatal accident count: 1
Vehicles involved in fatal accidents: 1
Fatal accidents caused by drunken drivers: 0
Fatalities: 1
Persons involved in fatal accidents: 1
Pedestrians involved in fatal accidents: 0
2002 - 2018 National Fire Incident Reporting System (NFIRS) incidents
According to the data from the years 2002 - 2018 the average number of fires per year is 30. The highest number of fires - 45 took place in 2008, and the least - 16 in 2018. The data has a decreasing trend.
When looking into fire subcategories, the most incidents belonged to: Structure Fires (53.5%), and Outside Fires (29.3%).
Fire incident types reported to NFIRS in Zip Code 06281


+$421
-$3,306
 Nearest zip codes: 06282, 06262, 01550, 06259, 06242, 01571.


 According to the data from the years 2002 - 2018 the average number of fires per year is 30. The highest number of fires - 45 took place in 2008, and the least - 16 in 2018. The data has a decreasing trend.
 When looking into fire subcategories, the most incidents belonged to: Structure Fires (53.5%), and Outside Fires (29.3%).