Estimated zip code population in 2022: 7,174 Zip code population in 2010: 7,308 Zip code population in 2000: 6,907
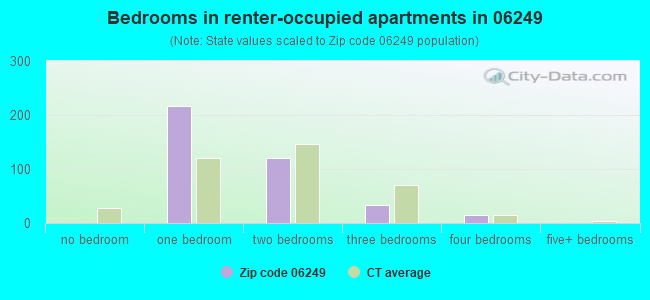
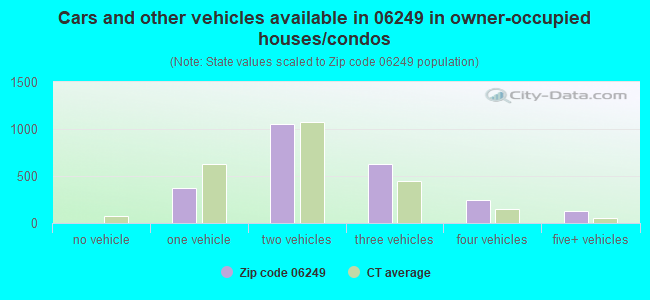
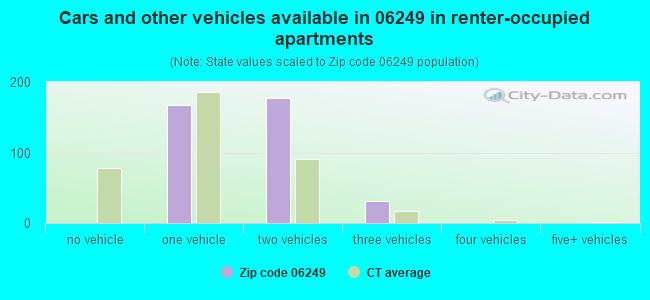
Houses and condos: 3,166 Renter-occupied apartments: 381
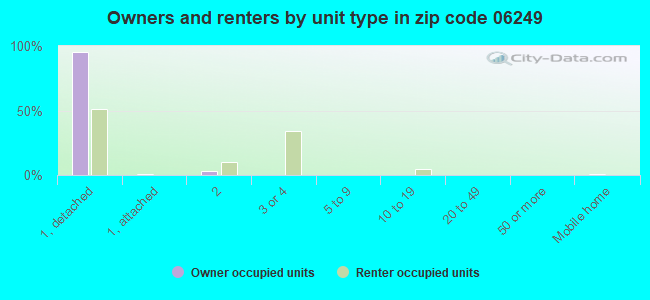
% of renters here:
13%
State:
34%
March 2022 cost of living index in zip code 06249: 97.4 (near average, U.S. average is 100)
Land area: 54.1 sq. mi. Water area: 1.2 sq. mi.
Population density: 133 people per square mile
(very low).
OSM Map
Google Map
MSN Map
OSM Map
General Map
Google Map
MSN Map
OSM Map
Google Map
MSN Map
OSM Map
Google Map
MSN Map
Please wait while loading the map...
Real estate property taxes paid for housing units in 2022:
This zip code:
1.5% ($5,088)
Connecticut:
1.8% ($6,189)
Median real estate property taxes paid for housing units with mortgages in 2022: $4,902 (1.4%) Median real estate property taxes paid for housing units with no mortgage in 2022: $5,605 (1.6%)
Business Search- 14 Million verified businesses
Males: 3,529
(49.2%)
Females: 3,644
(50.8%)
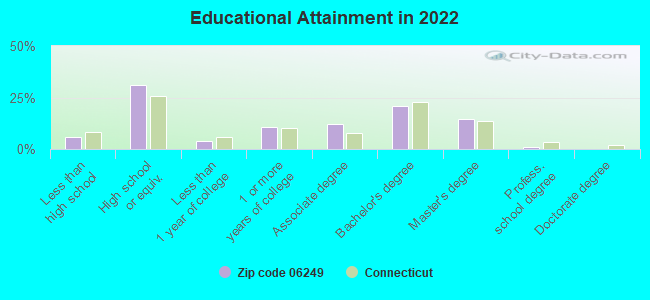
For population 25 years and over in 06249:
High school or higher: 94.3%
Bachelor's degree or higher: 36.5%
Graduate or professional degree: 15.7%
Unemployed: 3.6%
Mean travel time to work (commute): 33.7 minutes
For population 15 years and over in 06249:
Never married: 29.9%
Now married: 58.2%
Separated: 0.4%
Widowed: 5.3%
Divorced: 6.1%
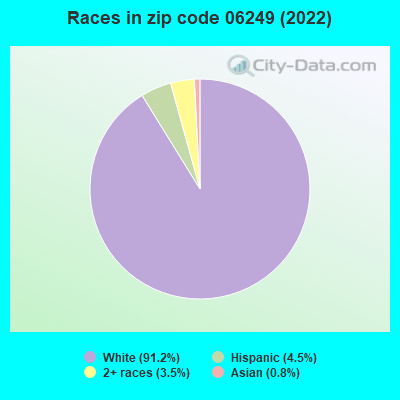
Zip code 06249 compared to state average:
Black race population percentage significantly below state average.
Hispanic race population percentage significantly below state average.
Median age above state average.
Foreign-born population percentage significantly below state average.
Renting percentage significantly below state average.
Length of stay since moving in significantly above state average.
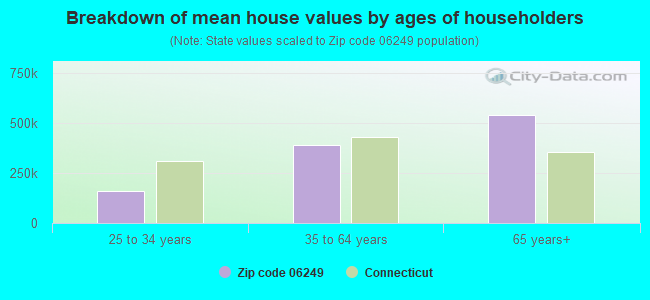
Estimated median house/condo value in 2022: $349,238
06249:
$349,238
Connecticut:
$347,200
According to our research of Connecticut and other state lists, there were 10 registered sex offenders living in 06249 zip code as of June 03, 2024. The ratio of all residents to sex offenders in zip code 06249 is 736 to 1. The ratio of registered sex offenders to all residents in this zip code is near the state average.
Median resident age:
This zip code:
47.0 years
Connecticut median age:
40.9 years
Average household size:
This zip code:
2.5 people
Connecticut:
2.5 people
Averages for the 2020 tax year for zip code 06249, filed in 2021:
Average Adjusted Gross Income (AGI) in 2020: $80,087 (Individual Income Tax Returns)
Here:
$80,087
State:
$105,931
Salary/wage: $68,968 (reported on 81.0% of returns)
Here:
$68,968
State:
$83,540
(% of AGI for various income ranges: 1150.9% for AGIs below $25k, 3231.8% for AGIs $25k-50k, 5680.9% for AGIs $50k-75k, 8393.9% for AGIs $75k-100k, 16563.7% for AGIs $100k-200k, 51715.7% for AGIs over 200k)
Taxable interest for individuals: $945 (reported on 40.4% of returns)
This zip code:
$945
Connecticut:
$3,402
(% of AGI for various income ranges: 22.5% for AGIs below $25k, 30.2% for AGIs $25k-50k, 49.1% for AGIs $50k-75k, 35.6% for AGIs $75k-100k, 83.0% for AGIs $100k-200k, 448.6% for AGIs over 200k)
Ordinary dividends: $3,796 (reported on 24.1% of returns)
Here:
$3,796
State:
$12,683
(% of AGI for various income ranges: 27.0% for AGIs below $25k, 80.0% for AGIs $25k-50k, 78.3% for AGIs $50k-75k, 88.9% for AGIs $75k-100k, 178.9% for AGIs $100k-200k, 1630.0% for AGIs over 200k)
Net capital gain/loss in AGI: +$8,564 (reported on 18.7% of returns)
Here:
+$8,564
State:
+$44,158
(% of AGI for various income ranges: 34.1% for AGIs below $25k, 36.7% for AGIs $25k-50k, 95.2% for AGIs $50k-75k, 85.8% for AGIs $75k-100k, 401.5% for AGIs $100k-200k, 3715.7% for AGIs over 200k)
Profit/loss from business: +$17,444 (reported on 13.6% of returns)
Here:
+$17,444
State:
+$22,988
(% of AGI for various income ranges: 80.7% for AGIs below $25k, 197.3% for AGIs $25k-50k, 217.4% for AGIs $50k-75k, 252.8% for AGIs $75k-100k, 712.0% for AGIs $100k-200k, 2042.9% for AGIs over 200k)
Taxable individual retirement arrangement distribution: $16,747 (reported on 10.3% of returns)
06249:
$16,747
Connecticut:
$22,031
(% of AGI for various income ranges: 70.9% for AGIs below $25k, 98.7% for AGIs $25k-50k, 214.6% for AGIs $50k-75k, 257.5% for AGIs $75k-100k, 530.0% for AGIs $100k-200k, 925.7% for AGIs over 200k)
Self-employed (Keogh) retirement plans: $22,100 (reported on 0.8% of returns)
06249:
$22,100
Connecticut:
$29,016
(% of AGI for various income ranges: 122.8% for AGIs $100k-200k)
Total itemized deductions: $24,626 (reported on 10.3% of returns)
Here:
$24,626
State:
$37,613
(% of AGI for various income ranges: 251.1% for AGIs $25k-50k, 335.7% for AGIs $50k-75k, 612.2% for AGIs $75k-100k, 573.7% for AGIs $100k-200k, 1615.7% for AGIs over 200k)
Charity contributions: $3,593 (reported on 7.3% of returns)
Here:
$3,593
State:
$13,557
(% of AGI for various income ranges: 8.0% for AGIs below $25k, 29.1% for AGIs $50k-75k, 34.7% for AGIs $75k-100k, 80.0% for AGIs $100k-200k, 334.3% for AGIs over 200k)
Taxes paid: $8,779 (reported on 10.3% of returns)
06249:
$8,779
State:
$9,096
(% of AGI for various income ranges: 54.5% for AGIs $25k-50k, 122.4% for AGIs $50k-75k, 224.7% for AGIs $75k-100k, 233.1% for AGIs $100k-200k, 578.6% for AGIs over 200k)
Earned income credit: $1,865 (reported on 7.0% of returns)
Here:
$1,865
State:
$2,059
(% of AGI for various income ranges: 47.7% for AGIs below $25k, 39.6% for AGIs $25k-50k)
Percentage of individuals using paid preparers for their 2020 taxes: 93.0%
Here:
93%
State:
93%
(% for various income ranges: 90.4% for AGIs below $25k, 94.3% for AGIs $25k-50k, 95.0% for AGIs $50k-75k, 91.8% for AGIs $75k-100k, 93.3% for AGIs $100k-200k, 94.4% for AGIs over 200k)
Averages for the 2012 tax year for zip code 06249, filed in 2013:
Average Adjusted Gross Income (AGI) in 2012: $65,119 (Individual Income Tax Returns)
Here:
$65,119
State:
$93,290
Salary/wage: $59,138 (reported on 83.1% of returns)
Here:
$59,138
State:
$73,117
(% of AGI for various income ranges: 67.3% for AGIs below $25k, 71.8% for AGIs $25k-50k, 74.6% for AGIs $50k-75k, 75.0% for AGIs $75k-100k, 81.8% for AGIs $100k-200k, 62.2% for AGIs over 200k)
Taxable interest for individuals: $740 (reported on 54.7% of returns)
This zip code:
$740
Connecticut:
$2,530
(% of AGI for various income ranges: 2.2% for AGIs below $25k, 0.6% for AGIs $25k-50k, 0.6% for AGIs $50k-75k, 0.5% for AGIs $75k-100k, 0.4% for AGIs $100k-200k, 0.9% for AGIs over 200k)
Ordinary dividends: $2,592 (reported on 27.5% of returns)
Here:
$2,592
State:
$10,909
(% of AGI for various income ranges: 2.0% for AGIs below $25k, 1.2% for AGIs $25k-50k, 0.7% for AGIs $50k-75k, 1.1% for AGIs $75k-100k, 1.1% for AGIs $100k-200k, 1.2% for AGIs over 200k)
Net capital gain/loss in AGI: +$4,037 (reported on 16.9% of returns)
Here:
+$4,037
State:
+$34,090
(% of AGI for various income ranges: 0.3% for AGIs $50k-75k, 1.0% for AGIs $75k-100k, 0.8% for AGIs $100k-200k, 4.7% for AGIs over 200k)
Profit/loss from business: +$14,398 (reported on 16.0% of returns)
Here:
+$14,398
State:
+$22,741
(% of AGI for various income ranges: 9.0% for AGIs below $25k, 5.1% for AGIs $25k-50k, 4.1% for AGIs $50k-75k, 3.8% for AGIs $75k-100k, 2.2% for AGIs $100k-200k, 3.2% for AGIs over 200k)
Taxable individual retirement arrangement distribution: $12,400 (reported on 10.9% of returns)
06249:
$12,400
Connecticut:
$19,976
(% of AGI for various income ranges: 3.2% for AGIs below $25k, 2.8% for AGIs $25k-50k, 2.4% for AGIs $50k-75k, 2.3% for AGIs $75k-100k, 2.1% for AGIs $100k-200k)
Self-employment retirement plans: $15,933 (reported on 0.9% of returns)
06249:
$15,933
Connecticut:
$24,004
Total itemized deductions: $21,060 (21% of AGI, reported on 49.6% of returns)
Here:
$21,060
State:
$33,239
Here:
21.4% of AGI
State:
18.9% of AGI
(% of AGI for various income ranges: 13.6% for AGIs below $25k, 13.6% for AGIs $25k-50k, 16.9% for AGIs $50k-75k, 17.2% for AGIs $75k-100k, 16.7% for AGIs $100k-200k, 14.0% for AGIs over 200k)
Charity contributions: $2,007 (reported on 39.3% of returns)
Here:
$2,007
State:
$4,947
(% of AGI for various income ranges: 0.7% for AGIs below $25k, 0.8% for AGIs $25k-50k, 1.2% for AGIs $50k-75k, 1.4% for AGIs $75k-100k, 1.3% for AGIs $100k-200k, 1.3% for AGIs over 200k)
Taxes paid: $10,082 (reported on 49.6% of returns)
06249:
$10,082
State:
$17,397
(% of AGI for various income ranges: 3.9% for AGIs below $25k, 5.2% for AGIs $25k-50k, 7.0% for AGIs $50k-75k, 7.8% for AGIs $75k-100k, 8.9% for AGIs $100k-200k, 7.9% for AGIs over 200k)
Earned income credit: $1,672 (reported on 9.2% of returns)
Here:
$1,672
State:
$2,053
(% of AGI for various income ranges: 3.1% for AGIs below $25k, 0.7% for AGIs $25k-50k)
Percentage of individuals using paid preparers for their 2012 taxes: 49.6%
Here:
50%
State:
55%
(% for various income ranges: 41.9% for AGIs below $25k, 51.5% for AGIs $25k-50k, 55.6% for AGIs $50k-75k, 48.9% for AGIs $75k-100k, 53.6% for AGIs $100k-200k, 62.5% for AGIs over 200k)
Averages for the 2004 tax year for zip code 06249, filed in 2005:
Average Adjusted Gross Income (AGI) in 2004: $56,472 (Individual Income Tax Returns)
Here:
$56,472
State:
$73,265
Salary/wage: $51,242 (reported on 84.8% of returns)
Here:
$51,242
State:
$62,030
(% of AGI for various income ranges: 102.8% for AGIs below $10k, 68.3% for AGIs $10k-25k, 77.5% for AGIs $25k-50k, 79.0% for AGIs $50k-75k, 85.0% for AGIs $75k-100k, 71.2% for AGIs over 100k)
Taxable interest for individuals: $1,030 (reported on 64.2% of returns)
This zip code:
$1,030
Connecticut:
$2,287
(% of AGI for various income ranges: 7.2% for AGIs below $10k, 3.0% for AGIs $10k-25k, 1.5% for AGIs $25k-50k, 1.1% for AGIs $50k-75k, 0.7% for AGIs $75k-100k, 1.0% for AGIs over 100k)
Taxable dividends: $1,911 (reported on 30.4% of returns)
Here:
$1,911
State:
$5,735
(% of AGI for various income ranges: 3.0% for AGIs below $10k, 1.5% for AGIs $10k-25k, 0.8% for AGIs $25k-50k, 0.9% for AGIs $50k-75k, 0.7% for AGIs $75k-100k, 1.3% for AGIs over 100k)
Net capital gain/loss: +$8,428 (reported on 22.9% of returns)
Here:
+$8,428
State:
+$23,694
(% of AGI for various income ranges: 2.0% for AGIs below $10k, 1.3% for AGIs $10k-25k, 0.8% for AGIs $25k-50k, 0.6% for AGIs $50k-75k, 1.5% for AGIs $75k-100k, 7.3% for AGIs over 100k)
Profit/loss from business: +$14,144 (reported on 15.3% of returns)
Here:
+$14,144
State:
+$20,783
(% of AGI for various income ranges: -10.0% for AGIs below $10k, 9.1% for AGIs $10k-25k, 5.2% for AGIs $25k-50k, 3.7% for AGIs $50k-75k, 2.7% for AGIs $75k-100k, 3.8% for AGIs over 100k)
IRA payment deduction: $2,937 (reported on 3.3% of returns)
06249:
$2,937
Connecticut:
$3,216
(% of AGI for various income ranges: 0.3% for AGIs $10k-25k, 0.4% for AGIs $25k-50k, 0.2% for AGIs $50k-75k, 0.1% for AGIs $75k-100k, 0.1% for AGIs over 100k)
Self-employed pension: $11,436 (reported on 1.1% of returns)
Here:
$11,436
Connecticut:
$17,335
Total itemized deductions: $17,264 (20% of AGI, reported on 49.6% of returns)
Here:
$17,264
State:
$24,919
Here:
20.1% of AGI
State:
18.6% of AGI
(% of AGI for various income ranges: 17.1% for AGIs below $10k, 13.1% for AGIs $10k-25k, 13.5% for AGIs $25k-50k, 17.8% for AGIs $50k-75k, 17.3% for AGIs $75k-100k, 13.3% for AGIs over 100k)
Charity contributions deductions: $1,735 (2% of AGI, reported on 43.3% of returns)
Here:
$1,735
State:
$3,762
Here:
1.9% of AGI
State:
2.7% of AGI
(% of AGI for various income ranges: 0.5% for AGIs below $10k, 0.6% for AGIs $10k-25k, 1.1% for AGIs $25k-50k, 1.5% for AGIs $50k-75k, 1.4% for AGIs $75k-100k, 1.4% for AGIs over 100k)
Total tax: $7,746 (reported on 83.9% of returns)
06249:
$7,746
State:
$15,148
(% of AGI for various income ranges: 2.7% for AGIs below $10k, 5.4% for AGIs $10k-25k, 7.8% for AGIs $25k-50k, 9.1% for AGIs $50k-75k, 10.4% for AGIs $75k-100k, 15.9% for AGIs over 100k)
Earned income credit: $1,515 (reported on 5.8% of returns)
Here:
$1,515
State:
$1,570
Percentage of individuals using paid preparers for their 2004 taxes: 52.5%
Here:
52%
State:
59%
(% for various income ranges: 38.9% for AGIs below $10k, 50.2% for AGIs $10k-25k, 55.3% for AGIs $25k-50k, 57.5% for AGIs $50k-75k, 55.0% for AGIs $75k-100k, 57.0% for AGIs over 100k)
Household received Food Stamps/SNAP in the past 12 months: 49 Household did not receive Food Stamps/SNAP in the past 12 months: 2,778
Women who had a birth in the past 12 months: 74 (57 now married, 15 unmarried) Women who did not have a birth in the past 12 months: 1,460 (699 now married, 747 unmarried)
Housing units in zip code 06249 with a mortgage: 1,681 (194 second mortgage, 27 home equity loan, 150 both second mortgage and home equity loan) Houses without a mortgage: 175
Median monthly owner costs for units with a mortgage: $1,956 Median monthly owner costs for units without a mortgage: $865
Residents with income below the poverty level in 2022:
This zip code:
4.4%
Whole state:
9.8%
Residents with income below 50% of the poverty level in 2022:
This zip code:
3.0%
Whole state:
4.8%
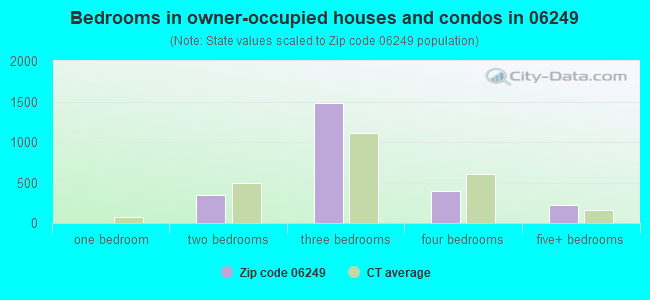
Median number of rooms in houses and condos:
Here:
6.8
State:
6.5
Median number of rooms in apartments:
Here:
4.5
State:
4.0
Notable locations in this zip code not listed on our city pages
Notable locations in zip code 06249: Waters Edge Campground (A), Fresh Air Camp (B), Chestnut Hill (C), Camp Mooween (D), Lebanon Country Club (E), Lebanon Fire Department Station 6 (F), Lebanon Town Hall (G), Jonathan Trumbull Library (H), Jonathan Trumbull House (I), Beaumont House (J), Guilford Smith Memorial Library (K), John Trumbull Birthplace (L). Display/hide their locations on the map
Churches in zip code 06249 include: Goshen Church (A), First Baptist Church (B), First Congregational Church (C), Redeemer Lutheran Church (D). Display/hide their locations on the map
Lakes, reservoirs, and swamps: Stiles Pond (A), Graves Pond (B), Savin Lake (C), Lockes Pond (D), Pitchers Pond (E), Brewster Pond (F), Mathiew Pond (G), Hayward Pond (H). Display/hide their locations on the map
Streams, rivers, and creeks: Willimantic River (A), Pigeon Swamp Brook (B), Sherman Brook (C), Spinning Mill Brook (D), Bartlett Brook (E), Brousseous Brook (F), Burgess Brook (G), Deep River (H), Waterman Brook (I). Display/hide their locations on the map
Parks in zip code 06249 include: South Ridge Park (1), Lebanon Green Historic District (2), Lebanon Town Common (3), Pomeroy State Park (4), Trumbull Park (5). Display/hide their locations on the map
In group quarters: 45 (-1 institutionalized population)
Size of family households: 867 2-persons, 581 3-persons, 294 4-persons, 139 5-persons, 59 6-persons
Size of nonfamily households: 596 1-person, 298 2-persons
953 married couples with children.
281 single-parent households (281 women).
93.5% of residents of 06249 zip code speak English at home.
2.3% of residents speak Spanish at home (98% very well, 2% not well).
2.1% of residents speak other Indo-European language at home (77% very well, 23% well).
0.8% of residents speak Asian or Pacific Island language at home (49% very well, 32% well, 19% not well).
0.5% of residents speak other language at home (100% very well).
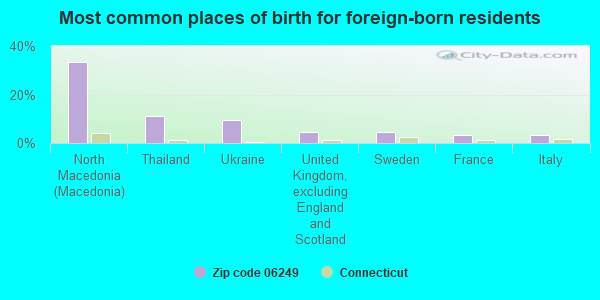
Foreign born population: 411 (5.7%) (97.5% of them are naturalized citizens)
This zip code:
5.7%
Whole state:
15.7%
33%North Macedonia (Macedonia)
11%Thailand
9%Ukraine
5%United Kingdom, excluding England and Scotland
4%Sweden
3%France
3%Italy
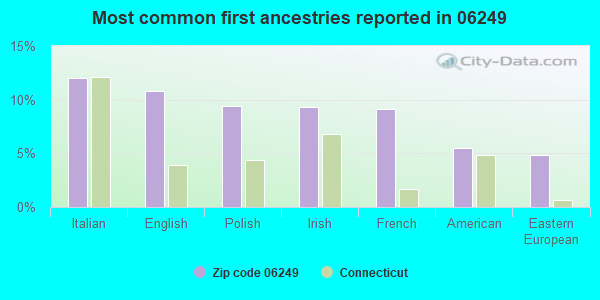
12%Italian
11%English
9%Polish
9%Irish
9%French
5%American
5%Eastern European
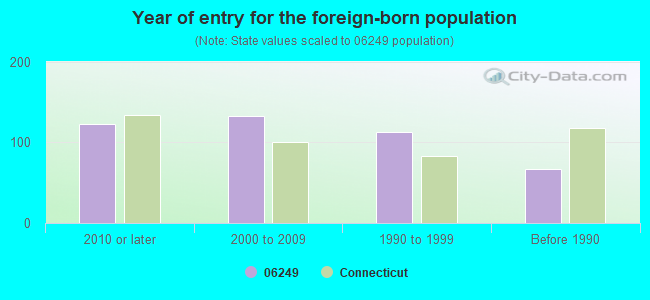
Year of entry for the foreign-born population
1232010 or later
1332000 to 2009
1131990 to 1999
67Before 1990
Facilities with environmental interests located in this zip code:
EARTH GRO INC/THE SCOTT'S CO (INDUSTRIAL PARK RD in LEBANON, CT)
ENFORCEMENT/COMPLIANCE ACTIVITY (Integrated Compliance Information System) - ICIS-HQ-2001-4003, FORMAL ENFORCEMENT ACTION (Integrated Compliance Information System) - ICIS-HQ-2001-4003, FORMAL ENFORCEMENT ACTION COMPLIANCE ACTIVITY (Tracking inspections of insecticide, fungicide, and rodenticide, and toxic substances) CRITERIA AND HAZARDOUS AIR POLLUTANT INVENTORY (Inventory of air pollution sources) Business SIC classification: FERTILIZERS, MIXING ONLY; NONCLASSIFIABLE ESTABLISHMENTS Alternative names: EARTHGRO, INC, SCOTTS CO THE
HOMEBOUND (891 EXETER ROAD in LEBANON, CT)
(National Center for Education Statistics) - STATE ID-88 Organizations: LEBANON SCHOOL DISTRICT (SCHOOL DISTRICT)
HYPONEX CORPORATION (20 INDUSTRIAL PARK ROAD in LEBANON, CT)
National Pollutant Discharge Elimination System NON-MAJOR (Tracking pollutant discharge elimination systems) - permit Business SIC classification: SOIL PREPARATION SERVICES
COOMBS RESIDENCE (376 LEBANON RD in LEBANON, CT)
COMPLIANCE ACTIVITY (Tracking inspections of insecticide, fungicide, and rodenticide, and toxic substances)
Housing units lacking complete plumbing facilities: 4.4% Housing units lacking complete kitchen facilities: 2.6%
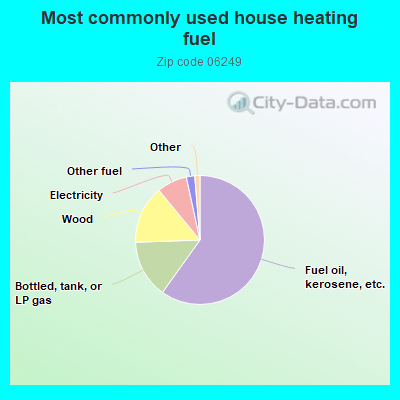
60.0%Fuel oil, kerosene, etc.
14.6%Bottled, tank, or LP gas
14.6%Wood
7.6%Electricity
2.1%Other fuel
0.7%Solar energy
0.6%Utility gas
Population in 1990: 6,043. Population change in the 1990s: +864 (+14.3%).
Place of birth for U.S.-born residents:
This state: 4,942
Northeast: 1,369
Midwest: 88
South: 162
West: 113
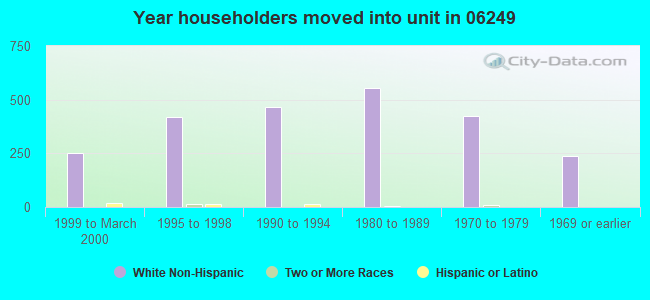
68% of the 06249 zip code residents lived in the same house 5 years ago. Out of people who lived in different houses, 41% lived in this county. Out of people who lived in different counties, 50% lived in Connecticut.
97% of the 06249 zip code residents lived in the same house 1 year ago. Out of people who lived in different houses, 65% moved from this county. Out of people who lived in different houses, 37% moved from different state.
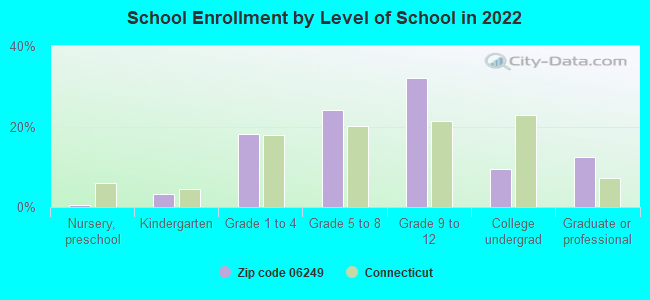
Private vs. public school enrollment:
Students in private schools in grades 1 to 8 (elementary and middle school):
Here:
0.1%
Connecticut:
9.5%
Students in private schools in grades 9 to 12 (high school):
Here:
0.0%
Connecticut:
12.9%
Students in private undergraduate colleges: 21
Here:
16.6%
Connecticut:
35.5%
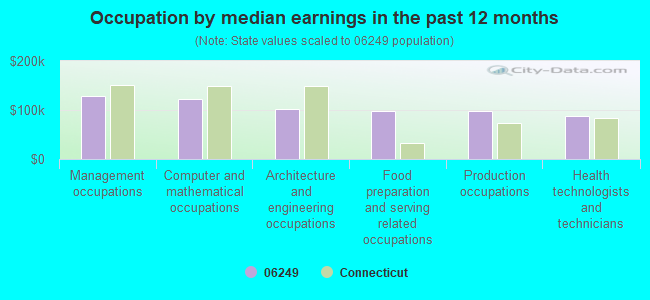
Occupation by median earnings in the past 12 months ($)
129,220Management occupations
121,921Computer and mathematical occupations
102,141Architecture and engineering occupations
98,565Food preparation and serving related occupations
97,322Production occupations
88,186Health technologists and technicians
Companies with federal contracts located in this zip code:
KROPP ENVIRONMENTAL CONTRACTOR (32 EXETER ROAD in LEBANON, CT; small business) : $20,000 in 2 contractsfrom 1999 to 2003
$20,000 with United States Coast Guard (disused code: now 7008) for Maintenance, Repair or Alteration of Real Property -- Other Administrative Facilities and Service Buildings. Signed on 1999-12-15. Completion date: 2000-03-15.
$0 with Navy for Maintenance, Repair and Rebuilding of Equipment -- Ship and Marine Equipment. Signed on 2003-03-03. Completion date: 2004-03-02.
Top industries in this zip code by the number of employees in 2005:
Health Care and Social Assistance: Residential Mental Health and Substance Abuse Facilities (20-49 employees: 1 establishment)
Accommodation and Food Services: Full-Service Restaurants (20-49: 1)
Administrative and Support and Waste Management and Remediation Services: Landscaping Services (5-9: 1, 1-4: 6)
Construction: Site Preparation Contractors (5-9: 1, 1-4: 5)
Management of Companies and Enterprises: Corporate, Subsidiary, and Regional Managing Offices (10-19: 1)
Wholesale Trade: Piece Goods, Notions, and Other Dry Goods Merchant Wholesalers (10-19: 1)
Professional, Scientific, and Technical Services: Computer Systems Design Services (10-19: 1)
Health Care and Social Assistance: Residential Mental Retardation Facilities (10-19: 1)
People in group quarters in 2010:
83 people in residential treatment centers for adults
26 people in group homes intended for adults
2 people in group homes for juveniles (non-correctional)
People in group quarters in 2000:
121 people in hospitals or wards for drug/alcohol abuse
20 people in homes for the mentally retarded
Fatal accident statistics in 2014:
Fatal accident count: 1
Vehicles involved in fatal accidents: 1
Fatal accidents caused by drunken drivers: 1
Fatalities: 1
Persons involved in fatal accidents: 1
Pedestrians involved in fatal accidents: 0
Fatal accident statistics in 2012:
Fatal accident count: 2
Vehicles involved in fatal accidents: 2
Fatal accidents caused by drunken drivers: 0
Fatalities: 2
Persons involved in fatal accidents: 2
Pedestrians involved in fatal accidents: 0
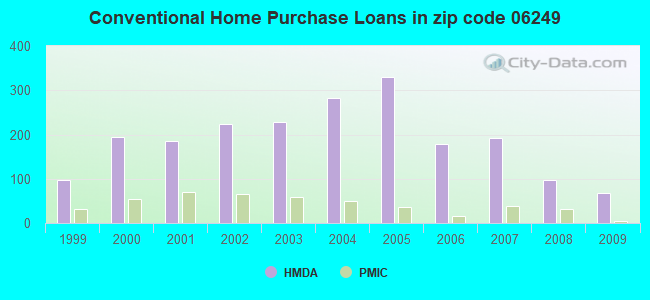
Home Mortgage Disclosure Act Aggregated Statistics For Year 2009 (Based on 2 full tracts)
A) FHA, FSA/RHS & VA Home Purchase Loans
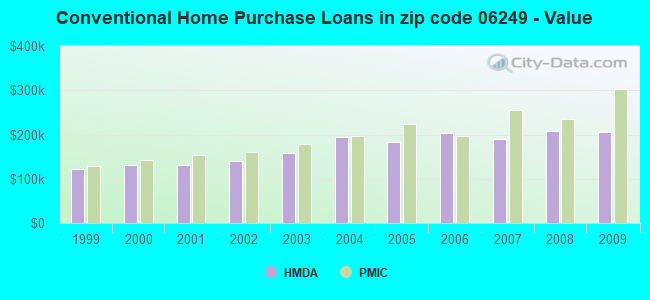
B) Conventional Home Purchase Loans
C) Refinancings
D) Home Improvement Loans
F) Non-occupant Loans on < 5 Family Dwellings (A B C & D)
G) Loans On Manufactured Home Dwelling (A B C & D)
Number
Average Value
Number
Average Value
Number
Average Value
Number
Average Value
Number
Average Value
Number
Average Value
LOANS ORIGINATED
52
$226,411
68
$206,696
458
$191,919
88
$78,656
20
$86,722
0
$0
APPLICATIONS APPROVED, NOT ACCEPTED
2
$149,865
4
$188,830
30
$178,839
0
$0
0
$0
0
$0
APPLICATIONS DENIED
6
$202,152
12
$125,054
134
$221,025
36
$69,992
10
$104,706
4
$29,972
APPLICATIONS WITHDRAWN
6
$315,715
6
$254,770
72
$234,733
6
$80,593
4
$89,420
0
$0
FILES CLOSED FOR INCOMPLETENESS
0
$0
0
$0
20
$235,388
2
$14,985
2
$199,820
0
$0
Aggregated Statistics For Year 2008 (Based on 2 full tracts)
A) FHA, FSA/RHS & VA Home Purchase Loans
B) Conventional Home Purchase Loans
C) Refinancings
D) Home Improvement Loans
F) Non-occupant Loans on < 5 Family Dwellings (A B C & D)
G) Loans On Manufactured Home Dwelling (A B C & D)
Number
Average Value
Number
Average Value
Number
Average Value
Number
Average Value
Number
Average Value
Number
Average Value
LOANS ORIGINATED
38
$243,886
98
$208,221
276
$182,321
102
$69,996
22
$168,030
0
$0
APPLICATIONS APPROVED, NOT ACCEPTED
0
$0
12
$265,761
34
$217,686
12
$41,629
2
$249,775
0
$0
APPLICATIONS DENIED
10
$262,563
34
$232,614
130
$179,346
40
$72,784
14
$217,090
6
$75,932
APPLICATIONS WITHDRAWN
0
$0
12
$171,179
66
$219,106
8
$151,614
4
$311,220
0
$0
FILES CLOSED FOR INCOMPLETENESS
2
$200,820
2
$83,925
6
$227,462
2
$387,650
2
$83,925
0
$0
Aggregated Statistics For Year 2007 (Based on 2 full tracts)
A) FHA, FSA/RHS & VA Home Purchase Loans
B) Conventional Home Purchase Loans
C) Refinancings
D) Home Improvement Loans
F) Non-occupant Loans on < 5 Family Dwellings (A B C & D)
G) Loans On Manufactured Home Dwelling (A B C & D)
Number
Average Value
Number
Average Value
Number
Average Value
Number
Average Value
Number
Average Value
Number
Average Value
LOANS ORIGINATED
14
$219,659
192
$190,183
332
$158,032
176
$100,943
28
$137,947
2
$153,860
APPLICATIONS APPROVED, NOT ACCEPTED
4
$205,315
26
$206,890
70
$195,881
6
$109,902
4
$189,830
0
$0
APPLICATIONS DENIED
2
$254,770
28
$169,062
186
$230,545
74
$68,830
8
$115,146
2
$29,975
APPLICATIONS WITHDRAWN
4
$223,300
20
$158,757
132
$213,278
24
$65,524
8
$184,584
0
$0
FILES CLOSED FOR INCOMPLETENESS
0
$0
6
$173,177
32
$200,757
0
$0
2
$205,815
0
$0
Aggregated Statistics For Year 2006 (Based on 2 full tracts)
A) FHA, FSA/RHS & VA Home Purchase Loans
B) Conventional Home Purchase Loans
C) Refinancings
D) Home Improvement Loans
F) Non-occupant Loans on < 5 Family Dwellings (A B C & D)
G) Loans On Manufactured Home Dwelling (A B C & D)
Number
Average Value
Number
Average Value
Number
Average Value
Number
Average Value
Number
Average Value
Number
Average Value
LOANS ORIGINATED
24
$232,374
178
$204,198
406
$165,806
156
$67,849
38
$160,697
0
$0
APPLICATIONS APPROVED, NOT ACCEPTED
2
$161,855
36
$151,253
54
$159,930
16
$74,058
8
$165,850
0
$0
APPLICATIONS DENIED
0
$0
24
$226,462
174
$163,623
62
$67,391
10
$216,205
2
$71,935
APPLICATIONS WITHDRAWN
2
$151,865
22
$146,050
206
$160,283
12
$62,777
2
$108,900
0
$0
FILES CLOSED FOR INCOMPLETENESS
2
$149,865
4
$86,922
30
$227,795
4
$117,395
2
$9,990
0
$0
Aggregated Statistics For Year 2005 (Based on 2 full tracts)
A) FHA, FSA/RHS & VA Home Purchase Loans
B) Conventional Home Purchase Loans
C) Refinancings
D) Home Improvement Loans
E) Loans on Dwellings For 5+ Families
F) Non-occupant Loans on < 5 Family Dwellings (A B C & D)
G) Loans On Manufactured Home Dwelling (A B C & D)
Number
Average Value
Number
Average Value
Number
Average Value
Number
Average Value
Number
Average Value
Number
Average Value
Number
Average Value
LOANS ORIGINATED
10
$170,846
330
$182,405
492
$159,986
114
$73,846
2
$95,915
44
$117,303
2
$102,905
APPLICATIONS APPROVED, NOT ACCEPTED
4
$186,832
38
$224,903
64
$164,914
6
$48,957
0
$0
8
$122,889
0
$0
APPLICATIONS DENIED
2
$183,835
62
$174,843
222
$174,284
44
$76,931
0
$0
12
$96,247
2
$136,875
APPLICATIONS WITHDRAWN
0
$0
52
$201,780
282
$168,203
20
$177,840
0
$0
8
$155,860
0
$0
FILES CLOSED FOR INCOMPLETENESS
0
$0
26
$118,739
30
$178,439
10
$103,507
0
$0
6
$96,913
0
$0
Aggregated Statistics For Year 2004 (Based on 2 full tracts)
A) FHA, FSA/RHS & VA Home Purchase Loans
B) Conventional Home Purchase Loans
C) Refinancings
D) Home Improvement Loans
E) Loans on Dwellings For 5+ Families
F) Non-occupant Loans on < 5 Family Dwellings (A B C & D)
G) Loans On Manufactured Home Dwelling (A B C & D)
Number
Average Value
Number
Average Value
Number
Average Value
Number
Average Value
Number
Average Value
Number
Average Value
Number
Average Value
LOANS ORIGINATED
24
$141,706
282
$194,683
514
$139,858
142
$52,206
0
$0
42
$105,524
2
$179,840
APPLICATIONS APPROVED, NOT ACCEPTED
0
$0
32
$162,853
106
$154,559
16
$63,193
0
$0
4
$97,412
0
$0
APPLICATIONS DENIED
0
$0
42
$181,694
198
$162,258
76
$24,320
0
$0
28
$109,045
0
$0
APPLICATIONS WITHDRAWN
4
$190,828
26
$223,030
228
$151,688
22
$57,766
2
$139,875
0
$0
0
$0
FILES CLOSED FOR INCOMPLETENESS
0
$0
6
$225,463
44
$154,906
4
$36,968
0
$0
0
$0
0
$0
Aggregated Statistics For Year 2003 (Based on 2 full tracts)
A) FHA, FSA/RHS & VA Home Purchase Loans
B) Conventional Home Purchase Loans
C) Refinancings
D) Home Improvement Loans
F) Non-occupant Loans on < 5 Family Dwellings (A B C & D)
Number
Average Value
Number
Average Value
Number
Average Value
Number
Average Value
Number
Average Value
LOANS ORIGINATED
22
$136,695
228
$157,209
1,101
$131,723
110
$29,355
56
$93,380
APPLICATIONS APPROVED, NOT ACCEPTED
0
$0
36
$159,634
118
$127,902
18
$40,297
6
$92,917
APPLICATIONS DENIED
0
$0
28
$183,763
278
$134,663
54
$25,348
2
$99,910
APPLICATIONS WITHDRAWN
0
$0
24
$190,828
254
$134,753
12
$43,627
14
$101,194
FILES CLOSED FOR INCOMPLETENESS
0
$0
2
$115,895
22
$110,355
2
$24,975
2
$75,930
Aggregated Statistics For Year 2002 (Based on 2 full tracts)
A) FHA, FSA/RHS & VA Home Purchase Loans
B) Conventional Home Purchase Loans
C) Refinancings
D) Home Improvement Loans
E) Loans on Dwellings For 5+ Families
F) Non-occupant Loans on < 5 Family Dwellings (A B C & D)
Number
Average Value
Number
Average Value
Number
Average Value
Number
Average Value
Number
Average Value
Number
Average Value
LOANS ORIGINATED
30
$154,527
224
$139,945
591
$187,314
108
$28,215
2
$409,630
30
$57,415
APPLICATIONS APPROVED, NOT ACCEPTED
0
$0
22
$138,966
92
$96,761
14
$44,674
0
$0
4
$73,932
APPLICATIONS DENIED
2
$164,850
26
$140,489
132
$98,184
20
$24,078
0
$0
10
$107,703
APPLICATIONS WITHDRAWN
0
$0
20
$168,948
184
$117,003
12
$65,608
0
$0
4
$83,925
FILES CLOSED FOR INCOMPLETENESS
2
$189,830
6
$131,882
6
$106,570
0
$0
0
$0
0
$0
Aggregated Statistics For Year 2001 (Based on 2 full tracts)
A) FHA, FSA/RHS & VA Home Purchase Loans
B) Conventional Home Purchase Loans
C) Refinancings
D) Home Improvement Loans
F) Non-occupant Loans on < 5 Family Dwellings (A B C & D)
Number
Average Value
Number
Average Value
Number
Average Value
Number
Average Value
Number
Average Value
LOANS ORIGINATED
22
$136,059
186
$130,399
458
$114,569
112
$31,168
28
$69,866
APPLICATIONS APPROVED, NOT ACCEPTED
0
$0
14
$115,610
66
$98,760
12
$33,303
2
$71,935
APPLICATIONS DENIED
0
$0
18
$79,373
140
$93,202
50
$29,014
6
$68,938
APPLICATIONS WITHDRAWN
0
$0
12
$98,245
136
$108,402
20
$75,532
10
$76,331
FILES CLOSED FOR INCOMPLETENESS
0
$0
0
$0
22
$88,466
2
$41,960
0
$0
Aggregated Statistics For Year 2000 (Based on 2 full tracts)
A) FHA, FSA/RHS & VA Home Purchase Loans
B) Conventional Home Purchase Loans
C) Refinancings
D) Home Improvement Loans
F) Non-occupant Loans on < 5 Family Dwellings (A B C & D)
Number
Average Value
Number
Average Value
Number
Average Value
Number
Average Value
Number
Average Value
LOANS ORIGINATED
28
$106,048
194
$131,006
124
$83,006
88
$28,293
18
$89,475
APPLICATIONS APPROVED, NOT ACCEPTED
0
$0
22
$122,889
26
$76,162
20
$43,061
2
$51,955
APPLICATIONS DENIED
4
$108,402
26
$128,192
82
$90,041
30
$49,422
0
$0
APPLICATIONS WITHDRAWN
0
$0
20
$136,577
102
$78,106
18
$54,507
0
$0
FILES CLOSED FOR INCOMPLETENESS
0
$0
0
$0
8
$84,674
4
$24,478
0
$0
Aggregated Statistics For Year 1999 (Based on 1 full tract)
A) FHA, FSA/RHS & VA Home Purchase Loans
B) Conventional Home Purchase Loans
C) Refinancings
D) Home Improvement Loans
F) Non-occupant Loans on < 5 Family Dwellings (A B C & D)
Detailed PMIC statistics for the following Tracts:8701.00
2002 - 2018 National Fire Incident Reporting System (NFIRS) incidents
According to the data from the years 2002 - 2018 the average number of fire incidents per year is 37. The highest number of reported fires - 66 took place in 2003, and the least - 17 in 2017. The data has a declining trend.
When looking into fire subcategories, the most reports belonged to: Structure Fires (63.7%), and Outside Fires (18.8%).
Fire incident types reported to NFIRS in Zip Code 06249


 Nearest zip codes: 06336, 06266, 06226, 06237, 06254, 06334.


 According to the data from the years 2002 - 2018 the average number of fire incidents per year is 37. The highest number of reported fires - 66 took place in 2003, and the least - 17 in 2017. The data has a declining trend.
 When looking into fire subcategories, the most reports belonged to: Structure Fires (63.7%), and Outside Fires (18.8%).