Estimated zip code population in 2022: 5,587 Zip code population in 2010: 5,273 Zip code population in 2000: 5,738
Houses and condos: 2,001 Renter-occupied apartments: 70
% of renters here:
4%
State:
38%
March 2022 cost of living index in zip code 02468: 132.6 (high, U.S. average is 100)
Land area: 1.5 sq. mi. Water area: 0.0 sq. mi.
Population density: 3,775 people per square mile
(average).
OSM Map
Google Map
MSN Map
OSM Map
General Map
Google Map
MSN Map
OSM Map
Google Map
MSN Map
OSM Map
Google Map
MSN Map
Please wait while loading the map...
Real estate property taxes paid for housing units in 2022:
This zip code:
0.5% ($9,915)
Massachusetts:
1.0% ($5,536)
Median real estate property taxes paid for housing units with mortgages in 2022: $9,911 (0.5%) Median real estate property taxes paid for housing units with no mortgage in 2022: $9,925 (0.6%)
Business Search- 14 Million verified businesses
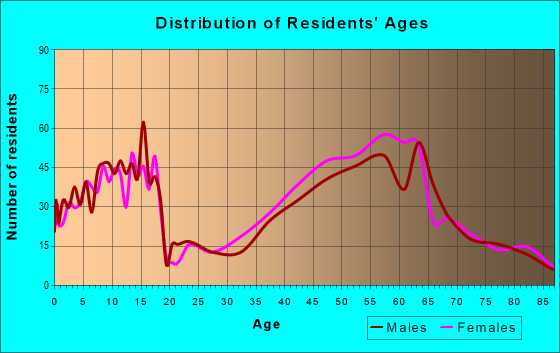
Males: 2,618
(46.9%)
Females: 2,969
(53.1%)
For population 25 years and over in 02468:
High school or higher: 99.7%
Bachelor's degree or higher: 91.7%
Graduate or professional degree: 64.4%
Unemployed: 4.1%
Mean travel time to work (commute): 28.3 minutes
For population 15 years and over in 02468:
Never married: 17.1%
Now married: 76.7%
Separated: 0.0%
Widowed: 2.5%
Divorced: 3.6%
Zip code 02468 compared to state average:
Median household income significantly above state average.
Median house value significantly above state average.
Black race population percentage significantly below state average.
Hispanic race population percentage significantly below state average.
Median age above state average.
Renting percentage significantly below state average.
Length of stay since moving in above state average.
Number of rooms per house significantly above state average.
Number of college students below state average.
Percentage of population with a bachelor's degree or higher above state average.
Estimated median house/condo value in 2022: $1,833,273
02468:
$1,833,273
Massachusetts:
$534,700
Median resident age:
This zip code:
47.7 years
Massachusetts median age:
40.3 years
Average household size:
This zip code:
2.7 people
Massachusetts:
2.4 people
Averages for the 2020 tax year for zip code 02468, filed in 2021:
Average Adjusted Gross Income (AGI) in 2020: $433,452 (Individual Income Tax Returns)
Here:
$433,452
State:
$105,130
Salary/wage: $295,380 (reported on 75.6% of returns)
Here:
$295,380
State:
$82,951
(% of AGI for various income ranges: 1211.4% for AGIs below $25k, 4152.7% for AGIs $25k-50k, 7156.2% for AGIs $50k-75k, 10640.0% for AGIs $75k-100k, 19460.7% for AGIs $100k-200k, 200045.4% for AGIs over 200k)
Taxable interest for individuals: $8,800 (reported on 70.8% of returns)
This zip code:
$8,800
Massachusetts:
$2,361
(% of AGI for various income ranges: 90.5% for AGIs below $25k, 183.6% for AGIs $25k-50k, 448.8% for AGIs $50k-75k, 438.0% for AGIs $75k-100k, 662.9% for AGIs $100k-200k, 5356.4% for AGIs over 200k)
Ordinary dividends: $32,455 (reported on 69.4% of returns)
Here:
$32,455
State:
$10,365
(% of AGI for various income ranges: 267.1% for AGIs below $25k, 434.5% for AGIs $25k-50k, 1007.5% for AGIs $50k-75k, 1726.0% for AGIs $75k-100k, 3015.0% for AGIs $100k-200k, 19316.4% for AGIs over 200k)
Net capital gain/loss in AGI: +$155,733 (reported on 64.2% of returns)
Here:
+$155,733
State:
+$48,178
(% of AGI for various income ranges: 199.5% for AGIs below $25k, 278.2% for AGIs $25k-50k, 567.5% for AGIs $50k-75k, 1192.0% for AGIs $75k-100k, 3025.0% for AGIs $100k-200k, 94630.4% for AGIs over 200k)
Profit/loss from business: +$54,241 (reported on 29.9% of returns)
Here:
+$54,241
State:
+$20,792
(% of AGI for various income ranges: 171.9% for AGIs below $25k, 202.7% for AGIs $25k-50k, 721.2% for AGIs $50k-75k, 1746.0% for AGIs $75k-100k, 3263.6% for AGIs $100k-200k, 13332.9% for AGIs over 200k)
Taxable individual retirement arrangement distribution: $40,605 (reported on 15.5% of returns)
02468:
$40,605
Massachusetts:
$22,790
(% of AGI for various income ranges: 142.4% for AGIs below $25k, 452.5% for AGIs $50k-75k, 1136.0% for AGIs $75k-100k, 2349.3% for AGIs $100k-200k, 4477.1% for AGIs over 200k)
Self-employed (Keogh) retirement plans: $34,062 (reported on 8.9% of returns)
02468:
$34,062
Massachusetts:
$26,868
(% of AGI for various income ranges: 425.0% for AGIs $100k-200k, 2707.1% for AGIs over 200k)
Total itemized deductions: $58,793 (reported on 39.9% of returns)
Here:
$58,793
State:
$36,722
(% of AGI for various income ranges: 385.7% for AGIs below $25k, 1209.1% for AGIs $25k-50k, 1298.8% for AGIs $50k-75k, 2058.0% for AGIs $75k-100k, 3532.9% for AGIs $100k-200k, 19407.9% for AGIs over 200k)
Charity contributions: $25,800 (reported on 35.1% of returns)
Here:
$25,800
State:
$12,529
(% of AGI for various income ranges: 46.7% for AGIs below $25k, 91.2% for AGIs $50k-75k, 190.0% for AGIs $75k-100k, 582.1% for AGIs $100k-200k, 8367.5% for AGIs over 200k)
Taxes paid: $9,781 (reported on 39.5% of returns)
02468:
$9,781
State:
$8,782
(% of AGI for various income ranges: 94.3% for AGIs below $25k, 185.5% for AGIs $25k-50k, 386.2% for AGIs $50k-75k, 654.0% for AGIs $75k-100k, 915.0% for AGIs $100k-200k, 2909.6% for AGIs over 200k)
Earned income credit: $780 (reported on 1.8% of returns)
Here:
$780
State:
$1,909
(% of AGI for various income ranges: 18.6% for AGIs below $25k)
Percentage of individuals using paid preparers for their 2020 taxes: 91.1%
Here:
91%
State:
92%
(% for various income ranges: 89.1% for AGIs below $25k, 94.7% for AGIs $25k-50k, 82.4% for AGIs $50k-75k, 91.7% for AGIs $75k-100k, 89.2% for AGIs $100k-200k, 93.1% for AGIs over 200k)
Averages for the 2012 tax year for zip code 02468, filed in 2013:
Average Adjusted Gross Income (AGI) in 2012: $298,440 (Individual Income Tax Returns)
Here:
$298,440
State:
$81,425
Salary/wage: $196,893 (reported on 76.6% of returns)
Here:
$196,893
State:
$64,752
(% of AGI for various income ranges: 61.1% for AGIs below $25k, 61.4% for AGIs $25k-50k, 50.4% for AGIs $50k-75k, 46.5% for AGIs $75k-100k, 60.9% for AGIs $100k-200k, 49.4% for AGIs over 200k)
Taxable interest for individuals: $6,938 (reported on 73.2% of returns)
This zip code:
$6,938
Massachusetts:
$2,136
(% of AGI for various income ranges: 3.5% for AGIs below $25k, 3.5% for AGIs $25k-50k, 1.4% for AGIs $50k-75k, 3.0% for AGIs $75k-100k, 1.3% for AGIs $100k-200k, 1.7% for AGIs over 200k)
Ordinary dividends: $26,578 (reported on 68.6% of returns)
Here:
$26,578
State:
$9,473
(% of AGI for various income ranges: 14.7% for AGIs below $25k, 7.3% for AGIs $25k-50k, 6.7% for AGIs $50k-75k, 9.7% for AGIs $75k-100k, 5.4% for AGIs $100k-200k, 6.0% for AGIs over 200k)
Net capital gain/loss in AGI: +$80,670 (reported on 62.8% of returns)
Here:
+$80,670
State:
+$31,437
(% of AGI for various income ranges: 2.8% for AGIs below $25k, 3.4% for AGIs $25k-50k, 3.8% for AGIs $50k-75k, 2.5% for AGIs $75k-100k, 4.1% for AGIs $100k-200k, 19.0% for AGIs over 200k)
Profit/loss from business: +$62,637 (reported on 29.9% of returns)
Here:
+$62,637
State:
+$20,662
(% of AGI for various income ranges: 8.5% for AGIs below $25k, 10.9% for AGIs $25k-50k, 12.4% for AGIs $50k-75k, 6.5% for AGIs $75k-100k, 12.1% for AGIs $100k-200k, 5.5% for AGIs over 200k)
Taxable individual retirement arrangement distribution: $45,169 (reported on 18.4% of returns)
02468:
$45,169
Massachusetts:
$18,892
(% of AGI for various income ranges: 2.9% for AGIs below $25k, 5.0% for AGIs $25k-50k, 8.1% for AGIs $50k-75k, 7.7% for AGIs $75k-100k, 5.8% for AGIs $100k-200k, 2.3% for AGIs over 200k)
Self-employment retirement plans: $29,690 (reported on 11.1% of returns)
02468:
$29,690
Massachusetts:
$20,669
Total itemized deductions: $64,262 (15% of AGI, reported on 69.0% of returns)
Here:
$64,262
State:
$28,907
Here:
15.4% of AGI
State:
18.2% of AGI
(% of AGI for various income ranges: 40.3% for AGIs below $25k, 28.2% for AGIs $25k-50k, 26.7% for AGIs $50k-75k, 22.9% for AGIs $75k-100k, 21.7% for AGIs $100k-200k, 13.5% for AGIs over 200k)
Charity contributions: $12,337 (reported on 62.5% of returns)
Here:
$12,337
State:
$4,208
(% of AGI for various income ranges: 1.3% for AGIs below $25k, 1.7% for AGIs $25k-50k, 2.0% for AGIs $50k-75k, 1.3% for AGIs $75k-100k, 2.1% for AGIs $100k-200k, 2.7% for AGIs over 200k)
Taxes paid: $33,564 (reported on 68.6% of returns)
02468:
$33,564
State:
$13,303
(% of AGI for various income ranges: 9.0% for AGIs below $25k, 9.1% for AGIs $25k-50k, 9.8% for AGIs $50k-75k, 10.0% for AGIs $75k-100k, 10.7% for AGIs $100k-200k, 7.3% for AGIs over 200k)
Earned income credit: $1,175 (reported on 3.1% of returns)
Here:
$1,175
State:
$1,971
(% of AGI for various income ranges: 1.7% for AGIs below $25k)
Percentage of individuals using paid preparers for their 2012 taxes: 67.0%
Here:
67%
State:
56%
(% for various income ranges: 59.7% for AGIs below $25k, 58.3% for AGIs $25k-50k, 64.3% for AGIs $50k-75k, 64.3% for AGIs $75k-100k, 64.4% for AGIs $100k-200k, 75.5% for AGIs over 200k)
Averages for the 2004 tax year for zip code 02468, filed in 2005:
Average Adjusted Gross Income (AGI) in 2004: $175,041 (Individual Income Tax Returns)
Here:
$175,041
State:
$62,877
Salary/wage: $142,125 (reported on 70.9% of returns)
Here:
$142,125
State:
$52,969
(% of AGI for various income ranges: 72.9% for AGIs below $10k, 57.4% for AGIs $10k-25k, 57.9% for AGIs $25k-50k, 54.7% for AGIs $50k-75k, 60.3% for AGIs $75k-100k, 57.5% for AGIs over 100k)
Taxable interest for individuals: $5,096 (reported on 79.9% of returns)
This zip code:
$5,096
Massachusetts:
$1,945
(% of AGI for various income ranges: 21.6% for AGIs below $10k, 5.7% for AGIs $10k-25k, 5.9% for AGIs $25k-50k, 3.6% for AGIs $50k-75k, 2.7% for AGIs $75k-100k, 2.1% for AGIs over 100k)
Taxable dividends: $8,649 (reported on 74.8% of returns)
Here:
$8,649
State:
$5,323
(% of AGI for various income ranges: 47.0% for AGIs below $10k, 11.9% for AGIs $10k-25k, 6.5% for AGIs $25k-50k, 5.2% for AGIs $50k-75k, 5.9% for AGIs $75k-100k, 3.3% for AGIs over 100k)
Net capital gain/loss: +$26,866 (reported on 69.2% of returns)
Here:
+$26,866
State:
+$20,377
(% of AGI for various income ranges: -45.9% for AGIs below $10k, 10.4% for AGIs $10k-25k, 4.4% for AGIs $25k-50k, 4.5% for AGIs $50k-75k, 3.6% for AGIs $75k-100k, 11.3% for AGIs over 100k)
Profit/loss from business: +$45,533 (reported on 26.3% of returns)
Here:
+$45,533
State:
+$17,837
(% of AGI for various income ranges: 4.2% for AGIs below $10k, 4.8% for AGIs $10k-25k, 6.7% for AGIs $25k-50k, 9.6% for AGIs $50k-75k, 10.2% for AGIs $75k-100k, 6.7% for AGIs over 100k)
IRA payment deduction: $4,582 (reported on 2.6% of returns)
02468:
$4,582
Massachusetts:
$3,100
(% of AGI for various income ranges: 1.0% for AGIs $10k-25k, 0.6% for AGIs $50k-75k, 0.0% for AGIs over 100k)
Self-employed pension: $18,394 (reported on 10.8% of returns)
Here:
$18,394
Massachusetts:
$14,516
(% of AGI for various income ranges: 1.1% for AGIs $50k-75k, 1.7% for AGIs $75k-100k, 1.2% for AGIs over 100k)
Total itemized deductions: $43,576 (16% of AGI, reported on 62.0% of returns)
Here:
$43,576
State:
$22,573
Here:
16.0% of AGI
State:
19.5% of AGI
(% of AGI for various income ranges: 23.3% for AGIs below $10k, 32.1% for AGIs $10k-25k, 23.5% for AGIs $25k-50k, 25.5% for AGIs $50k-75k, 32.6% for AGIs $75k-100k, 14.3% for AGIs over 100k)
Charity contributions deductions: $7,819 (3% of AGI, reported on 57.8% of returns)
Here:
$7,819
State:
$3,295
Here:
2.7% of AGI
State:
2.7% of AGI
(% of AGI for various income ranges: 2.1% for AGIs $10k-25k, 1.7% for AGIs $25k-50k, 2.6% for AGIs $50k-75k, 2.8% for AGIs $75k-100k, 2.6% for AGIs over 100k)
Total tax: $46,801 (reported on 81.6% of returns)
02468:
$46,801
State:
$11,494
(% of AGI for various income ranges: 4.5% for AGIs below $10k, 4.9% for AGIs $10k-25k, 8.6% for AGIs $25k-50k, 10.9% for AGIs $50k-75k, 10.6% for AGIs $75k-100k, 23.0% for AGIs over 100k)
Earned income credit: $1,125 (reported on 1.1% of returns)
Here:
$1,125
State:
$1,518
Percentage of individuals using paid preparers for their 2004 taxes: 69.5%
Here:
69%
State:
58%
(% for various income ranges: 67.3% for AGIs below $10k, 64.9% for AGIs $10k-25k, 61.5% for AGIs $25k-50k, 67.6% for AGIs $50k-75k, 66.7% for AGIs $75k-100k, 74.1% for AGIs over 100k)
Likely homosexual households (counted as self-reported same-sex unmarried-partner households)
Lesbian couples: 0.4% of all households
Gay men: 0.0% of all households
Household received Food Stamps/SNAP in the past 12 months: 0 Household did not receive Food Stamps/SNAP in the past 12 months: 1,945
Women who had a birth in the past 12 months: 25 (26 now married, 0 unmarried) Women who did not have a birth in the past 12 months: 1,017 (584 now married, 419 unmarried)
Housing units in zip code 02468 with a mortgage: 1,146 (274 second mortgage, 9 home equity loan, 211 both second mortgage and home equity loan) Houses without a mortgage: 62
Median monthly owner costs for units with a mortgage: $3,900 Median monthly owner costs for units without a mortgage: $1,507
Residents with income below the poverty level in 2022:
This zip code:
0.9%
Whole state:
10.4%
Residents with income below 50% of the poverty level in 2022:
This zip code:
0.6%
Whole state:
5.1%
Median number of rooms in houses and condos:
Here:
10.0
State:
6.5
Median number of rooms in apartments:
Here:
10.0
State:
4.0
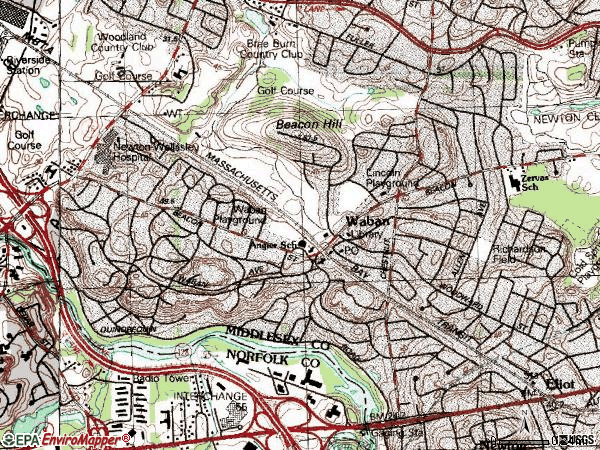
Notable locations in this zip code not listed on our city pages
Notable locations in zip code 02468: Richardson Field (A), Lincoln Playground (B), Frank Zervas Elementary School Library (C), Waban Branch Newton Free Library (D). Display/hide their locations on the map
Parks in zip code 02468 include: Windsor Road Historic District (1), Pine Ridge Road-Plainfield Street Historic District (2). Display/hide their locations on the map
In group quarters: 91 (-1 institutionalized population)
Size of family households: 905 2-persons, 332 3-persons, 375 4-persons, 178 5-persons, 34 6-persons
Size of nonfamily households: 152 1-person
1,316 married couples with children.
167 single-parent households (63 men, 104 women).
79.7% of residents of 02468 zip code speak English at home.
3.1% of residents speak Spanish at home (88% very well, 8% well, 4% not well).
7.4% of residents speak other Indo-European language at home (84% very well, 9% well, 6% not well).
8.1% of residents speak Asian or Pacific Island language at home (62% very well, 2% well, 26% not well, 10% not at all).
2.1% of residents speak other language at home (23% very well, 77% well).
Foreign born population: 1,117 (20.0%) (58.5% of them are naturalized citizens)
This zip code:
20.0%
Whole state:
18.0%
11%Iraq
9%Brazil
9%Bhutan
7%Denmark
4%Romania
4%Sweden
3%China, excluding Hong Kong and Taiwan
9%Irish
9%Russian
8%European
7%Italian
6%Eastern European
6%German
5%English
Year of entry for the foreign-born population
3682010 or later
1912000 to 2009
2031990 to 1999
475Before 1990
Public elementary/middle school in in zip code 02468 not listed on the city page:
ZERVAS(Students: 332, Location: 30 BEETHOVEN AVENUE, Grades: KG-5)
Facilities with environmental interests located in this zip code:
A E ANGIER (1697 BEACON STREET in WABAN, MA)
(National Center for Education Statistics) - STATE ID-207005 Organizations: NEWTON (SCHOOL DISTRICT)
ZERVAS (30 BEETHOVEN AVENUE in WABAN, MA)
(National Center for Education Statistics) - STATE ID-207130 Organizations: NEWTON (SCHOOL DISTRICT)
MARTINS OF NEWTON INC (1625 BEACON ST in NEWTON, MA)
Conditionally Exempt Small Quantity Generators, less than 100 kg/month of hazardous waste (Resource Conservation and Recovery Act (tracking hazardous waste)) - notification
76.4%Utility gas
10.0%Fuel oil, kerosene, etc.
6.5%Electricity
4.9%Bottled, tank, or LP gas
1.3%Wood
0.9%Other fuel
Place of birth for U.S.-born residents:
This state: 2,317
Northeast: 1,051
Midwest: 411
South: 274
West: 309
84% of the 02468 zip code residents lived in the same house 5 years ago. Out of people who lived in different houses, 46% lived in this county. Out of people who lived in different counties, 50% lived in Massachusetts.
90% of the 02468 zip code residents lived in the same house 1 year ago. Out of people who lived in different houses, 35% moved from this county. Out of people who lived in different houses, 40% moved from different county within same state. Out of people who lived in different houses, 4% moved from different state. Out of people who lived in different houses, 23% moved from abroad.
Private vs. public school enrollment:
Students in private schools in grades 1 to 8 (elementary and middle school): 223
Here:
27.9%
Massachusetts:
10.3%
Students in private schools in grades 9 to 12 (high school): 198
Here:
45.3%
Massachusetts:
12.3%
Students in private undergraduate colleges: 79
Here:
71.7%
Massachusetts:
51.2%
Occupation by median earnings in the past 12 months ($)
240,064Legal occupations
227,351Health diagnosing and treating practitioners and other technical occupations
206,878Management occupations
179,404Business and financial operations occupations
166,811Architecture and engineering occupations
161,443Life, physical, and social science occupations
Companies with federal contracts located in this zip code:
FUJAWA, PHILIP R JR (920 CHESTNUT in WABAN, MA; small business) : $48,978 in 2 contractsfrom 2005 to 2006
$24,996 with Army for Technical Assistance. Signed on 2006-03-13. Completion date: 2007-01-12.
$23,982, same as above.Signed on 2005-04-06. Completion date: 2006-04-24.
Top industries in this zip code by the number of employees in 2005:
2002 - 2018 National Fire Incident Reporting System (NFIRS) incidents
According to the data from the years 2002 - 2018 the average number of fire incidents per year is 7. The highest number of reported fires - 15 took place in 2003, and the least - 2 in 2012. The data has a rising trend.
When looking into fire subcategories, the most incidents belonged to: Structure Fires (71.7%), and Outside Fires (21.7%).
Fire incident types reported to NFIRS in Zip Code 02468


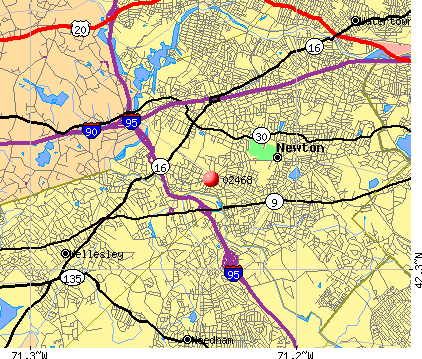 Nearest zip codes: 02464, 02465, 02466, 02461, 02462, 02494.


 (Students: 332, Location: 30 BEETHOVEN AVENUE, Grades: KG-5)


 According to the data from the years 2002 - 2018 the average number of fire incidents per year is 7. The highest number of reported fires - 15 took place in 2003, and the least - 2 in 2012. The data has a rising trend.
 When looking into fire subcategories, the most incidents belonged to: Structure Fires (71.7%), and Outside Fires (21.7%).