Estimated zip code population in 2022: 38,885 Zip code population in 2010: 37,206 Zip code population in 2000: 35,984
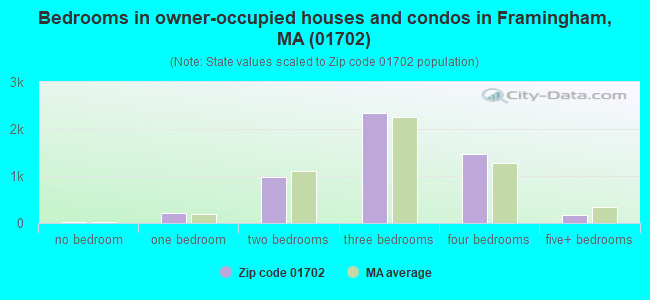
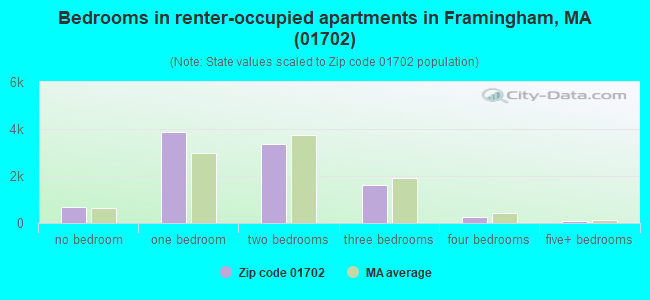
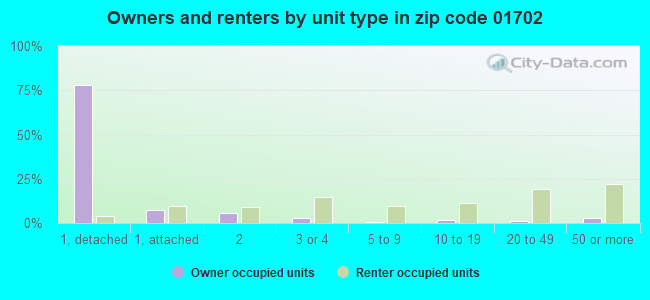
Houses and condos: 15,548 Renter-occupied apartments: 9,828
% of renters here:
65%
State:
38%
March 2022 cost of living index in zip code 01702: 136.5 (high, U.S. average is 100)
Land area: 8.1 sq. mi. Water area: 0.8 sq. mi.
Population density: 4,806 people per square mile
(average).
OSM Map
Google Map
MSN Map
OSM Map
General Map
Google Map
MSN Map
OSM Map
Google Map
MSN Map
OSM Map
Google Map
MSN Map
Please wait while loading the map...
Real estate property taxes paid for housing units in 2022:
This zip code:
1.1% ($6,115)
Massachusetts:
1.0% ($5,536)
Median real estate property taxes paid for housing units with mortgages in 2022: $6,159 (1.1%) Median real estate property taxes paid for housing units with no mortgage in 2022: $6,001 (1.1%)
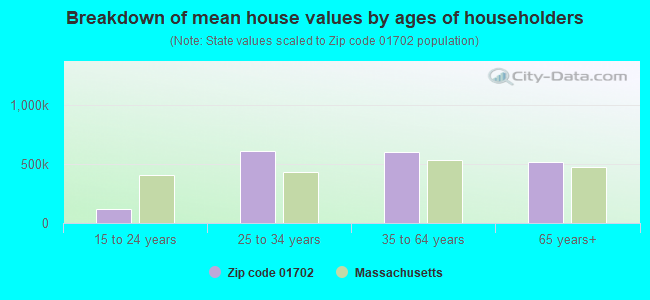
Estimated median house/condo value in 2022: $569,396
01702:
$569,396
Massachusetts:
$534,700
According to our research of Massachusetts and other state lists, there were 18 registered sex offenders living in 01702 zip code as of May 31, 2024. The ratio of all residents to sex offenders in zip code 01702 is 2,185 to 1. The ratio of registered sex offenders to all residents in this zip code is lower than the state average.
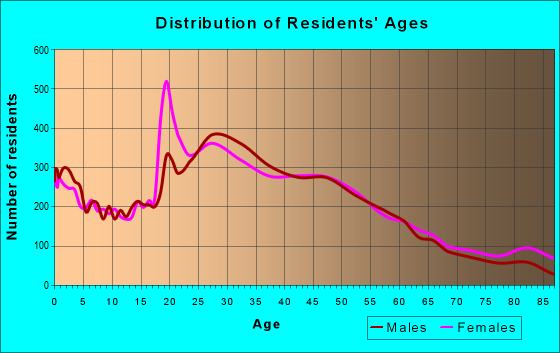
Median resident age:
This zip code:
35.5 years
Massachusetts median age:
40.3 years
Average household size:
This zip code:
2.4 people
Massachusetts:
2.4 people
Averages for the 2020 tax year for zip code 01702, filed in 2021:
Average Adjusted Gross Income (AGI) in 2020: $63,564 (Individual Income Tax Returns)
Here:
$63,564
State:
$105,130
Salary/wage: $59,442 (reported on 77.9% of returns)
Here:
$59,442
State:
$82,951
(% of AGI for various income ranges: 1208.4% for AGIs below $25k, 3743.6% for AGIs $25k-50k, 7176.8% for AGIs $50k-75k, 10993.6% for AGIs $75k-100k, 19737.2% for AGIs $100k-200k, 84624.2% for AGIs over 200k)
Taxable interest for individuals: $1,081 (reported on 28.0% of returns)
This zip code:
$1,081
Massachusetts:
$2,361
(% of AGI for various income ranges: 14.2% for AGIs below $25k, 15.4% for AGIs $25k-50k, 29.5% for AGIs $50k-75k, 41.1% for AGIs $75k-100k, 118.0% for AGIs $100k-200k, 865.8% for AGIs over 200k)
Ordinary dividends: $6,149 (reported on 15.7% of returns)
Here:
$6,149
State:
$10,365
(% of AGI for various income ranges: 18.6% for AGIs below $25k, 25.8% for AGIs $25k-50k, 66.9% for AGIs $50k-75k, 152.9% for AGIs $75k-100k, 334.3% for AGIs $100k-200k, 3735.0% for AGIs over 200k)
Net capital gain/loss in AGI: +$13,591 (reported on 14.5% of returns)
Here:
+$13,591
State:
+$48,178
(% of AGI for various income ranges: 5.5% for AGIs below $25k, 19.5% for AGIs $25k-50k, 69.9% for AGIs $50k-75k, 160.9% for AGIs $75k-100k, 518.7% for AGIs $100k-200k, 10359.6% for AGIs over 200k)
Profit/loss from business: +$15,910 (reported on 24.2% of returns)
Here:
+$15,910
State:
+$20,792
(% of AGI for various income ranges: 450.1% for AGIs below $25k, 533.7% for AGIs $25k-50k, 498.7% for AGIs $50k-75k, 650.0% for AGIs $75k-100k, 727.7% for AGIs $100k-200k, 5311.2% for AGIs over 200k)
Taxable individual retirement arrangement distribution: $17,903 (reported on 5.1% of returns)
01702:
$17,903
Massachusetts:
$22,790
(% of AGI for various income ranges: 34.8% for AGIs below $25k, 45.8% for AGIs $25k-50k, 129.1% for AGIs $50k-75k, 221.7% for AGIs $75k-100k, 464.5% for AGIs $100k-200k, 1536.7% for AGIs over 200k)
Self-employed (Keogh) retirement plans: $19,130 (reported on 0.6% of returns)
01702:
$19,130
Massachusetts:
$26,868
(% of AGI for various income ranges: 33.7% for AGIs $100k-200k, 634.2% for AGIs over 200k)
Total itemized deductions: $27,958 (reported on 8.0% of returns)
Here:
$27,958
State:
$36,722
(% of AGI for various income ranges: 64.1% for AGIs below $25k, 105.0% for AGIs $25k-50k, 302.9% for AGIs $50k-75k, 490.2% for AGIs $75k-100k, 1078.6% for AGIs $100k-200k, 4837.5% for AGIs over 200k)
Charity contributions: $7,055 (reported on 5.8% of returns)
Here:
$7,055
State:
$12,529
(% of AGI for various income ranges: 2.5% for AGIs below $25k, 8.8% for AGIs $25k-50k, 34.4% for AGIs $50k-75k, 52.1% for AGIs $75k-100k, 150.9% for AGIs $100k-200k, 1632.1% for AGIs over 200k)
Taxes paid: $8,367 (reported on 7.9% of returns)
01702:
$8,367
State:
$8,782
(% of AGI for various income ranges: 13.4% for AGIs below $25k, 29.6% for AGIs $25k-50k, 89.9% for AGIs $50k-75k, 187.8% for AGIs $75k-100k, 369.4% for AGIs $100k-200k, 1145.4% for AGIs over 200k)
Earned income credit: $2,024 (reported on 12.4% of returns)
Here:
$2,024
State:
$1,909
(% of AGI for various income ranges: 75.1% for AGIs below $25k, 59.1% for AGIs $25k-50k, 0.9% for AGIs $50k-75k)
Percentage of individuals using paid preparers for their 2020 taxes: 87.9%
Here:
88%
State:
92%
(% for various income ranges: 81.7% for AGIs below $25k, 90.2% for AGIs $25k-50k, 91.5% for AGIs $50k-75k, 91.8% for AGIs $75k-100k, 92.0% for AGIs $100k-200k, 93.7% for AGIs over 200k)
Averages for the 2012 tax year for zip code 01702, filed in 2013:
Average Adjusted Gross Income (AGI) in 2012: $52,896 (Individual Income Tax Returns)
Here:
$52,896
State:
$81,425
Salary/wage: $48,745 (reported on 83.9% of returns)
Here:
$48,745
State:
$64,752
(% of AGI for various income ranges: 72.9% for AGIs below $25k, 83.3% for AGIs $25k-50k, 82.3% for AGIs $50k-75k, 83.1% for AGIs $75k-100k, 82.6% for AGIs $100k-200k, 61.1% for AGIs over 200k)
Taxable interest for individuals: $1,230 (reported on 28.4% of returns)
This zip code:
$1,230
Massachusetts:
$2,136
(% of AGI for various income ranges: 0.8% for AGIs below $25k, 0.4% for AGIs $25k-50k, 0.6% for AGIs $50k-75k, 0.5% for AGIs $75k-100k, 0.5% for AGIs $100k-200k, 1.1% for AGIs over 200k)
Ordinary dividends: $4,596 (reported on 15.9% of returns)
Here:
$4,596
State:
$9,473
(% of AGI for various income ranges: 1.0% for AGIs below $25k, 0.8% for AGIs $25k-50k, 1.0% for AGIs $50k-75k, 1.1% for AGIs $75k-100k, 1.5% for AGIs $100k-200k, 2.3% for AGIs over 200k)
Net capital gain/loss in AGI: +$6,098 (reported on 12.9% of returns)
Here:
+$6,098
State:
+$31,437
(% of AGI for various income ranges: 0.1% for AGIs $25k-50k, 0.1% for AGIs $50k-75k, 0.4% for AGIs $75k-100k, 1.1% for AGIs $100k-200k, 5.5% for AGIs over 200k)
Profit/loss from business: +$15,923 (reported on 18.1% of returns)
Here:
+$15,923
State:
+$20,662
(% of AGI for various income ranges: 17.1% for AGIs below $25k, 7.3% for AGIs $25k-50k, 2.7% for AGIs $50k-75k, 1.9% for AGIs $75k-100k, 3.4% for AGIs $100k-200k, 5.0% for AGIs over 200k)
Taxable individual retirement arrangement distribution: $14,932 (reported on 7.2% of returns)
01702:
$14,932
Massachusetts:
$18,892
(% of AGI for various income ranges: 1.7% for AGIs below $25k, 1.2% for AGIs $25k-50k, 2.3% for AGIs $50k-75k, 2.7% for AGIs $75k-100k, 2.6% for AGIs $100k-200k, 1.6% for AGIs over 200k)
Self-employment retirement plans: $17,210 (reported on 0.6% of returns)
01702:
$17,210
Massachusetts:
$20,669
(% of AGI for various income ranges: 0.1% for AGIs $25k-50k, 0.2% for AGIs $100k-200k, 0.6% for AGIs over 200k)
Total itemized deductions: $22,310 (20% of AGI, reported on 28.0% of returns)
Here:
$22,310
State:
$28,907
Here:
20.1% of AGI
State:
18.2% of AGI
(% of AGI for various income ranges: 7.8% for AGIs below $25k, 9.1% for AGIs $25k-50k, 11.7% for AGIs $50k-75k, 13.2% for AGIs $75k-100k, 14.7% for AGIs $100k-200k, 11.7% for AGIs over 200k)
Charity contributions: $2,501 (reported on 21.8% of returns)
Here:
$2,501
State:
$4,208
(% of AGI for various income ranges: 0.5% for AGIs below $25k, 0.7% for AGIs $25k-50k, 1.0% for AGIs $50k-75k, 1.0% for AGIs $75k-100k, 1.2% for AGIs $100k-200k, 1.4% for AGIs over 200k)
Taxes paid: $10,024 (reported on 28.0% of returns)
01702:
$10,024
State:
$13,303
(% of AGI for various income ranges: 2.3% for AGIs below $25k, 2.6% for AGIs $25k-50k, 4.4% for AGIs $50k-75k, 5.5% for AGIs $75k-100k, 7.1% for AGIs $100k-200k, 7.4% for AGIs over 200k)
Earned income credit: $2,056 (reported on 17.1% of returns)
Here:
$2,056
State:
$1,971
(% of AGI for various income ranges: 5.4% for AGIs below $25k, 0.9% for AGIs $25k-50k)
Percentage of individuals using paid preparers for their 2012 taxes: 57.7%
Here:
58%
State:
56%
(% for various income ranges: 56.2% for AGIs below $25k, 59.5% for AGIs $25k-50k, 59.7% for AGIs $50k-75k, 57.8% for AGIs $75k-100k, 53.9% for AGIs $100k-200k, 65.9% for AGIs over 200k)
Averages for the 2004 tax year for zip code 01702, filed in 2005:
Average Adjusted Gross Income (AGI) in 2004: $45,469 (Individual Income Tax Returns)
Here:
$45,469
State:
$62,877
Salary/wage: $42,452 (reported on 84.6% of returns)
Here:
$42,452
State:
$52,969
(% of AGI for various income ranges: 109.6% for AGIs below $10k, 78.3% for AGIs $10k-25k, 86.0% for AGIs $25k-50k, 83.0% for AGIs $50k-75k, 83.3% for AGIs $75k-100k, 70.4% for AGIs over 100k)
Taxable interest for individuals: $1,628 (reported on 41.4% of returns)
This zip code:
$1,628
Massachusetts:
$1,945
(% of AGI for various income ranges: 5.2% for AGIs below $10k, 1.9% for AGIs $10k-25k, 1.0% for AGIs $25k-50k, 1.4% for AGIs $50k-75k, 1.3% for AGIs $75k-100k, 1.6% for AGIs over 100k)
Taxable dividends: $2,922 (reported on 21.2% of returns)
Here:
$2,922
State:
$5,323
(% of AGI for various income ranges: 3.6% for AGIs below $10k, 1.2% for AGIs $10k-25k, 0.8% for AGIs $25k-50k, 1.1% for AGIs $50k-75k, 1.3% for AGIs $75k-100k, 1.8% for AGIs over 100k)
Net capital gain/loss: +$8,759 (reported on 17.7% of returns)
Here:
+$8,759
State:
+$20,377
(% of AGI for various income ranges: -2.1% for AGIs below $10k, -0.3% for AGIs $10k-25k, 0.2% for AGIs $25k-50k, 1.0% for AGIs $50k-75k, 1.8% for AGIs $75k-100k, 8.2% for AGIs over 100k)
Profit/loss from business: +$14,194 (reported on 16.4% of returns)
Here:
+$14,194
State:
+$17,837
(% of AGI for various income ranges: 21.0% for AGIs below $10k, 9.3% for AGIs $10k-25k, 5.3% for AGIs $25k-50k, 2.6% for AGIs $50k-75k, 4.0% for AGIs $75k-100k, 5.0% for AGIs over 100k)
IRA payment deduction: $3,028 (reported on 2.0% of returns)
01702:
$3,028
Massachusetts:
$3,100
(% of AGI for various income ranges: 0.2% for AGIs $10k-25k, 0.2% for AGIs $25k-50k, 0.1% for AGIs $50k-75k, 0.2% for AGIs $75k-100k, 0.1% for AGIs over 100k)
Self-employed pension: $13,196 (reported on 1.1% of returns)
Here:
$13,196
Massachusetts:
$14,516
(% of AGI for various income ranges: 0.1% for AGIs $10k-25k, 0.1% for AGIs $25k-50k, 0.1% for AGIs $50k-75k, 0.3% for AGIs $75k-100k, 0.6% for AGIs over 100k)
Total itemized deductions: $18,912 (22% of AGI, reported on 32.9% of returns)
Here:
$18,912
State:
$22,573
Here:
22.4% of AGI
State:
19.5% of AGI
(% of AGI for various income ranges: 19.7% for AGIs below $10k, 10.0% for AGIs $10k-25k, 12.6% for AGIs $25k-50k, 14.4% for AGIs $50k-75k, 16.0% for AGIs $75k-100k, 13.9% for AGIs over 100k)
Charity contributions deductions: $2,381 (3% of AGI, reported on 27.4% of returns)
Here:
$2,381
State:
$3,295
Here:
2.6% of AGI
State:
2.7% of AGI
(% of AGI for various income ranges: 0.9% for AGIs below $10k, 0.7% for AGIs $10k-25k, 1.2% for AGIs $25k-50k, 1.4% for AGIs $50k-75k, 1.5% for AGIs $75k-100k, 1.8% for AGIs over 100k)
Total tax: $7,316 (reported on 77.7% of returns)
01702:
$7,316
State:
$11,494
(% of AGI for various income ranges: 5.3% for AGIs below $10k, 5.0% for AGIs $10k-25k, 7.9% for AGIs $25k-50k, 10.2% for AGIs $50k-75k, 11.6% for AGIs $75k-100k, 18.8% for AGIs over 100k)
Earned income credit: $1,578 (reported on 12.9% of returns)
Here:
$1,578
State:
$1,518
Percentage of individuals using paid preparers for their 2004 taxes: 58.6%
Here:
59%
State:
58%
(% for various income ranges: 53.9% for AGIs below $10k, 62.2% for AGIs $10k-25k, 58.6% for AGIs $25k-50k, 59.2% for AGIs $50k-75k, 56.4% for AGIs $75k-100k, 60.5% for AGIs over 100k)
Likely homosexual households (counted as self-reported same-sex unmarried-partner households)
Lesbian couples: 0.4% of all households
Gay men: 0.1% of all households
Household received Food Stamps/SNAP in the past 12 months: 3,001 Household did not receive Food Stamps/SNAP in the past 12 months: 12,114
Women who had a birth in the past 12 months: 514 (413 now married, 104 unmarried) Women who did not have a birth in the past 12 months: 9,589 (4,171 now married, 5,376 unmarried)
Housing units in zip code 01702 with a mortgage: 3,653 (384 second mortgage, 347 both second mortgage and home equity loan) Houses without a mortgage: 172
Median monthly owner costs for units with a mortgage: $2,682 Median monthly owner costs for units without a mortgage: $946
Residents with income below the poverty level in 2022:
This zip code:
15.3%
Whole state:
10.4%
Residents with income below 50% of the poverty level in 2022:
This zip code:
7.8%
Whole state:
5.1%
Median number of rooms in houses and condos:
Here:
6.5
State:
6.5
Median number of rooms in apartments:
Here:
3.6
State:
4.0
Notable locations in this zip code not listed on our city pages
Notable locations in zip code 01702: Framingham Station (A), Framingham (B), Loring Arena (C), Framingham Fire Department Station 5 (D), Healing Partners Resource Library (E), Fuller Middle School Library (F), Framingham Fire Department Station 3 Headquarters (G), Center for Global Education Resource Library (H), Danforth Museum of Art (I), Danforth Museum of Art Library (J), Framingham Public Library (K), Henry Whittemore Library (L), Loring Arena (M), Marks Fine Arts Library (N), Massachusetts Civil Defense Building (O), Framingham Library (P), Tedeschi Library and Information Center (Q), Memorial Building (R), YMCA (S). Display/hide their locations on the map
Shopping Centers: First National Shopping Center (1), Framingham Plaza Shopping Center (2), Route 30 Mall Shopping Center (3). Display/hide their locations on the map
Churches in zip code 01702 include: Wellesley Park Assembly of God Church (A), Temple of Wisdom Church (B), South Middlesex Baptist Church (C), Shalom Pentecostal Church (D), Saint Tarcisius Church (E), Saint Stephans Church (F), Saint Johns Episcopal Church (G), Saint Bridget Church (H), Saint Andrews Episcopal Church (I). Display/hide their locations on the map
Lakes, reservoirs, and swamps: Gleason Pond (A), Learned Pond (B), Waushakum Pond (C), Farm Pond (D), Framingham Reservoir Number Two (E), Framingham Reservoir Number One (F), Reservoir Number Two (G), Sudbury River Reservoir Number One (H). Display/hide their locations on the map
Parks in zip code 01702 include: Irving Square Historic District (1), Sudbury Aqueduct Linear District (2), Longs Playground (3), Anna Murphy Playground (4), Butterworth Park (5), Concord Square Historic District (6), Framingham Centre Common Historic District (7), Dennison Playground (8), Bowditch Field (9). Display/hide their locations on the map
4,738 married couples with children.
2,769 single-parent households (490 men, 2,279 women).
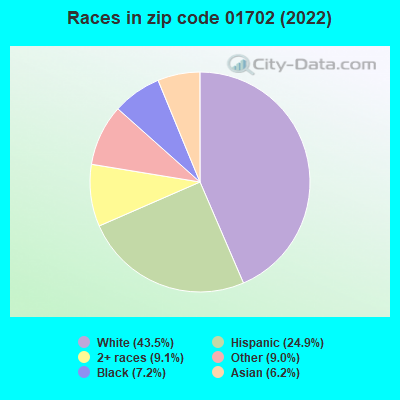
45.3% of residents of 01702 zip code speak English at home.
22.7% of residents speak Spanish at home (48% very well, 19% well, 17% not well, 17% not at all).
28.1% of residents speak other Indo-European language at home (42% very well, 18% well, 23% not well, 17% not at all).
3.9% of residents speak Asian or Pacific Island language at home (57% very well, 18% well, 23% not well, 2% not at all).
1.7% of residents speak other language at home (92% very well, 8% well).
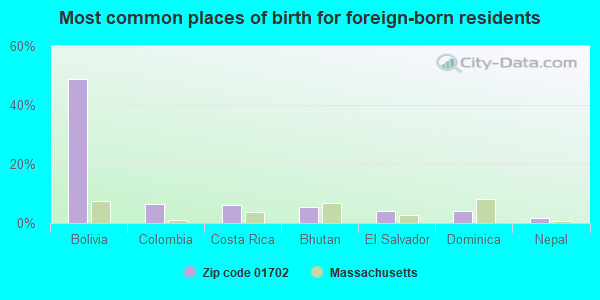
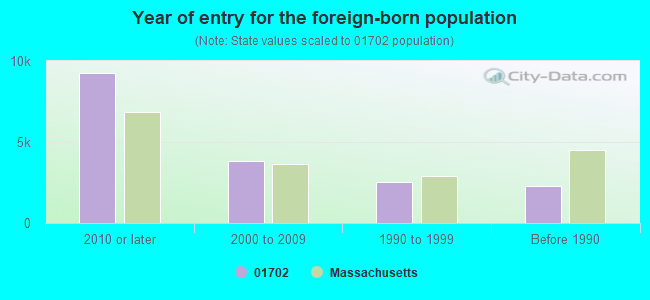
Foreign born population: 16,079 (41.4%) (32.5% of them are naturalized citizens)
Facilities with environmental interests located in this zip code:
CLEAN VENTURE, INC. (133-138 LELAND STREET in FRAMINGHAM, MA)
AIR SYNTHETIC MINOR (AIRS/AFS) ENFORCEMENT/COMPLIANCE ACTIVITY (Integrated Compliance Information System) - ICIS-01-2000-0056, FORMAL ENFORCEMENT ACTION (Integrated Compliance Information System) - ICIS-01-2000-0056, FORMAL ENFORCEMENT ACTION ENFORCEMENT/COMPLIANCE ACTIVITY (Integrated Compliance Information System) COMPLIANCE ACTIVITY (Tracking inspections of insecticide, fungicide, and rodenticide, and toxic substances) CRITERIA AND HAZARDOUS AIR POLLUTANT INVENTORY (Inventory of air pollution sources) STATE MASTER (New Jersey environmental info) - NJEMS-204507, REFUSE DISPOSAL STATE MASTER (New Jersey environmental info) - NJEMS-MAD019371079, TRANSPORTER HAZARDOUS WASTE BIENNIAL REPORTER (Resource Conservation and Recovery Act (tracking hazardous waste)) Large Quantity Generators, more that 1000 kg of hazardous waste/month (Resource Conservation and Recovery Act (tracking hazardous waste)) - notification TSD (Resource Conservation and Recovery Act (tracking hazardous waste)) - notification USED OIL PROGRAM (Resource Conservation and Recovery Act (tracking hazardous waste)) TRI REPORTER (Tracking of toxic chemicals releasing facilities) Business SIC classification: REFUSE SYSTEMS; CHEMICALS AND ALLIED PRODUCTS Business NAICS classification: SOLID WASTE COLLECTION.; HAZARDOUS WASTE COLLECTION.; HAZARDOUS WASTE TREATMENT AND DISPOSAL. Organizations: GENERAL CHEMICAL CORP Alternative names: CLEAN VENTURE/GENERAL CHEMICAL, GENERAL CHEMICAL, GENERAL CHEMICAL COR, HOWARD CLOCK PRODUCTS
MASS BAY COMMUNITY COLLEGE (19 FLAGG ST in FRAMINGHAM, MA)
ENFORCEMENT/COMPLIANCE ACTIVITY (Integrated Compliance Information System) - ICIS-01-2003-9065, FORMAL ENFORCEMENT ACTION (Integrated Compliance Information System) - ICIS-01-2003-9065, FORMAL ENFORCEMENT ACTION Small Quantity Generators, between 100 kg and 1000 kg of hazardous waste/month (Resource Conservation and Recovery Act (tracking hazardous waste)) - notification Organizations: FRAMINGHAM SCHOOL DEPT (CONTACT/OWNER)
Alternative names: MASSACHUSETTS BAY COMMUNITY COLLEGE - FRAMINGHAM CAMPUS
MCC DEC TECH LLC (100 CLINTON ST in FRAMINGHAM, MA)
AIR MAJOR (AIRS/AFS) - ICIS-, ENFORCEMENT/COMPLIANCE ACTIVITY Large Quantity Generators, more that 1000 kg of hazardous waste/month (Resource Conservation and Recovery Act (tracking hazardous waste)) TRI REPORTER (Tracking of toxic chemicals releasing facilities) Business SIC classification: COMMERCIAL PRINTING, GRAVURE Business NAICS classification: COMMERCIAL GRAVURE PRINTING. Organizations: MCC-DEC TECH, LLC (CONTACT/OPERATOR)
, AVERY DENNISON CORP (CONTACT/OWNER)
Alternative names: MULTI-COLOR CORPORATION
KEEFE VOCATIONAL SCHOOL (750 WINTER STREET in FRAMINGHAM, MA)
COMPLIANCE ACTIVITY (Tracking inspections of insecticide, fungicide, and rodenticide, and toxic substances) (National Center for Education Statistics) - STATE ID-829605 Small Quantity Generators, between 100 kg and 1000 kg of hazardous waste/month (Resource Conservation and Recovery Act (tracking hazardous waste)) - notification Organizations: JOHN W. WATHAWAY (CONTACT/OWNER)
, SO MIDDLESEX VOC TECH REG (SCHOOL DISTRICT)
Alternative names: JOSEPH P KEEFE TECH HS, KEEFE TECHNICAL HIGH SCHOOL
AVERY DENNISON CORPORATION (7 BISHOP STREET in FRAMINGHAM, MA)
AIR MINOR (AIRS/AFS) CRITERIA AND HAZARDOUS AIR POLLUTANT INVENTORY (Inventory of air pollution sources) HAZARDOUS WASTE BIENNIAL REPORTER (Resource Conservation and Recovery Act (tracking hazardous waste)) Small Quantity Generators, between 100 kg and 1000 kg of hazardous waste/month (Resource Conservation and Recovery Act (tracking hazardous waste)) TRI REPORTER (Tracking of toxic chemicals releasing facilities) Business SIC classification: COMMERCIAL PRINTING, GRAVURE Business NAICS classification: COMMERCIAL GRAVURE PRINTING.; ALL OTHER MISCELLANEOUS CHEMICAL PRODUCT AND PREPARATION MANUFACTURING.; PEN AND MECHANICAL PENCIL MANUFACTURING.; CARBON PAPER AND INKED RIBBON MANUFACTURING. Alternative names: DENNISON MFG. CO.
AUTO ZONE 3234 (208 WAVERLY ST in FRAMINGHAM, MA)
Large Quantity Generators, more that 1000 kg of hazardous waste/month (Resource Conservation and Recovery Act (tracking hazardous waste)) Organizations: AUTOZONE INC (CONTACT/OPERATOR)
BNY REALTY LLC CONCORD STREET AUTOMOTIVE (506 CONCORD ST in FRAMINGHAM, MA)
Conditionally Exempt Small Quantity Generators, less than 100 kg/month of hazardous waste (Resource Conservation and Recovery Act (tracking hazardous waste)) Organizations: SUN COMPANY INC ( R & M ) (CONTACT/OWNER)
, SALWA & BOUTROS YOUSSEF (CONTACT/OWNER)
Alternative names: BNY REALITY LLC CONCORD STREET AUTOMOTIV, CONCORD ST AUTOMOTIVE, CONCORD STREET AUTOMOTIVE SUNOCO BNY REALTY LLC, SUNOCO SERVICE STA
EHV WEIDMANN (71 BISHOP ST in FRAMINGHAM, MA)
Small Quantity Generators, between 100 kg and 1000 kg of hazardous waste/month (Resource Conservation and Recovery Act (tracking hazardous waste)) - notification Organizations: AVERY DENNISON CORP (CONTACT/OWNER)
BERNARDI TOYOTA (1626 WORCESTER RD in FRAMINGHAM, MA)
Small Quantity Generators, between 100 kg and 1000 kg of hazardous waste/month (Resource Conservation and Recovery Act (tracking hazardous waste)) Business NAICS classification: ALL OTHER AUTOMOTIVE REPAIR AND MAINTENANCE. Organizations: BERNARDI AUTOMALL TRUST (CONTACT/OWNER)
METRO WEST CLEANERS (41B WAVERLY ST in FRAMINGHAM, MA)
Conditionally Exempt Small Quantity Generators, less than 100 kg/month of hazardous waste (Resource Conservation and Recovery Act (tracking hazardous waste)) - notification Organizations: TIMOTHY STEFOPOULOS (CONTACT/OWNER)
BRIMSTONE ESTATES (BRIMSTONE LANE in FRAMINGHAM, MA)
ENFORCEMENT/COMPLIANCE ACTIVITY (Integrated Compliance Information System)
Housing units lacking complete plumbing facilities: 0.6% Housing units lacking complete kitchen facilities: 1.4%
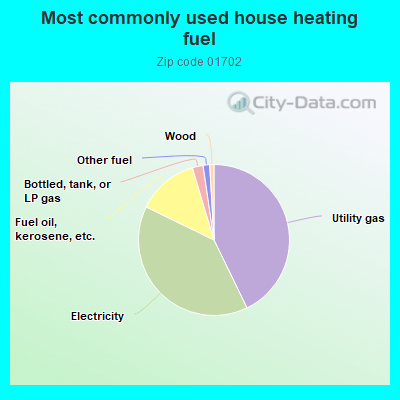
42.6%Utility gas
39.2%Electricity
13.1%Fuel oil, kerosene, etc.
2.3%Bottled, tank, or LP gas
1.4%Other fuel
0.9%Wood
Place of birth for U.S.-born residents:
This state: 15,990
Northeast: 2,876
Midwest: 717
South: 1,523
West: 483
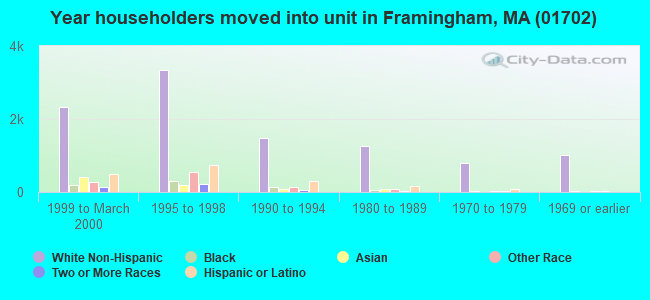
49% of the 01702 zip code residents lived in the same house 5 years ago. Out of people who lived in different houses, 60% lived in this county. Out of people who lived in different counties, 50% lived in Massachusetts.
85% of the 01702 zip code residents lived in the same house 1 year ago. Out of people who lived in different houses, 49% moved from this county. Out of people who lived in different houses, 21% moved from different county within same state. Out of people who lived in different houses, 13% moved from different state. Out of people who lived in different houses, 17% moved from abroad.
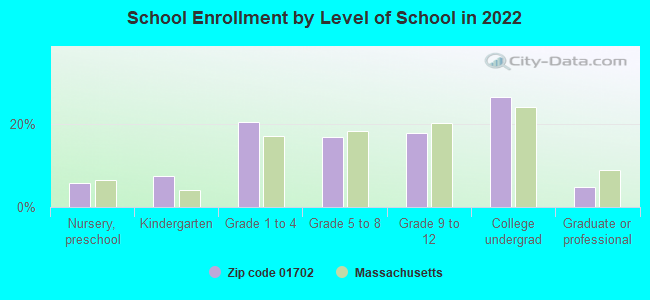
Private vs. public school enrollment:
Students in private schools in grades 1 to 8 (elementary and middle school): 172
Here:
4.9%
Massachusetts:
10.3%
Students in private schools in grades 9 to 12 (high school): 79
Here:
4.7%
Massachusetts:
12.3%
Students in private undergraduate colleges: 662
Here:
26.6%
Massachusetts:
51.2%
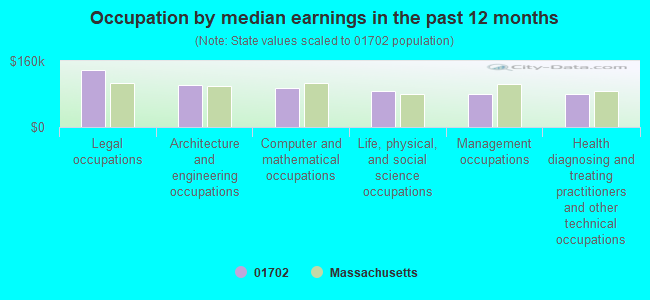
Occupation by median earnings in the past 12 months ($)
137,327Legal occupations
102,208Architecture and engineering occupations
94,851Computer and mathematical occupations
86,998Life, physical, and social science occupations
80,655Management occupations
80,604Health diagnosing and treating practitioners and other technical occupations
Companies with biggest federal contracts located in this zip code (FRAMINGHAM, MA):
DAVE GARDNER CONTRACTOR & SUPP (105 IRVING STREET; small business) : $4,978,561 in 78 contractsfrom 1999 to 2005
Contracts for Facilities Operations Support Services, Maintenance, Repair or Alteration of Real Property -- Family Housing Facilities, Maintenance, Repair or Alteration of Real Property -- Office Buildings, Maintenance, Repair or Alteration of Real Property -- Other Administrative Facilities and Service Buildings by Navy, United States Coast Guard (disused code: now 7008), Army Signed by year:2000: $1,087,478; 2001: $1,056,681; 2002: $2,417,468; 2003: $100,562; 2004: $135,500; 2005: $168,410; 2006: $0.
Biggest contracts:
$893,745 with Navy for Facilities Operations Support Services. Taking place in CT. Signed on 2002-09-30. Completion date: 2002-10-30.
$537,590 with Navy for Facilities Operations Support Services. Taking place in RI. Signed on 2002-09-30. Completion date: 2002-10-30.
$345,012, same as above.Signed on 2002-09-30. Completion date: 2002-10-30.
$292,000 with United States Coast Guard (disused code: now 7008) for Maintenance, Repair or Alteration of Real Property -- Family Housing Facilities. Signed on 2001-03-15. Completion date: 2001-12-15.
HANSEN ELECTRICAL SUPPLY, INC (64 WAVERLY STREET; small business) : $372,791 in 15 contractsfrom 2002 to 2006
Contracts for Miscellaneous Electrical and Electronic Components, Electrical Control Equipment, Electrical and Electronic assemblies, Boards, Cards, and Associated Hardware, Connectors, Electrical, and moreby Army Signed by year:2000: $0; 2001: $0; 2002: $45,301; 2003: $88,590; 2004: $208,900; 2005: $20,000; 2006: $10,000.
Biggest contracts:
$176,400 with Army for Miscellaneous Electrical and Electronic Components. Signed on 2004-01-08. Completion date: 2004-06-01.
$32,400 with Army for Electrical Control Equipment. Signed on 2002-12-10. Completion date: 2003-01-15.
$24,612 with Army for Electrical and Electronic assemblies, Boards, Cards, and Associated Hardware. Signed on 2003-04-10. Completion date: 2003-05-05.
$22,500 with Army for Connectors, Electrical. Signed on 2004-07-13. Completion date: 2004-08-30.
CURT W BIBERDORF (1622 WORCESTER RD APT 120B; small business) : $277,648 in 8 contractsfrom 2000 to 2005
Contracts for Newspapers and Periodicals, Other Professional Services, Facilities Operations Support Services by Army Signed by year:2000: $48,000; 2001: $50,000; 2002: $58,000; 2003: $64,000; 2004: $58,064; 2005: -$416; 2006: $0.
Biggest contracts:
$64,000 with Army for Newspapers and Periodicals. Signed on 2003-08-28. Completion date: 2004-08-14.
$58,064, same as above.Signed on 2004-08-19. Completion date: 2004-08-14.
$58,000 with Army for Other Professional Services. Signed on 2002-08-20. Completion date: 2003-09-14.
$50,000, same as above.Signed on 2001-08-14. Completion date: 2003-09-14.
KASWELL & CO INC (58 PEARL ST; small business) : $275,269 in 11 contractsfrom 2000 to 2005
Contracts for Maintenance, Repair or Alteration of Real Property -- Production Buildings, Lumber and Related Basic Wood Materials, Floor Coverings, Other Housekeeping Services by Army Signed by year:2000: $26,918; 2001: $0; 2002: $0; 2003: $215,155; 2004: $9,111; 2005: $24,085; 2006: $0.
Biggest contracts:
$103,000 with Army for Maintenance, Repair or Alteration of Real Property -- Production Buildings. Taking place in NY. Signed on 2003-08-19. Completion date: 2003-09-06.
$98,770, same as above.Signed on 2003-06-18. Completion date: 2003-09-16.
$26,918 with Army for Lumber and Related Basic Wood Materials. Signed on 2000-05-24. Completion date: 2000-06-30.
$17,913, same as above.Signed on 2005-08-23. Completion date: 2005-09-08.
ACME AIR CONDITIONING & RFRGN (467 UNION AVE; small business) : $199,710 in 4 contractsfrom 2000 to 2001
$86,000 with Army for Construction of Structures and Facilities -- Heating and Cooling Plants. Signed on 2000-09-21. Completion date: 2000-10-30.
$43,299 with Army for Maintenance, Repair or Alteration of Real Property -- Heating and Cooling Plants. Signed on 2001-07-13. Completion date: 2001-08-28.
$35,591, same as above.Signed on 2001-08-17. Completion date: 2001-09-28.
$34,820 with Army for Modification of Equipment -- Furnace, Steam Plant, and Drying Equipment; and Nuclear Reactors. Signed on 2000-09-27. Completion date: 2000-10-30.
LICHTENSTEIN, A G & ASSOCIATES (12 IRVING ST)
$166,500 with U.S. Army Corps of Engineers - civil program financing only for A&E Inspection Services (non-construction). Signed on 2000-03-07. Completion date: 2000-05-10.
RECREATION MANAGEMENT INC (10 ROXANNA ST; small business) : $146,170 in 6 contractsfrom 2001 to 2005
Contracts for Recreational Services, Other Professional Services by Army Signed by year:2000: $0; 2001: $25,875; 2002: $27,615; 2003: $30,000; 2004: $33,840; 2005: $28,840; 2006: $0.
Biggest contracts:
$33,840 with Army for Recreational Services. Signed on 2004-04-05. Completion date: 2004-09-10.
$30,000 with Army for Other Professional Services. Signed on 2003-03-25. Completion date: 2003-09-03.
$28,840 with Army for Recreational Services. Signed on 2005-05-02. Completion date: 2005-09-06.
$27,375 with Army for Other Professional Services. Signed on 2002-04-01. Completion date: 2002-09-03.
SINGER & MICHAELI INC (59 FOUNTAIN STREET; small business)
$96,800 with Defense Logistics Agency for Individual Equipment. Signed on 2001-09-28. Completion date: 2002-01-15.
CHANDRA ASSOCIATES (1622 WORCESTER ROAD, #622; small business)
$95,251 with Army for Other Professional Services. Signed on 2006-05-05. Completion date: 2007-01-04.
NORTHEAST RUBBER PRODUCTS INC (110 ALEXANDER ST; small business) : $94,710 in 9 contractsfrom 2004 to 2005
Contracts for Hose and Flexible Tubing, Pipe, Tube and Rigid Tubing, Rubber Fabricated Materials by Navy Signed by year:2000: $0; 2001: $0; 2002: $0; 2003: $0; 2004: $37,700; 2005: $57,010; 2006: $0.
Biggest contracts:
$23,290 with Navy for Hose and Flexible Tubing. Signed on 2004-09-21. Completion date: 2004-11-24.
$23,175, same as above.Signed on 2005-08-11. Completion date: 2005-10-24.
$13,710, same as above.Signed on 2005-03-07. Completion date: 2005-03-31.
$10,940, same as above.Signed on 2004-08-12. Completion date: 2004-10-15.
Top industries in this zip code by the number of employees in 2005:
Health Care and Social Assistance: Offices of Physicians (except Mental Health Specialists) (20-49: 3, 10-19: 7, 5-9: 12, 1-4: 31)
Administrative and Support and Waste Management and Remediation Services: Temporary Help Services (50-99: 4, 1-4: 2)
Administrative and Support and Waste Management and Remediation Services: Janitorial Services (100-249: 1, 20-49: 1, 10-19: 1, 5-9: 2, 1-4: 8)
Professional, Scientific, and Technical Services: Research and Development in the Physical, Engineering, and Life Sciences (100-249: 1, 50-99: 1, 1-4: 2)
Health Care and Social Assistance: Offices of Dentists (10-19: 8, 5-9: 12, 1-4: 12)
People in group quarters in 2010:
1,471 people in college/university student housing
763 people in state prisons
388 people in nursing facilities/skilled-nursing facilities
168 people in other noninstitutional facilities
133 people in group homes intended for adults
76 people in residential treatment centers for adults
60 people in residential treatment centers for juveniles (non-correctional)
58 people in emergency and transitional shelters (with sleeping facilities) for people experiencing homelessness
9 people in residential schools for people with disabilities
People in group quarters in 2000:
1,233 people in college dormitories (includes college quarters off campus)
812 people in state prisons
441 people in nursing homes
101 people in religious group quarters
86 people in other noninstitutional group quarters
73 people in other nonhousehold living situations
42 people in homes or halfway houses for drug/alcohol abuse
8 people in homes for the mentally retarded
Fatal accident statistics in 2012:
Fatal accident count: 1
Vehicles involved in fatal accidents: 2
Fatal accidents caused by drunken drivers: 1
Fatalities: 1
Persons involved in fatal accidents: 3
Pedestrians involved in fatal accidents: 0
Fatal accident statistics in 2011:
Fatal accident count: 2
Vehicles involved in fatal accidents: 2
Fatal accidents caused by drunken drivers: 1
Fatalities: 2
Persons involved in fatal accidents: 6
Pedestrians involved in fatal accidents: 1
Home Mortgage Disclosure Act Aggregated Statistics For Year 2009 (Based on 9 full and 4 partial tracts)
A) FHA, FSA/RHS & VA Home Purchase Loans
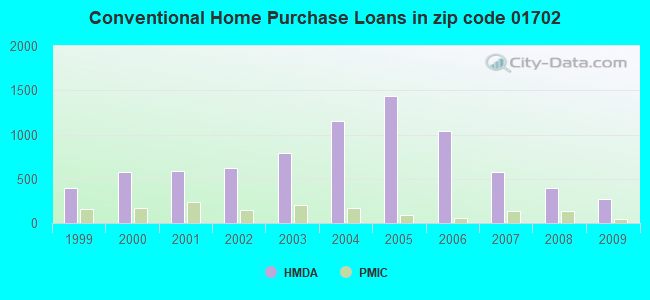
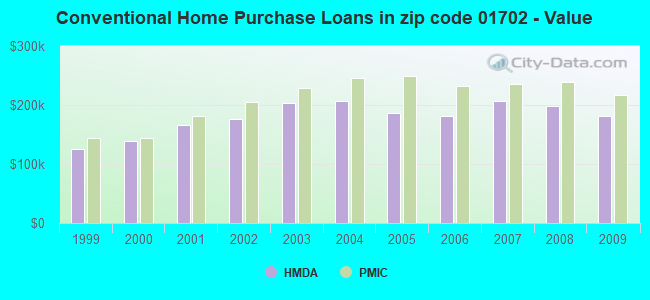
B) Conventional Home Purchase Loans
C) Refinancings
D) Home Improvement Loans
E) Loans on Dwellings For 5+ Families
F) Non-occupant Loans on < 5 Family Dwellings (A B C & D)
Number
Average Value
Number
Average Value
Number
Average Value
Number
Average Value
Number
Average Value
Number
Average Value
LOANS ORIGINATED
164
$214,993
272
$181,316
749
$249,539
41
$113,579
10
$1,393,468
99
$237,919
APPLICATIONS APPROVED, NOT ACCEPTED
14
$176,010
30
$169,331
67
$229,770
0
$0
0
$0
7
$94,769
APPLICATIONS DENIED
53
$171,041
103
$172,414
244
$242,100
15
$39,325
2
$517,500
61
$178,223
APPLICATIONS WITHDRAWN
36
$170,308
53
$156,338
141
$251,259
2
$297,360
0
$0
18
$112,163
FILES CLOSED FOR INCOMPLETENESS
2
$78,390
13
$167,242
57
$213,096
2
$24,780
0
$0
3
$150,823
Aggregated Statistics For Year 2008 (Based on 9 full and 4 partial tracts)
A) FHA, FSA/RHS & VA Home Purchase Loans
B) Conventional Home Purchase Loans
C) Refinancings
D) Home Improvement Loans
E) Loans on Dwellings For 5+ Families
F) Non-occupant Loans on < 5 Family Dwellings (A B C & D)
G) Loans On Manufactured Home Dwelling (A B C & D)
Number
Average Value
Number
Average Value
Number
Average Value
Number
Average Value
Number
Average Value
Number
Average Value
Number
Average Value
LOANS ORIGINATED
130
$219,036
391
$198,373
367
$256,766
39
$102,129
7
$527,806
104
$183,985
0
$0
APPLICATIONS APPROVED, NOT ACCEPTED
12
$232,092
39
$174,592
101
$227,867
4
$40,445
0
$0
27
$166,283
0
$0
APPLICATIONS DENIED
36
$207,997
143
$151,254
367
$248,711
42
$64,473
9
$911,988
72
$165,994
1
$11,310
APPLICATIONS WITHDRAWN
9
$119,519
73
$210,700
101
$232,277
12
$121,228
4
$1,176,402
32
$166,161
0
$0
FILES CLOSED FOR INCOMPLETENESS
3
$267,577
29
$159,235
32
$258,892
5
$102,160
0
$0
15
$172,239
2
$206,190
Aggregated Statistics For Year 2007 (Based on 9 full and 4 partial tracts)
A) FHA, FSA/RHS & VA Home Purchase Loans
B) Conventional Home Purchase Loans
C) Refinancings
D) Home Improvement Loans
E) Loans on Dwellings For 5+ Families
F) Non-occupant Loans on < 5 Family Dwellings (A B C & D)
G) Loans On Manufactured Home Dwelling (A B C & D)
Number
Average Value
Number
Average Value
Number
Average Value
Number
Average Value
Number
Average Value
Number
Average Value
Number
Average Value
LOANS ORIGINATED
5
$326,986
576
$206,585
590
$234,485
88
$77,600
8
$2,499,584
123
$228,556
1
$5,000
APPLICATIONS APPROVED, NOT ACCEPTED
1
$365,000
103
$210,091
158
$205,305
26
$46,674
0
$0
34
$188,303
2
$25,995
APPLICATIONS DENIED
0
$0
180
$235,738
699
$251,382
103
$117,357
2
$406,390
97
$206,676
3
$2,990
APPLICATIONS WITHDRAWN
0
$0
58
$202,215
237
$233,494
11
$198,999
4
$1,030,953
26
$158,282
0
$0
FILES CLOSED FOR INCOMPLETENESS
0
$0
23
$213,045
95
$269,453
4
$163,350
0
$0
5
$267,932
0
$0
Aggregated Statistics For Year 2006 (Based on 9 full and 4 partial tracts)
A) FHA, FSA/RHS & VA Home Purchase Loans
B) Conventional Home Purchase Loans
C) Refinancings
D) Home Improvement Loans
E) Loans on Dwellings For 5+ Families
F) Non-occupant Loans on < 5 Family Dwellings (A B C & D)
G) Loans On Manufactured Home Dwelling (A B C & D)
Number
Average Value
Number
Average Value
Number
Average Value
Number
Average Value
Number
Average Value
Number
Average Value
Number
Average Value
LOANS ORIGINATED
4
$318,670
1,038
$180,679
1,017
$217,859
147
$83,330
17
$823,788
195
$189,470
0
$0
APPLICATIONS APPROVED, NOT ACCEPTED
0
$0
121
$184,476
188
$229,514
17
$91,749
0
$0
34
$355,209
0
$0
APPLICATIONS DENIED
2
$377,925
435
$170,438
743
$229,580
143
$104,236
2
$295,380
80
$225,353
2
$368,725
APPLICATIONS WITHDRAWN
0
$0
145
$196,775
415
$245,694
32
$173,152
2
$446,040
44
$237,924
0
$0
FILES CLOSED FOR INCOMPLETENESS
0
$0
54
$199,759
117
$280,760
3
$38,070
0
$0
12
$337,472
2
$148,845
Aggregated Statistics For Year 2005 (Based on 9 full and 4 partial tracts)
A) FHA, FSA/RHS & VA Home Purchase Loans
B) Conventional Home Purchase Loans
C) Refinancings
D) Home Improvement Loans
E) Loans on Dwellings For 5+ Families
F) Non-occupant Loans on < 5 Family Dwellings (A B C & D)
G) Loans On Manufactured Home Dwelling (A B C & D)
Number
Average Value
Number
Average Value
Number
Average Value
Number
Average Value
Number
Average Value
Number
Average Value
Number
Average Value
LOANS ORIGINATED
12
$160,683
1,439
$186,906
1,141
$229,014
117
$133,257
15
$941,876
234
$200,799
0
$0
APPLICATIONS APPROVED, NOT ACCEPTED
2
$242,120
131
$195,274
134
$204,383
22
$72,467
0
$0
21
$129,836
4
$127,865
APPLICATIONS DENIED
0
$0
437
$172,416
704
$228,597
135
$84,196
4
$347,365
104
$199,797
5
$106,544
APPLICATIONS WITHDRAWN
0
$0
349
$198,932
547
$226,674
53
$139,246
2
$446,040
76
$252,427
0
$0
FILES CLOSED FOR INCOMPLETENESS
0
$0
47
$256,708
190
$294,474
7
$208,946
0
$0
12
$296,308
2
$337,010
Aggregated Statistics For Year 2004 (Based on 9 full and 4 partial tracts)
A) FHA, FSA/RHS & VA Home Purchase Loans
B) Conventional Home Purchase Loans
C) Refinancings
D) Home Improvement Loans
E) Loans on Dwellings For 5+ Families
F) Non-occupant Loans on < 5 Family Dwellings (A B C & D)
G) Loans On Manufactured Home Dwelling (A B C & D)
Number
Average Value
Number
Average Value
Number
Average Value
Number
Average Value
Number
Average Value
Number
Average Value
Number
Average Value
LOANS ORIGINATED
30
$227,958
1,158
$207,206
1,376
$216,713
137
$127,201
18
$2,340,478
218
$235,459
15
$76,193
APPLICATIONS APPROVED, NOT ACCEPTED
0
$0
160
$217,883
207
$228,002
35
$66,551
2
$613,875
43
$246,987
4
$81,278
APPLICATIONS DENIED
2
$112,875
294
$194,686
605
$229,833
156
$95,685
0
$0
96
$196,330
6
$139,045
APPLICATIONS WITHDRAWN
3
$127,220
114
$178,597
435
$220,646
33
$92,480
0
$0
30
$240,826
3
$66,350
FILES CLOSED FOR INCOMPLETENESS
0
$0
49
$211,995
254
$246,352
6
$201,500
0
$0
12
$216,944
0
$0
Aggregated Statistics For Year 2003 (Based on 9 full and 4 partial tracts)
A) FHA, FSA/RHS & VA Home Purchase Loans
B) Conventional Home Purchase Loans
C) Refinancings
D) Home Improvement Loans
E) Loans on Dwellings For 5+ Families
F) Non-occupant Loans on < 5 Family Dwellings (A B C & D)
Number
Average Value
Number
Average Value
Number
Average Value
Number
Average Value
Number
Average Value
Number
Average Value
LOANS ORIGINATED
44
$201,228
792
$203,559
3,003
$184,728
63
$61,774
22
$1,329,933
299
$175,174
APPLICATIONS APPROVED, NOT ACCEPTED
2
$195,285
94
$209,236
456
$173,204
22
$56,560
4
$421,232
37
$180,409
APPLICATIONS DENIED
8
$162,105
172
$198,415
763
$205,609
73
$48,863
7
$168,787
71
$184,695
APPLICATIONS WITHDRAWN
0
$0
96
$193,023
472
$193,725
29
$59,577
0
$0
39
$163,745
FILES CLOSED FOR INCOMPLETENESS
2
$277,945
14
$191,776
70
$189,168
2
$29,735
0
$0
5
$252,782
Aggregated Statistics For Year 2002 (Based on 7 full and 2 partial tracts)
A) FHA, FSA/RHS & VA Home Purchase Loans
B) Conventional Home Purchase Loans
C) Refinancings
D) Home Improvement Loans
E) Loans on Dwellings For 5+ Families
F) Non-occupant Loans on < 5 Family Dwellings (A B C & D)
Number
Average Value
Number
Average Value
Number
Average Value
Number
Average Value
Number
Average Value
Number
Average Value
LOANS ORIGINATED
76
$173,420
623
$176,400
1,756
$175,167
95
$51,109
15
$639,087
215
$173,192
APPLICATIONS APPROVED, NOT ACCEPTED
1
$126,000
59
$211,416
223
$168,679
33
$32,521
1
$360,000
13
$204,409
APPLICATIONS DENIED
5
$199,348
101
$187,829
372
$171,119
84
$37,919
4
$419,660
39
$155,828
APPLICATIONS WITHDRAWN
11
$187,922
85
$163,061
472
$180,117
21
$39,617
0
$0
46
$165,253
FILES CLOSED FOR INCOMPLETENESS
8
$141,690
26
$164,505
92
$185,462
4
$117,092
0
$0
14
$134,938
Aggregated Statistics For Year 2001 (Based on 7 full and 2 partial tracts)
A) FHA, FSA/RHS & VA Home Purchase Loans
B) Conventional Home Purchase Loans
C) Refinancings
D) Home Improvement Loans
E) Loans on Dwellings For 5+ Families
F) Non-occupant Loans on < 5 Family Dwellings (A B C & D)
Number
Average Value
Number
Average Value
Number
Average Value
Number
Average Value
Number
Average Value
Number
Average Value
LOANS ORIGINATED
91
$159,053
586
$165,473
1,246
$167,241
84
$41,010
16
$314,226
170
$176,163
APPLICATIONS APPROVED, NOT ACCEPTED
11
$158,525
54
$133,235
162
$145,912
33
$38,024
4
$364,175
17
$140,389
APPLICATIONS DENIED
8
$192,490
93
$125,012
362
$134,516
85
$25,908
7
$1,168,739
45
$143,593
APPLICATIONS WITHDRAWN
10
$163,478
43
$185,821
266
$133,879
32
$44,728
5
$327,290
20
$105,321
FILES CLOSED FOR INCOMPLETENESS
0
$0
14
$226,522
70
$138,896
1
$377,160
0
$0
7
$223,834
Aggregated Statistics For Year 2000 (Based on 7 full and 2 partial tracts)
A) FHA, FSA/RHS & VA Home Purchase Loans
B) Conventional Home Purchase Loans
C) Refinancings
D) Home Improvement Loans
E) Loans on Dwellings For 5+ Families
F) Non-occupant Loans on < 5 Family Dwellings (A B C & D)
Number
Average Value
Number
Average Value
Number
Average Value
Number
Average Value
Number
Average Value
Number
Average Value
LOANS ORIGINATED
79
$162,613
577
$138,757
301
$141,420
62
$32,258
10
$729,184
92
$157,761
APPLICATIONS APPROVED, NOT ACCEPTED
6
$182,802
43
$140,455
92
$129,117
36
$38,690
0
$0
9
$112,082
APPLICATIONS DENIED
13
$135,142
97
$114,678
195
$112,640
87
$43,490
1
$700,000
21
$117,657
APPLICATIONS WITHDRAWN
7
$128,684
50
$150,049
134
$93,156
17
$71,195
2
$2,083,830
14
$117,334
FILES CLOSED FOR INCOMPLETENESS
0
$0
6
$99,695
67
$143,466
2
$10,000
0
$0
5
$178,254
Aggregated Statistics For Year 1999 (Based on 5 full and 1 partial tracts)
A) FHA, FSA/RHS & VA Home Purchase Loans
B) Conventional Home Purchase Loans
C) Refinancings
D) Home Improvement Loans
E) Loans on Dwellings For 5+ Families
F) Non-occupant Loans on < 5 Family Dwellings (A B C & D)
2002 - 2018 National Fire Incident Reporting System (NFIRS) incidents
Based on the data from the years 2002 - 2018 the average number of fires per year is 327. The highest number of fires - 457 took place in 2018, and the least - 230 in 2002. The data has a rising trend.
When looking into fire subcategories, the most incidents belonged to: Structure Fires (82.3%), and Outside Fires (12.8%).
Fire incident types reported to NFIRS in Zip Code 01702


 Nearest zip codes: 01701, 01721, 01745, 01770, 01778, 01760.


 Based on the data from the years 2002 - 2018 the average number of fires per year is 327. The highest number of fires - 457 took place in 2018, and the least - 230 in 2002. The data has a rising trend.
 When looking into fire subcategories, the most incidents belonged to: Structure Fires (82.3%), and Outside Fires (12.8%).