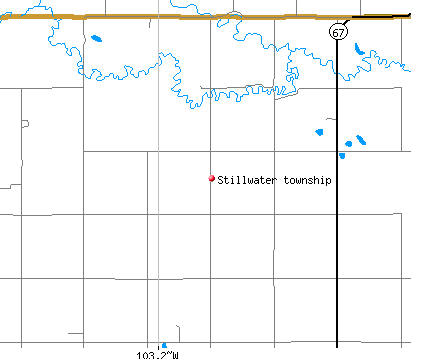
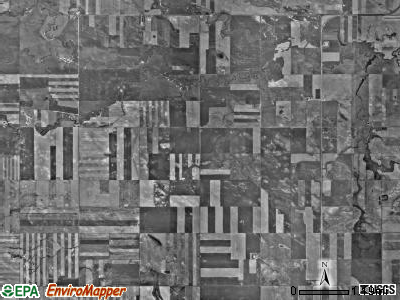
Stillwater township, Bowman County, North Dakota (ND) detailed profile
Land area: 30.6 sq. mi.
Water area: 0.0 sq. mi.
Population: 32 (all rural)
| Males: 13 | |
| Females: 19 |
Occupied houses/apartments: 32 (26 owner occupied, 6 renter occupied)
| % of renters here: | 19% |
| State: | 33% |
Races in Stillwater township:
- White Non-Hispanic: 100.0%
Median age of males: 47.5
Median age of females: 45.8
Discuss North Dakota on our huge forum. We have over 16 million posts!
Average household size: 2.46
| Stillwater township: | 2.5 people |
| North Dakota: | 2.4 people |
Average family size: 2.80
| Stillwater township: | $59,103 |
| North Dakota: | $55,759 |
| Here: | $517 |
| State: | $622 |
Estimated median house or condo value in 2013: $135,095 (it was $50,800 in 2000)
| : | $135,095 |
| North Dakota: | $155,400 |
| Population density: 1 people per square mile | (very low). |
Notable locations in this township outside city limits:
Creeks: South Fork Cedar Creek (A), North Fork Cedar Creek (B). Display/hide their locations on the map
85% of Stillwater township residents lived in the same house 5 years ago.
Out of people who lived in different houses, 0% lived in this county.
Out of people who lived in different counties, 100% lived in North Dakota.
Place of birth for U.S.-born residents:
- This state: 19
- Northeast: 0
- Midwest: 0
- South: 0
- West: 1
Percentage of households with unmarried partners: 7.7%
Likely homosexual households (counted as self-reported same-sex unmarried-partner households)
- Lesbian couples: 7.7% of all households
- Gay men: 0.0% of all households
Housing units in structures:
- One, detached: 13
Housing units in Stillwater township with a mortgage: 0 (0 second mortgage, 0 home equity loan, 0 both second mortgage and home equity loan)
Houses without a mortgage: 6
- Construction (16%)
- Transportation equipment (13%)
- Repair and maintenance (7%)
- Metal and metal products (6%)
- Educational services (4%)
- Administrative and support and waste management services (4%)
- Public administration (4%)
- Health care (23%)
- Accommodation and food services (10%)
- Food and beverage stores (8%)
- Educational services (6%)
- Transportation equipment (5%)
- Metal and metal products (5%)
- Finance and insurance (4%)
- Metal workers and plastic workers (11%)
- Other production occupations including supervisors (8%)
- Other sales and related workers including supervisors (7%)
- Carpenters (7%)
- Electrical equipment mechanics and other installation, maintenance, and repair occupations including supervisors (7%)
- Construction trades workers except carpenters, electricians, painters, plumbers, and construction laborers (6%)
- Driver/sales workers and truck drivers (6%)
- Nursing, psychiatric, and home health aides (8%)
- Secretaries and administrative assistants (7%)
- Health technologists and technicians (7%)
- Cashiers (6%)
- Other sales and related workers including supervisors (5%)
- Other office and administrative support workers including supervisors (5%)
- Sales representatives, services, wholesale and manufacturing (5%)
Most common first ancestries reported in Stillwater township:
- German (40.0%)
- Norwegian (25.0%)
- English (15.0%)
- French (except Basque) (10.0%)
- Irish (10.0%)
Means of transportation to work:
- Drove a car alone: 8 (73%)
- Walked: 3 (27%)
Most commonly used house heating fuel:
- Bottled, tank, or LP gas (60%)
- Electricity (20%)
- Coal or coke (20%)
All residents speak only English at home
Household type by relationship:
Households: 20- In family households: 18 (6 male householders, 0 female householders)
6 spouses, 4 children (4 natural, 0 adopted, 0 stepchildren), 0 grandchildren, 2 brothers or sisters, 0 parents, 0 other relatives, 0 non-relatives
- In nonfamily households: 2 (0 male householders (0 living alone)), 2 female householders (2 living alone)), 0 nonrelatives
Size of family households: 3 2-persons, 3 3-persons,
Size of nonfamily households: 2 1-person,
8 married couples with children.
0 single-parent households (0 men, 0 women).
Private vs. public school enrollment:
Students in private schools in grades 1 to 8 (elementary and middle school): 0
| Here: | 0.0% |
| North Dakota: | 7.1% |
Students in private schools in grades 9 to 12 (high school): 0
| Here: | 0.0% |
| North Dakota: | 6.0% |