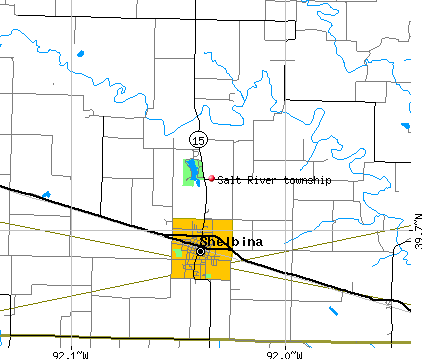
Salt River township, Shelby County, Missouri (MO) detailed profile
Number of foreign born residents: 1 (21% naturalized citizens)
| Salt River township: | 1.4% |
| Whole state: | 2.7% |
59% of Salt River township residents lived in the same house 5 years ago.
Out of people who lived in different houses, 62% lived in this county.
Out of people who lived in different counties, 74% lived in Missouri.
Place of birth for U.S.-born residents:
- This state: 1970
- Northeast: 22
- Midwest: 382
- South: 52
- West: 30
Median price asked for vacant for-sale houses in 2000: $51,000
Percentage of households with unmarried partners: 2.8%
No gay or lesbian households reported
60 people in nursing homes
40 people in other noninstitutional group quarters
Housing units in structures:
- One, detached: 906
- One, attached: 9
- Two: 35
- 3 or 4: 85
- 5 to 9: 3
- Mobile homes: 139
Median worth of mobile homes: $13,800
Housing units in Salt River township with a mortgage: 264 (4 second mortgage, 7 home equity loan, 0 both second mortgage and home equity loan)
Houses without a mortgage: 292
- Metal and metal products (15%)
- Agriculture, forestry, fishing and hunting (12%)
- Construction (9%)
- Repair and maintenance (5%)
- Truck transportation (5%)
- Food and beverage stores (5%)
- Accommodation and food services (3%)
- Health care (17%)
- Educational services (13%)
- Metal and metal products (11%)
- Finance and insurance (8%)
- Agriculture, forestry, fishing and hunting (6%)
- Food and beverage stores (5%)
- Machinery (4%)
- Other production occupations including supervisors (9%)
- Driver/sales workers and truck drivers (9%)
- Vehicle and mobile equipment mechanics, installers, and repairers (7%)
- Laborers and material movers, hand (7%)
- Metal workers and plastic workers (7%)
- Farmers and farm managers (5%)
- Sales representatives, services, wholesale and manufacturing (4%)
- Preschool, kindergarten, elementary and middle school teachers (6%)
- Metal workers and plastic workers (6%)
- Nursing, psychiatric, and home health aides (6%)
- Secretaries and administrative assistants (6%)
- Other production occupations including supervisors (6%)
- Building and grounds cleaning and maintenance occupations (5%)
- Cooks and food preparation workers (5%)
Most common first ancestries reported in Salt River township:
- German (25.8%)
- United States or American (23.7%)
- English (18.5%)
- Irish (10.5%)
- Scotch-Irish (3.7%)
- French (except Basque) (2.0%)
- European (1.6%)
Most common places of birth for the foreign-born residents:
- United Kingdom (21%)
- Germany (21%)
- Vietnam (21%)
- Canada (15%)
- France (12%)
- Laos (9%)
Means of transportation to work:
- Drove a car alone: 897 (79%)
- Carpooled: 117 (10%)
- Walked: 44 (4%)
- Other means: 8 (1%)
- Worked at home: 71 (6%)
Most commonly used house heating fuel:
- Utility gas (50%)
- Bottled, tank, or LP gas (29%)
- Electricity (20%)
- Wood (1%)
60 people in nursing homes
40 people in other noninstitutional group quarters
98.3% of residents of Salt River township speak English at home.
0.6% of residents speak Spanish at home (77% speak English very well, 23% speak English well).
0.8% of residents speak other Indo-European language at home (100% speak English very well).
0.4% of residents speak Asian or Pacific Island language at home (30% speak English very well, 70% speak English not well).
Household type by relationship:
Households: 2,396- In family households: 2,020 (568 male householders, 113 female householders)
549 spouses, 731 children (664 natural, 10 adopted, 57 stepchildren), 25 grandchildren, 0 brothers or sisters, 6 parents, 9 other relatives, 19 non-relatives
- In nonfamily households: 376 (103 male householders (93 living alone)), 245 female householders (227 living alone)), 28 nonrelatives
- In group quarters: 101 (60 institutionalized population)
Size of family households: 332 2-persons, 147 3-persons, 112 4-persons, 59 5-persons, 23 6-persons, 8 7-or-more-persons,
Size of nonfamily households: 320 1-person, 28 2-persons,
402 married couples with children.
154 single-parent households (48 men, 106 women).
Private vs. public school enrollment:
Students in private schools in grades 1 to 8 (elementary and middle school): 0
| Here: | 0.0% |
| Missouri: | 13.7% |
Students in private schools in grades 9 to 12 (high school): 0
| Here: | 0.0% |
| Missouri: | 11.6% |
Students in private undergraduate colleges: 8
| Here: | 19.5% |
| Missouri: | 24.9% |