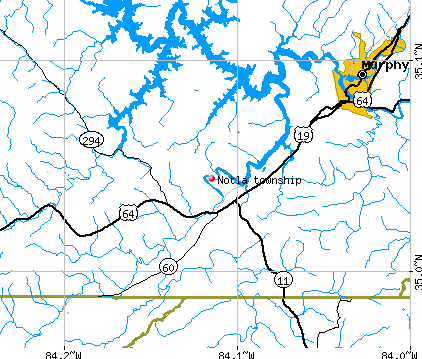
Notla township, Cherokee County, North Carolina (NC) detailed profile
Number of foreign born residents: 0 (54% naturalized citizens)
| Notla township: | 0.4% |
| Whole state: | 5.3% |
70% of Notla township residents lived in the same house 5 years ago.
Out of people who lived in different houses, 32% lived in this county.
Out of people who lived in different counties, 7% lived in North Carolina.
Place of birth for U.S.-born residents:
- This state: 1356
- Northeast: 487
- Midwest: 399
- South: 1241
- West: 33
Median price asked for vacant for-sale houses in 2000: $122,500
Percentage of households with unmarried partners: 3.1%
Likely homosexual households (counted as self-reported same-sex unmarried-partner households)
- Lesbian couples: 0.2% of all households
- Gay men: 0.3% of all households
6 people in nursing homes

Housing units in structures:
- One, detached: 1,685
- Two: 13
- Mobile homes: 450
- Boats, RVs, vans, etc.: 9
Median worth of mobile homes: $22,600
Housing units in Notla township with a mortgage: 418 (44 second mortgage, 52 home equity loan, 0 both second mortgage and home equity loan)
Houses without a mortgage: 453
- Construction (24%)
- Agriculture, forestry, fishing and hunting (7%)
- Repair and maintenance (6%)
- Utilities (6%)
- Accommodation and food services (6%)
- Transportation equipment (5%)
- Educational services (3%)
- Educational services (17%)
- Accommodation and food services (14%)
- Food and beverage stores (10%)
- Health care (8%)
- Social assistance (6%)
- Electrical equipment, appliances, and components (5%)
- Department and other general merchandise stores (4%)
- Building and grounds cleaning and maintenance occupations (11%)
- Carpenters (8%)
- Construction trades workers except carpenters, electricians, painters, plumbers, and construction laborers (7%)
- Other sales and related workers including supervisors (6%)
- Electrical equipment mechanics and other installation, maintenance, and repair occupations including supervisors (5%)
- Fishing and hunting, and forest and logging workers (5%)
- Metal workers and plastic workers (4%)
- Cashiers (9%)
- Preschool, kindergarten, elementary and middle school teachers (7%)
- Other sales and related workers including supervisors (6%)
- Secretaries and administrative assistants (6%)
- Other teachers and instructors, education, training, and library occupations (6%)
- Waiters and waitresses (5%)
- Art and design workers (4%)
Most common first ancestries reported in Notla township:
- United States or American (29.2%)
- German (18.9%)
- Irish (13.7%)
- English (12.1%)
- Scottish (3.2%)
- Italian (3.1%)
- Dutch (3.0%)
Most common places of birth for the foreign-born residents:
- Yugoslavia (54%)
- Germany (46%)
Means of transportation to work:
- Drove a car alone: 1,069 (76%)
- Carpooled: 251 (18%)
- Walked: 34 (2%)
- Worked at home: 61 (4%)
Most commonly used house heating fuel:
- Bottled, tank, or LP gas (39%)
- Electricity (30%)
- Fuel oil, kerosene, etc. (20%)
- Wood (10%)
- Utility gas (2%)
6 people in nursing homes
98.5% of residents of Notla township speak English at home.
0.4% of residents speak Spanish at home (47% speak English very well, 53% speak English not well).
0.8% of residents speak other Indo-European language at home (100% speak English very well).
0.3% of residents speak other language at home (100% speak English very well).
Household type by relationship:
Households: 3,530- In family households: 3,092 (924 male householders, 211 female householders)
990 spouses, 814 children (802 natural, 7 adopted, 5 stepchildren), 30 grandchildren, 31 brothers or sisters, 35 parents, 43 other relatives, 14 non-relatives
- In nonfamily households: 438 (182 male householders (162 living alone)), 199 female householders (163 living alone)), 57 nonrelatives
- In group quarters: 6 (all institutionalized)
Size of family households: 678 2-persons, 181 3-persons, 176 4-persons, 73 5-persons, 20 6-persons, 7 7-or-more-persons,
Size of nonfamily households: 325 1-person, 56 2-persons,
536 married couples with children.
118 single-parent households (31 men, 87 women).
Private vs. public school enrollment:
Students in private schools in grades 1 to 8 (elementary and middle school): 6
| Here: | 1.9% |
| North Carolina: | 8.2% |
Students in private schools in grades 9 to 12 (high school): 0
| Here: | 0.0% |
| North Carolina: | 6.9% |
Students in private undergraduate colleges: 10
| Here: | 7.6% |
| North Carolina: | 20.2% |