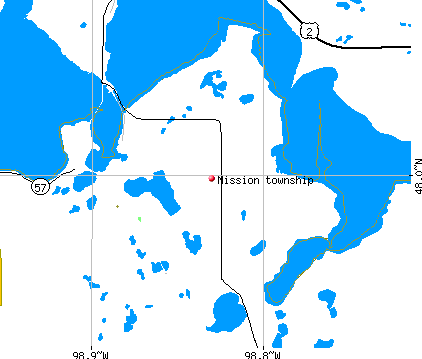
Mission township, Benson County, North Dakota (ND) detailed profile
Number of foreign born residents: 1 (8% naturalized citizens)
| Mission township: | 1.1% |
| Whole state: | 1.9% |
64% of Mission township residents lived in the same house 5 years ago.
Out of people who lived in different houses, 64% lived in this county.
Out of people who lived in different counties, 83% lived in North Dakota.
Place of birth for U.S.-born residents:
- This state: 986
- Northeast: 1
- Midwest: 54
- South: 13
- West: 51
Median price asked for vacant for-sale houses in 2000: $9,999
Percentage of households with unmarried partners: 15.4%
Likely homosexual households (counted as self-reported same-sex unmarried-partner households)
- Lesbian couples: 0.7% of all households
- Gay men: 0.7% of all households
Housing units in structures:
- One, detached: 193
- One, attached: 2
- 5 to 9: 6
- Mobile homes: 95
Median worth of mobile homes: $14,500
Housing units in Mission township with a mortgage: 11 (0 second mortgage, 0 home equity loan, 0 both second mortgage and home equity loan)
Houses without a mortgage: 58
- Construction (15%)
- Public administration (14%)
- Arts, entertainment, and recreation (10%)
- Educational services (8%)
- Agriculture, forestry, fishing and hunting (5%)
- Accommodation and food services (5%)
- Repair and maintenance (5%)
- Arts, entertainment, and recreation (29%)
- Educational services (16%)
- Health care (10%)
- Social assistance (9%)
- Religious, grantmaking, civic, professional, and similar organizations (5%)
- Construction (3%)
- Textile mills and textile products (3%)
- Bus drivers (9%)
- Other management occupations except farmers and farm managers (6%)
- Driver/sales workers and truck drivers (6%)
- Retail sales workers except cashiers (5%)
- Law enforcement workers including supervisors (5%)
- Vehicle and mobile equipment mechanics, installers, and repairers (5%)
- Other production occupations including supervisors (5%)
- Supervisors and other personal care and service workers except personal appearance, transportation, and child care workers (10%)
- Other sales and related workers including supervisors (7%)
- Secretaries and administrative assistants (7%)
- Preschool, kindergarten, elementary and middle school teachers (6%)
- Other management occupations except farmers and farm managers (5%)
- Retail sales workers except cashiers (5%)
- Child care workers (5%)
Most common first ancestries reported in Mission township:
- German (8.6%)
- Norwegian (3.3%)
- Canadian (1.1%)
- Czech (0.7%)
- Irish (0.7%)
- English (0.5%)
- French (except Basque) (0.5%)
Most common places of birth for the foreign-born residents:
- Canada (100%)
Means of transportation to work:
- Drove a car alone: 219 (70%)
- Carpooled: 55 (17%)
- Bus or trolley bus: 16 (5%)
- Walked: 10 (3%)
- Other means: 9 (3%)
- Worked at home: 6 (2%)
Most commonly used house heating fuel:
- Bottled, tank, or LP gas (60%)
- Electricity (17%)
- Fuel oil, kerosene, etc. (14%)
- Utility gas (4%)
- Wood (3%)
- Other fuel (1%)
- Coal or coke (1%)
89.5% of residents of Mission township speak English at home.
1.0% of residents speak other Indo-European language at home (100% speak English very well).
9.5% of residents speak other language at home (86% speak English very well, 3% speak English well, 11% speak English not well).
Household type by relationship:
Households: 1,117- In family households: 1,054 (120 male householders, 114 female householders)
116 spouses, 502 children (472 natural, 16 adopted, 14 stepchildren), 94 grandchildren, 5 brothers or sisters, 2 parents, 21 other relatives, 80 non-relatives
- In nonfamily households: 63 (32 male householders (19 living alone)), 11 female householders (11 living alone)), 20 nonrelatives
Size of family households: 34 2-persons, 50 3-persons, 58 4-persons, 31 5-persons, 33 6-persons, 28 7-or-more-persons,
Size of nonfamily households: 30 1-person, 7 2-persons, 3 3-persons, 3 4-persons,
140 married couples with children.
207 single-parent households (60 men, 147 women).
Private vs. public school enrollment:
Students in private schools in grades 1 to 8 (elementary and middle school): 0
| Here: | 0.0% |
| North Dakota: | 7.1% |
Students in private schools in grades 9 to 12 (high school): 0
| Here: | 0.0% |
| North Dakota: | 6.0% |
Students in private undergraduate colleges: 2
| Here: | 5.6% |
| North Dakota: | 10.5% |