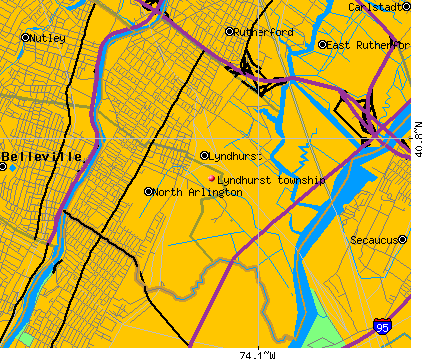
Lyndhurst township, Bergen County, New Jersey (NJ) detailed profile
Number of foreign born residents: 18 (53% naturalized citizens)
| Lyndhurst township: | 17.9% |
| Whole state: | 17.5% |
66% of Lyndhurst township residents lived in the same house 5 years ago.
Out of people who lived in different houses, 52% lived in this county.
Out of people who lived in different counties, 74% lived in New Jersey.
Place of birth for U.S.-born residents:
- This state: 13159
- Northeast: 2228
- Midwest: 138
- South: 202
- West: 20
Median price asked for vacant for-sale houses in 2000: $187,500
Percentage of households with unmarried partners: 3.7%
Likely homosexual households (counted as self-reported same-sex unmarried-partner households)
- Lesbian couples: 0.2% of all households
- Gay men: 0.2% of all households
People in group quarters in Lyndhurst township, New Jersey:
- 22 people in other group homes
- 11 people in religious group quarters
- 5 people in homes for the mentally ill
- 5 people in homes for the mentally retarded

Housing units in structures:
- One, detached: 3,238
- One, attached: 187
- Two: 3,024
- 3 or 4: 665
- 5 to 9: 237
- 10 to 19: 370
- 20 to 49: 258
- 50 or more: 124
Housing units in Lyndhurst township with a mortgage: 1,801 (219 second mortgage, 242 home equity loan, 0 both second mortgage and home equity loan)
Houses without a mortgage: 1,256
- Construction (9%)
- Finance and insurance (6%)
- Professional, scientific, and technical services (5%)
- Public administration (5%)
- Accommodation and food services (5%)
- Other transportation, and support activities, and couriers (4%)
- Repair and maintenance (4%)
- Educational services (11%)
- Health care (10%)
- Finance and insurance (10%)
- Professional, scientific, and technical services (6%)
- Accommodation and food services (6%)
- Chemicals (3%)
- Administrative and support and waste management services (3%)
- Driver/sales workers and truck drivers (5%)
- Other management occupations except farmers and farm managers (5%)
- Material recording, scheduling, dispatching, and distributing workers (5%)
- Other production occupations including supervisors (5%)
- Electrical equipment mechanics and other installation, maintenance, and repair occupations including supervisors (4%)
- Sales representatives, services, wholesale and manufacturing (3%)
- Other office and administrative support workers including supervisors (3%)
- Secretaries and administrative assistants (11%)
- Other office and administrative support workers including supervisors (10%)
- Information and record clerks except customer service representatives (5%)
- Other management occupations except farmers and farm managers (5%)
- Preschool, kindergarten, elementary and middle school teachers (5%)
- Bookkeeping, accounting, and auditing clerks (4%)
- Other sales and related workers including supervisors (4%)
Most common first ancestries reported in Lyndhurst township:
- Italian (40.0%)
- Irish (12.8%)
- Polish (9.6%)
- German (4.3%)
- Portuguese (2.7%)
- United States or American (2.3%)
- English (1.9%)
Most common places of birth for the foreign-born residents:
- Italy (16%)
- Portugal (9%)
- Korea (7%)
- Poland (6%)
- Philippines (6%)
- India (5%)
- Cuba (5%)
Means of transportation to work:
- Drove a car alone: 7,390 (77%)
- Carpooled: 821 (9%)
- Bus or trolley bus: 582 (6%)
- Subway or elevated: 47 (0%)
- Railroad: 311 (3%)
- Taxi: 13 (0%)
- Motorcycle: 8 (0%)
- Bicycle: 4 (0%)
- Walked: 309 (3%)
- Other means: 33 (0%)
- Worked at home: 127 (1%)
Most commonly used house heating fuel:
- Utility gas (78%)
- Fuel oil, kerosene, etc. (16%)
- Electricity (5%)
- Bottled, tank, or LP gas (1%)
People in group quarters in Lyndhurst township, New Jersey:
- 22 people in other group homes
- 11 people in religious group quarters
- 5 people in homes for the mentally ill
- 5 people in homes for the mentally retarded
73.6% of residents of Lyndhurst township speak English at home.
8.2% of residents speak Spanish at home (58% speak English very well, 24% speak English well, 12% speak English not well, 6% don't speak English at all).
12.6% of residents speak other Indo-European language at home (58% speak English very well, 26% speak English well, 12% speak English not well, 4% don't speak English at all).
5.0% of residents speak Asian or Pacific Island language at home (50% speak English very well, 26% speak English well, 19% speak English not well, 6% don't speak English at all).
0.6% of residents speak other language at home (65% speak English very well, 23% speak English well, 11% speak English not well).
Household type by relationship:
Households: 19,340- In family households: 16,221 (3,942 male householders, 1,312 female householders)
4,188 spouses, 5,515 children (5,214 natural, 94 adopted, 207 stepchildren), 188 grandchildren, 228 brothers or sisters, 243 parents, 417 other relatives, 188 non-relatives
- In nonfamily households: 3,119 (1,088 male householders (881 living alone)), 1,564 female householders (1,382 living alone)), 467 nonrelatives
- In group quarters: 43 (0 institutionalized population)
Size of family households: 2,107 2-persons, 1,366 3-persons, 1,104 4-persons, 521 5-persons, 145 6-persons, 11 7-or-more-persons,
Size of nonfamily households: 2,263 1-person, 336 2-persons, 42 3-persons, 5 4-persons, 6 5-persons,
2,846 married couples with children.
581 single-parent households (103 men, 478 women).
Private vs. public school enrollment:
Students in private schools in grades 1 to 8 (elementary and middle school): 342
| Here: | 18.3% |
| New Jersey: | 13.2% |
Students in private schools in grades 9 to 12 (high school): 150
| Here: | 19.3% |
| New Jersey: | 13.0% |
Students in private undergraduate colleges: 301
| Here: | 35.1% |
| New Jersey: | 30.1% |