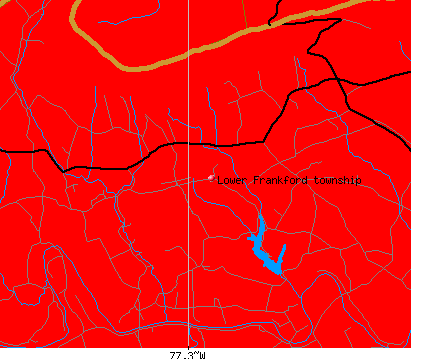
Lower Frankford township, Cumberland County, Pennsylvania (PA) detailed profile
Number of foreign born residents: 2 (46% naturalized citizens)
| Lower Frankford township: | 2.0% |
| Whole state: | 4.1% |
64% of Lower Frankford township residents lived in the same house 5 years ago.
Out of people who lived in different houses, 75% lived in this county.
Out of people who lived in different counties, 61% lived in Pennsylvania.
Place of birth for U.S.-born residents:
- This state: 1601
- Northeast: 50
- Midwest: 35
- South: 73
- West: 23
Median price asked for vacant for-sale houses in 2000: $85,000
Percentage of households with unmarried partners: 7.3%
Likely homosexual households (counted as self-reported same-sex unmarried-partner households)
- Lesbian couples: 0.1% of all households
- Gay men: 0.1% of all households
Housing units in structures:
- One, detached: 478
- One, attached: 8
- 3 or 4: 5
- 5 to 9: 5
- Mobile homes: 207
Median worth of mobile homes: $25,000
Housing units in Lower Frankford township with a mortgage: 232 (21 second mortgage, 52 home equity loan, 0 both second mortgage and home equity loan)
Houses without a mortgage: 103
- Construction (13%)
- Public administration (9%)
- Repair and maintenance (7%)
- Plastics and rubber products (6%)
- Truck transportation (6%)
- Computer and electronic products (4%)
- Health care (4%)
- Health care (11%)
- Educational services (10%)
- Finance and insurance (9%)
- Public administration (7%)
- Food and beverage stores (6%)
- Accommodation and food services (5%)
- Broadcasting, internet publishing, and telecommunications services (4%)
- Laborers and material movers, hand (14%)
- Other production occupations including supervisors (13%)
- Vehicle and mobile equipment mechanics, installers, and repairers (7%)
- Other management occupations except farmers and farm managers (4%)
- Driver/sales workers and truck drivers (4%)
- Metal workers and plastic workers (3%)
- Construction laborers (3%)
- Other office and administrative support workers including supervisors (12%)
- Laborers and material movers, hand (5%)
- Business operations specialists (5%)
- Customer service representatives (5%)
- Building and grounds cleaning and maintenance occupations (5%)
- Secretaries and administrative assistants (4%)
- Bookkeeping, accounting, and auditing clerks (4%)
Most common first ancestries reported in Lower Frankford township:
- German (41.9%)
- United States or American (20.6%)
- Irish (11.1%)
- English (6.8%)
- French (except Basque) (2.4%)
- Polish (1.9%)
- Scotch-Irish (1.8%)
Most common places of birth for the foreign-born residents:
- France (27%)
- Venezuela (22%)
- Germany (11%)
- Korea (11%)
- Cambodia (11%)
- Canada (11%)
- Japan (8%)
Means of transportation to work:
- Drove a car alone: 801 (85%)
- Carpooled: 115 (12%)
- Walked: 5 (1%)
- Other means: 5 (1%)
- Worked at home: 20 (2%)
Most commonly used house heating fuel:
- Fuel oil, kerosene, etc. (54%)
- Electricity (22%)
- Bottled, tank, or LP gas (8%)
- Wood (8%)
- Coal or coke (6%)
- Other fuel (1%)
- Utility gas (1%)
96.3% of residents of Lower Frankford township speak English at home.
1.3% of residents speak Spanish at home (82% speak English very well, 18% speak English well).
2.0% of residents speak other Indo-European language at home (100% speak English very well).
0.5% of residents speak Asian or Pacific Island language at home (50% speak English very well, 50% speak English well).
Household type by relationship:
Households: 1,824- In family households: 1,646 (466 male householders, 85 female householders)
469 spouses, 556 children (478 natural, 33 adopted, 45 stepchildren), 12 grandchildren, 5 brothers or sisters, 2 parents, 16 other relatives, 35 non-relatives
- In nonfamily households: 178 (70 male householders (62 living alone)), 71 female householders (47 living alone)), 37 nonrelatives
Size of family households: 242 2-persons, 142 3-persons, 109 4-persons, 44 5-persons, 4 6-persons, 10 7-or-more-persons,
Size of nonfamily households: 109 1-person, 29 2-persons, 3 3-persons,
332 married couples with children.
123 single-parent households (41 men, 82 women).
Private vs. public school enrollment:
Students in private schools in grades 1 to 8 (elementary and middle school): 60
| Here: | 27.6% |
| Pennsylvania: | 16.0% |
Students in private schools in grades 9 to 12 (high school): 11
| Here: | 11.0% |
| Pennsylvania: | 13.1% |
Students in private undergraduate colleges: 13
| Here: | 38.2% |
| Pennsylvania: | 37.3% |