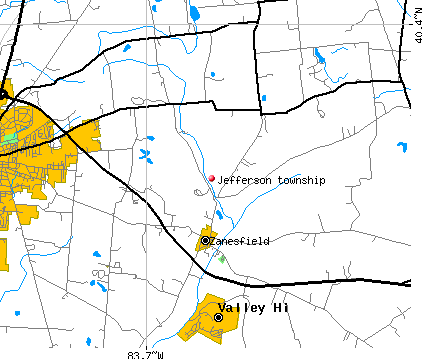
Jefferson township, Logan County, Ohio (OH) detailed profile
Number of foreign born residents: 0 (0% naturalized citizens)
| Jefferson township: | 0.4% |
| Whole state: | 3.0% |
68% of Jefferson township residents lived in the same house 5 years ago.
Out of people who lived in different houses, 56% lived in this county.
Out of people who lived in different counties, 77% lived in Ohio.
Place of birth for U.S.-born residents:
- This state: 2833
- Northeast: 38
- Midwest: 214
- South: 226
- West: 18
Median price asked for vacant for-sale houses in 2000: $22,500
Percentage of households with unmarried partners: 3.9%
Likely homosexual households (counted as self-reported same-sex unmarried-partner households)
- Lesbian couples: 0.4% of all households
- Gay men: 0.2% of all households
Housing units in structures:
- One, detached: 1,105
- One, attached: 2
- Two: 23
- 3 or 4: 29
- 5 to 9: 9
- 10 to 19: 19
- 20 to 49: 24
- Mobile homes: 98
Median worth of mobile homes: $31,700
Housing units in Jefferson township with a mortgage: 478 (50 second mortgage, 134 home equity loan, 0 both second mortgage and home equity loan)
Houses without a mortgage: 422
- Construction (16%)
- Plastics and rubber products (6%)
- Accommodation and food services (5%)
- Agriculture, forestry, fishing and hunting (4%)
- Machinery (4%)
- Educational services (4%)
- Utilities (4%)
- Health care (17%)
- Educational services (12%)
- Accommodation and food services (11%)
- Finance and insurance (6%)
- Social assistance (4%)
- Food and beverage stores (4%)
- Construction (3%)
- Other production occupations including supervisors (9%)
- Metal workers and plastic workers (8%)
- Driver/sales workers and truck drivers (7%)
- Electrical equipment mechanics and other installation, maintenance, and repair occupations including supervisors (6%)
- Laborers and material movers, hand (5%)
- Construction trades workers except carpenters, electricians, painters, plumbers, and construction laborers (5%)
- Farmers and farm managers (4%)
- Secretaries and administrative assistants (8%)
- Registered nurses (8%)
- Other sales and related workers including supervisors (8%)
- Preschool, kindergarten, elementary and middle school teachers (7%)
- Other management occupations except farmers and farm managers (6%)
- Cooks and food preparation workers (4%)
- Other food preparation and serving workers including supervisors (4%)
Most common first ancestries reported in Jefferson township:
- German (70.2%)
- United States or American (11.5%)
- English (4.5%)
- Irish (3.2%)
- Scottish (1.6%)
- French (except Basque) (1.4%)
- Canadian (1.0%)
Most common places of birth for the foreign-born residents:
- Canada (85%)
- Spain (15%)
Means of transportation to work:
- Drove a car alone: 1,497 (88%)
- Carpooled: 116 (7%)
- Bicycle: 6 (0%)
- Walked: 26 (2%)
- Worked at home: 61 (4%)
Most commonly used house heating fuel:
- Utility gas (56%)
- Electricity (30%)
- Bottled, tank, or LP gas (12%)
- Fuel oil, kerosene, etc. (1%)
- Wood (1%)
97.8% of residents of Jefferson township speak English at home.
0.9% of residents speak Spanish at home (76% speak English very well, 24% speak English not well).
1.0% of residents speak other Indo-European language at home (93% speak English very well, 7% speak English well).
0.3% of residents speak Asian or Pacific Island language at home (100% speak English very well).
Household type by relationship:
Households: 3,346- In family households: 3,034 (883 male householders, 100 female householders)
879 spouses, 1,104 children (1,045 natural, 35 adopted, 24 stepchildren), 29 grandchildren, 3 brothers or sisters, 0 parents, 28 other relatives, 8 non-relatives
- In nonfamily households: 312 (126 male householders (108 living alone)), 163 female householders (158 living alone)), 23 nonrelatives
- In group quarters: 7 (0 institutionalized population)
Size of family households: 391 2-persons, 233 3-persons, 247 4-persons, 74 5-persons, 33 6-persons, 5 7-or-more-persons,
Size of nonfamily households: 266 1-person, 21 2-persons, 2 3-persons,
673 married couples with children.
155 single-parent households (43 men, 112 women).
Private vs. public school enrollment:
Students in private schools in grades 1 to 8 (elementary and middle school): 108
| Here: | 25.4% |
| Ohio: | 14.2% |
Students in private schools in grades 9 to 12 (high school): 15
| Here: | 5.7% |
| Ohio: | 10.9% |
Students in private undergraduate colleges: 11
| Here: | 10.6% |
| Ohio: | 23.4% |