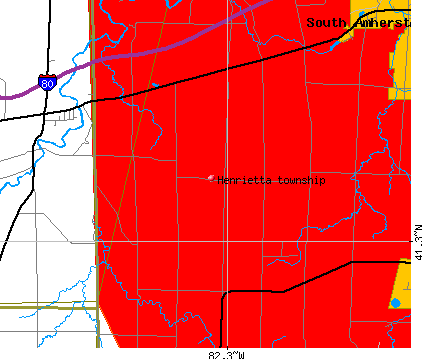
Henrietta township, Lorain County, Ohio (OH) detailed profile
Number of foreign born residents: 1 (62% naturalized citizens)
| Henrietta township: | 0.7% |
| Whole state: | 3.0% |
68% of Henrietta township residents lived in the same house 5 years ago.
Out of people who lived in different houses, 86% lived in this county.
Out of people who lived in different counties, 91% lived in Ohio.
Place of birth for U.S.-born residents:
- This state: 1426
- Northeast: 132
- Midwest: 92
- South: 218
- West: 11
Percentage of households with unmarried partners: 3.4%
No gay or lesbian households reported
Housing units in structures:
- One, detached: 688
- One, attached: 7
- Two: 17
- 3 or 4: 4
Housing units in Henrietta township with a mortgage: 346 (39 second mortgage, 68 home equity loan, 0 both second mortgage and home equity loan)
Houses without a mortgage: 132
- Metal and metal products (14%)
- Transportation equipment (13%)
- Construction (12%)
- Agriculture, forestry, fishing and hunting (10%)
- Educational services (7%)
- Administrative and support and waste management services (6%)
- Machinery (4%)
- Health care (18%)
- Educational services (17%)
- Accommodation and food services (9%)
- Agriculture, forestry, fishing and hunting (4%)
- U. S. Postal service (4%)
- Social assistance (4%)
- Administrative and support and waste management services (4%)
- Metal workers and plastic workers (12%)
- Electrical equipment mechanics and other installation, maintenance, and repair occupations including supervisors (10%)
- Other management occupations except farmers and farm managers (6%)
- Farmers and farm managers (6%)
- Construction trades workers except carpenters, electricians, painters, plumbers, and construction laborers (5%)
- Other production occupations including supervisors (4%)
- Material moving workers except supervisors and laborers and material movers, hand (4%)
- Registered nurses (8%)
- Building and grounds cleaning and maintenance occupations (6%)
- Material recording, scheduling, dispatching, and distributing workers (6%)
- Nursing, psychiatric, and home health aides (4%)
- Counselors, social workers, and other community and social service specialists (4%)
- Sales representatives, services, wholesale and manufacturing (4%)
- Bookkeeping, accounting, and auditing clerks (3%)
Most common first ancestries reported in Henrietta township:
- German (24.3%)
- Irish (12.3%)
- United States or American (12.0%)
- English (9.1%)
- Italian (7.5%)
- Hungarian (5.2%)
- Polish (3.8%)
Most common places of birth for the foreign-born residents:
- Other Caribbean (100%)
Means of transportation to work:
- Drove a car alone: 873 (86%)
- Carpooled: 64 (6%)
- Bus or trolley bus: 6 (1%)
- Subway or elevated: 7 (1%)
- Walked: 18 (2%)
- Worked at home: 50 (5%)
Most commonly used house heating fuel:
- Bottled, tank, or LP gas (42%)
- Utility gas (24%)
- Electricity (16%)
- Wood (8%)
- Fuel oil, kerosene, etc. (8%)
- Other fuel (2%)
98.7% of residents of Henrietta township speak English at home.
0.6% of residents speak Spanish at home (100% speak English very well).
0.7% of residents speak other Indo-European language at home (100% speak English very well).
Household type by relationship:
Households: 1,898- In family households: 1,752 (532 male householders, 44 female householders)
517 spouses, 566 children (548 natural, 0 adopted, 18 stepchildren), 36 grandchildren, 2 brothers or sisters, 0 parents, 44 other relatives, 11 non-relatives
- In nonfamily households: 146 (67 male householders (48 living alone)), 49 female householders (49 living alone)), 30 nonrelatives
Size of family households: 243 2-persons, 121 3-persons, 147 4-persons, 47 5-persons, 18 6-persons,
Size of nonfamily households: 97 1-person, 12 2-persons, 7 3-persons,
391 married couples with children.
40 single-parent households (15 men, 25 women).
Private vs. public school enrollment:
Students in private schools in grades 1 to 8 (elementary and middle school): 16
| Here: | 6.4% |
| Ohio: | 14.2% |
Students in private schools in grades 9 to 12 (high school): 12
| Here: | 14.6% |
| Ohio: | 10.9% |
Students in private undergraduate colleges: 16
| Here: | 18.0% |
| Ohio: | 23.4% |