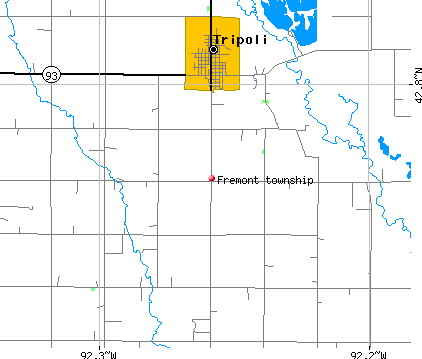
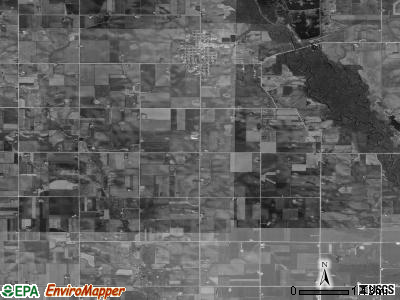
Fremont township, Bremer County, Iowa (IA) detailed profile
Number of foreign born residents: 1 (100% naturalized citizens)
| Fremont township: | 0.5% |
| Whole state: | 3.1% |
57% of Fremont township residents lived in the same house 5 years ago.
Out of people who lived in different houses, 33% lived in this county.
Out of people who lived in different counties, 48% lived in Iowa.
Place of birth for U.S.-born residents:
- This state: 920
- Northeast: 63
- Midwest: 239
- South: 294
- West: 151
Median price asked for vacant for-sale houses in 2000: $52,500
Percentage of households with unmarried partners: 3.8%
Likely homosexual households (counted as self-reported same-sex unmarried-partner households)
- Lesbian couples: 0.1% of all households
- Gay men: 0.1% of all households
32 people in nursing homes
Housing units in structures:
- One, detached: 745
- One, attached: 19
- Two: 4
- 3 or 4: 2
- 5 to 9: 8
- 20 to 49: 8
- Mobile homes: 394
- Boats, RVs, vans, etc.: 25
Median worth of mobile homes: $40,600
Housing units in Fremont township with a mortgage: 138 (1 second mortgage, 5 home equity loan, 0 both second mortgage and home equity loan)
Houses without a mortgage: 186
- Construction (21%)
- Agriculture, forestry, fishing and hunting (8%)
- Repair and maintenance (6%)
- Utilities (6%)
- Public administration (5%)
- Building material and garden equipment and supplies dealers (5%)
- Health care (5%)
- Health care (12%)
- Educational services (12%)
- Finance and insurance (7%)
- Accommodation and food services (6%)
- Department and other general merchandise stores (5%)
- Social assistance (5%)
- Public administration (5%)
- Construction trades workers except carpenters, electricians, painters, plumbers, and construction laborers (8%)
- Carpenters (7%)
- Driver/sales workers and truck drivers (5%)
- Vehicle and mobile equipment mechanics, installers, and repairers (5%)
- Material moving workers except supervisors and laborers and material movers, hand (5%)
- Pipelayers, plumbers, pipefitters, and steamfitters (4%)
- Fishing and hunting, and forest and logging workers (4%)
- Information and record clerks except customer service representatives (9%)
- Secretaries and administrative assistants (8%)
- Retail sales workers except cashiers (6%)
- Health technologists and technicians (5%)
- Other production occupations including supervisors (4%)
- Waiters and waitresses (4%)
- Accountants and auditors (4%)
Most common first ancestries reported in Fremont township:
- United States or American (40.5%)
- English (13.2%)
- German (12.3%)
- Irish (9.7%)
- French (except Basque) (2.4%)
- Scotch-Irish (2.0%)
- Welsh (1.4%)
Most common places of birth for the foreign-born residents:
- Mexico (67%)
- Portugal (33%)
Means of transportation to work:
- Drove a car alone: 471 (79%)
- Carpooled: 79 (13%)
- Walked: 40 (7%)
- Worked at home: 8 (1%)
Most commonly used house heating fuel:
- Bottled, tank, or LP gas (52%)
- Electricity (38%)
- Wood (7%)
- Utility gas (2%)
32 people in nursing homes
97.6% of residents of Fremont township speak English at home.
1.8% of residents speak Spanish at home (71% speak English very well, 29% speak English well).
0.6% of residents speak other Indo-European language at home (100% speak English very well).
Household type by relationship:
Households: 1,678- In family households: 1,482 (417 male householders, 80 female householders)
446 spouses, 428 children (379 natural, 3 adopted, 46 stepchildren), 47 grandchildren, 8 brothers or sisters, 7 parents, 20 other relatives, 29 non-relatives
- In nonfamily households: 196 (72 male householders (62 living alone)), 95 female householders (82 living alone)), 29 nonrelatives
Size of family households: 243 2-persons, 88 3-persons, 135 4-persons, 19 5-persons, 6 6-persons, 6 7-or-more-persons,
Size of nonfamily households: 144 1-person, 17 2-persons, 6 3-persons,
358 married couples with children.
109 single-parent households (31 men, 78 women).
Private vs. public school enrollment:
Students in private schools in grades 1 to 8 (elementary and middle school): 12
| Here: | 8.3% |
| Iowa: | 10.8% |
Students in private schools in grades 9 to 12 (high school): 11
| Here: | 10.2% |
| Iowa: | 7.1% |
Students in private undergraduate colleges: 2
| Here: | 7.4% |
| Iowa: | 25.4% |