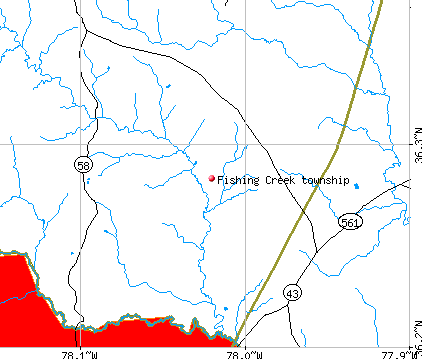
Fishing Creek township, Warren County, North Carolina (NC) detailed profile
Number of foreign born residents: 4 (32% naturalized citizens)
| Fishing Creek township: | 3.5% |
| Whole state: | 5.3% |
68% of Fishing Creek township residents lived in the same house 5 years ago.
Out of people who lived in different houses, 43% lived in this county.
Out of people who lived in different counties, 61% lived in North Carolina.
Place of birth for U.S.-born residents:
- This state: 1543
- Northeast: 32
- Midwest: 39
- South: 68
- West: 16
Percentage of households with unmarried partners: 5.5%
Likely homosexual households (counted as self-reported same-sex unmarried-partner households)
- Lesbian couples: 0.3% of all households
- Gay men: 0.0% of all households

Housing units in structures:
- One, detached: 386
- 3 or 4: 6
- Mobile homes: 294
Median worth of mobile homes: $54,400
Housing units in Fishing Creek township with a mortgage: 112 (0 second mortgage, 17 home equity loan, 0 both second mortgage and home equity loan)
Houses without a mortgage: 85
- Construction (20%)
- Furniture and related product manufacturing (13%)
- Agriculture, forestry, fishing and hunting (8%)
- Accommodation and food services (7%)
- Public administration (6%)
- Textile mills and textile products (6%)
- Miscellaneous manufacturing (6%)
- Health care (36%)
- Educational services (18%)
- Public administration (9%)
- Accommodation and food services (7%)
- Furniture and related product manufacturing (5%)
- Textile mills and textile products (4%)
- Groceries and related products merchant wholesalers (3%)
- Other production occupations including supervisors (9%)
- Driver/sales workers and truck drivers (7%)
- Carpenters (6%)
- Agricultural workers including supervisors (6%)
- Assemblers and fabricators (5%)
- Construction trades workers except carpenters, electricians, painters, plumbers, and construction laborers (4%)
- Electrical equipment mechanics and other installation, maintenance, and repair occupations including supervisors (4%)
- Health technologists and technicians (20%)
- Nursing, psychiatric, and home health aides (9%)
- Building and grounds cleaning and maintenance occupations (7%)
- Other office and administrative support workers including supervisors (6%)
- Other management occupations except farmers and farm managers (5%)
- Law enforcement workers including supervisors (5%)
- Other teachers and instructors, education, training, and library occupations (4%)
Most common first ancestries reported in Fishing Creek township:
- United States or American (7.5%)
- English (2.0%)
- Italian (1.2%)
- Lebanese (1.2%)
- Canadian (0.9%)
- French (except Basque) (0.8%)
- Irish (0.8%)
Most common places of birth for the foreign-born residents:
- Laos (68%)
- Philippines (18%)
- United Kingdom (13%)
Means of transportation to work:
- Drove a car alone: 570 (75%)
- Carpooled: 181 (24%)
- Other means: 7 (1%)
Most commonly used house heating fuel:
- Electricity (43%)
- Bottled, tank, or LP gas (33%)
- Fuel oil, kerosene, etc. (15%)
- Wood (7%)
- Utility gas (1%)
94.1% of residents of Fishing Creek township speak English at home.
1.8% of residents speak Spanish at home (28% speak English very well, 72% speak English well).
0.9% of residents speak other Indo-European language at home (100% speak English very well).
3.2% of residents speak Asian or Pacific Island language at home (56% speak English very well, 44% speak English not well).
Household type by relationship:
Households: 1,758- In family households: 1,532 (328 male householders, 143 female householders)
394 spouses, 624 children (555 natural, 0 adopted, 69 stepchildren), 24 grandchildren, 19 brothers or sisters, 0 parents, 0 other relatives, 0 non-relatives
- In nonfamily households: 226 (89 male householders (89 living alone)), 102 female householders (74 living alone)), 35 nonrelatives
Size of family households: 187 2-persons, 108 3-persons, 122 4-persons, 54 5-persons,
Size of nonfamily households: 163 1-person, 28 2-persons,
293 married couples with children.
125 single-parent households (23 men, 102 women).
Private vs. public school enrollment:
Students in private schools in grades 1 to 8 (elementary and middle school): 0
| Here: | 0.0% |
| North Carolina: | 8.2% |
Students in private schools in grades 9 to 12 (high school): 0
| Here: | 0.0% |
| North Carolina: | 6.9% |
Students in private undergraduate colleges: 5
| Here: | 6.8% |
| North Carolina: | 20.2% |