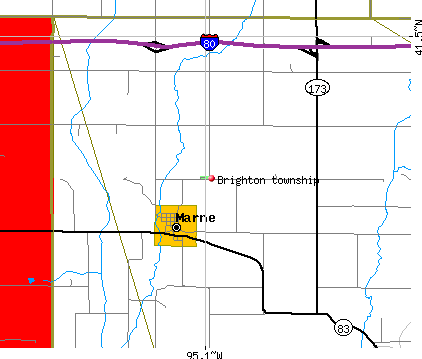
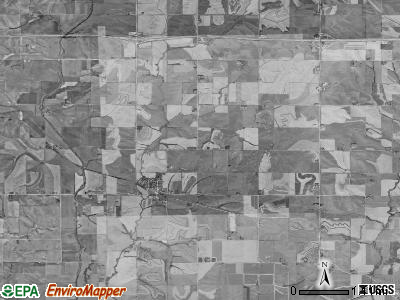
Brighton township, Cass County, Iowa (IA) detailed profile
Number of foreign born residents: 17 (17% naturalized citizens)
| Brighton township: | 17.0% |
| Whole state: | 3.1% |
64% of Brighton township residents lived in the same house 5 years ago.
Out of people who lived in different houses, 63% lived in this county.
Out of people who lived in different counties, 64% lived in Iowa.
Place of birth for U.S.-born residents:
- This state: 5118
- Northeast: 170
- Midwest: 165
- South: 515
- West: 114
Median price asked for vacant for-sale houses in 2000: $25,000
Percentage of households with unmarried partners: 4.2%
Likely homosexual households (counted as self-reported same-sex unmarried-partner households)
- Lesbian couples: 0.7% of all households
- Gay men: 0.0% of all households
Housing units in structures:
- One, detached: 1,722
- One, attached: 4
- Two: 47
- 3 or 4: 47
- 5 to 9: 17
- 10 to 19: 12
- 20 to 49: 2
- Mobile homes: 844
Median worth of mobile homes: $45,800
Housing units in Brighton township with a mortgage: 631 (48 second mortgage, 51 home equity loan, 13 both second mortgage and home equity loan)
Houses without a mortgage: 535
- Agriculture, forestry, fishing and hunting (29%)
- Motor vehicle and parts dealers (14%)
- Construction (13%)
- Truck transportation (11%)
- Repair and maintenance (8%)
- Metal and metal products (5%)
- Food (4%)
- Accommodation and food services (11%)
- Agriculture, forestry, fishing and hunting (10%)
- Food (10%)
- Health care (10%)
- Religious, grantmaking, civic, professional, and similar organizations (8%)
- Food and beverage stores (7%)
- Department and other general merchandise stores (7%)
- Farmers and farm managers (15%)
- Agricultural workers including supervisors (15%)
- Other management occupations except farmers and farm managers (13%)
- Driver/sales workers and truck drivers (13%)
- Supervisors of construction and extraction workers (7%)
- Metal workers and plastic workers (7%)
- Carpenters (6%)
- Bookkeeping, accounting, and auditing clerks (13%)
- Cashiers (10%)
- Other healthcare support occupations (8%)
- Secretaries and administrative assistants (8%)
- Other production occupations including supervisors (8%)
- Building and grounds cleaning and maintenance occupations (7%)
- Registered nurses (6%)
Most common first ancestries reported in Brighton township:
- United States or American (41.6%)
- English (13.7%)
- Irish (6.2%)
- German (4.8%)
- French (except Basque) (2.5%)
- Scottish (2.1%)
- Italian (1.2%)
Most common places of birth for the foreign-born residents:
- Mexico (42%)
- India (23%)
- Thailand (17%)
- Cuba (11%)
- Other Northern Europe (6%)
Means of transportation to work:
- Drove a car alone: 2,458 (81%)
- Carpooled: 436 (14%)
- Bus or trolley bus: 8 (0%)
- Taxi: 2 (0%)
- Walked: 9 (0%)
- Other means: 28 (1%)
- Worked at home: 89 (3%)
Most commonly used house heating fuel:
- Bottled, tank, or LP gas (51%)
- Electricity (40%)
- Fuel oil, kerosene, etc. (5%)
- Utility gas (2%)
- Wood (2%)
- No fuel used (1%)
97.2% of residents of Brighton township speak English at home.
2.3% of residents speak Spanish at home (73% speak English very well, 11% speak English well, 17% speak English not well).
0.5% of residents speak other Indo-European language at home (61% speak English very well, 39% speak English well).
Household type by relationship:
Households: 6,153- In family households: 5,377 (1,508 male householders, 333 female householders)
1,529 spouses, 1,794 children (1,662 natural, 25 adopted, 107 stepchildren), 85 grandchildren, 22 brothers or sisters, 20 parents, 35 other relatives, 51 non-relatives
- In nonfamily households: 776 (273 male householders (206 living alone)), 379 female householders (353 living alone)), 124 nonrelatives
- In group quarters: 16 (0 institutionalized population)
Size of family households: 880 2-persons, 448 3-persons, 342 4-persons, 148 5-persons, 20 6-persons, 3 7-or-more-persons,
Size of nonfamily households: 559 1-person, 69 2-persons, 10 3-persons, 14 4-persons,
85 married couples with children.
8 single-parent households (0 men, 8 women).
Private vs. public school enrollment:
Students in private schools in grades 1 to 8 (elementary and middle school): 0
| Here: | 0.0% |
| Iowa: | 10.8% |
Students in private schools in grades 9 to 12 (high school): 8
| Here: | 3.1% |
| Iowa: | 7.1% |
Students in private undergraduate colleges: 62
| Here: | 20.3% |
| Iowa: | 25.4% |