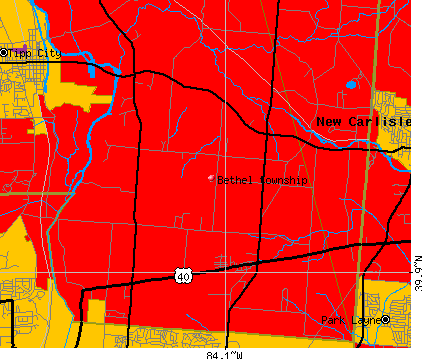
Bethel township, Miami County, Ohio (OH) detailed profile
Number of foreign born residents: 0 (47% naturalized citizens)
| Bethel township: | 0.4% |
| Whole state: | 3.0% |
70% of Bethel township residents lived in the same house 5 years ago.
Out of people who lived in different houses, 22% lived in this county.
Out of people who lived in different counties, 88% lived in Ohio.
Place of birth for U.S.-born residents:
- This state: 3545
- Northeast: 126
- Midwest: 270
- South: 820
- West: 92
Median price asked for vacant for-sale houses in 2000: $162,500
Percentage of households with unmarried partners: 2.6%
Likely homosexual households (counted as self-reported same-sex unmarried-partner households)
- Lesbian couples: 0.3% of all households
- Gay men: 0.1% of all households
Housing units in structures:
- One, detached: 1,734
- One, attached: 25
- Two: 44
- 3 or 4: 15
- Mobile homes: 109
Median worth of mobile homes: $16,500
Housing units in Bethel township with a mortgage: 924 (106 second mortgage, 150 home equity loan, 24 both second mortgage and home equity loan)
Houses without a mortgage: 424
- Construction (16%)
- Transportation equipment (12%)
- Metal and metal products (9%)
- Public administration (7%)
- Professional, scientific, and technical services (6%)
- Accommodation and food services (5%)
- Machinery (4%)
- Educational services (12%)
- Health care (10%)
- Accommodation and food services (8%)
- Department and other general merchandise stores (6%)
- Finance and insurance (6%)
- Public administration (5%)
- Professional, scientific, and technical services (5%)
- Metal workers and plastic workers (11%)
- Electrical equipment mechanics and other installation, maintenance, and repair occupations including supervisors (8%)
- Other management occupations except farmers and farm managers (6%)
- Top executives (5%)
- Other production occupations including supervisors (5%)
- Material recording, scheduling, dispatching, and distributing workers (5%)
- Driver/sales workers and truck drivers (4%)
- Secretaries and administrative assistants (10%)
- Other sales and related workers including supervisors (8%)
- Waiters and waitresses (6%)
- Other office and administrative support workers including supervisors (5%)
- Preschool, kindergarten, elementary and middle school teachers (5%)
- Other management occupations except farmers and farm managers (5%)
- Material recording, scheduling, dispatching, and distributing workers (5%)
Most common first ancestries reported in Bethel township:
- German (33.0%)
- United States or American (17.2%)
- English (14.5%)
- Irish (9.7%)
- Polish (5.5%)
- French (except Basque) (4.0%)
- Scotch-Irish (2.3%)
Most common places of birth for the foreign-born residents:
- Jamaica (53%)
- United Kingdom (47%)
Means of transportation to work:
- Drove a car alone: 2,058 (86%)
- Carpooled: 188 (8%)
- Walked: 23 (1%)
- Worked at home: 120 (5%)
Most commonly used house heating fuel:
- Electricity (36%)
- Fuel oil, kerosene, etc. (29%)
- Bottled, tank, or LP gas (26%)
- Utility gas (4%)
- Wood (4%)
- Other fuel (2%)
97.7% of residents of Bethel township speak English at home.
0.7% of residents speak Spanish at home (17% speak English very well, 69% speak English well, 14% speak English not well).
1.6% of residents speak other Indo-European language at home (49% speak English very well, 23% speak English well, 27% speak English not well).
Household type by relationship:
Households: 4,904- In family households: 4,493 (1,306 male householders, 209 female householders)
1,368 spouses, 1,424 children (1,327 natural, 35 adopted, 62 stepchildren), 67 grandchildren, 35 brothers or sisters, 44 parents, 9 other relatives, 31 non-relatives
- In nonfamily households: 411 (162 male householders (130 living alone)), 194 female householders (188 living alone)), 55 nonrelatives
Size of family households: 714 2-persons, 315 3-persons, 289 4-persons, 144 5-persons, 40 6-persons, 13 7-or-more-persons,
Size of nonfamily households: 318 1-person, 14 2-persons, 24 3-persons,
928 married couples with children.
109 single-parent households (46 men, 63 women).
Private vs. public school enrollment:
Students in private schools in grades 1 to 8 (elementary and middle school): 77
| Here: | 13.2% |
| Ohio: | 14.2% |
Students in private schools in grades 9 to 12 (high school): 69
| Here: | 19.1% |
| Ohio: | 10.9% |
Students in private undergraduate colleges: 28
| Here: | 20.9% |
| Ohio: | 23.4% |