Races in Yukon, Oklahoma (OK) Detailed Stats
Data:
Races - White alone (%)
Races - White alone (% change since 2000)
Races - Black alone (%)
Races - Black alone (% change since 2000)
Races - American Indian alone (%)
Races - American Indian alone (% change since 2000)
Races - Asian alone (%)
Races - Asian alone (% change since 2000)
Races - Hispanic (%)
Races - Hispanic (% change since 2000)
Races - Native Hawaiian and Other Pacific Islander alone (%)
Races - Native Hawaiian and Other Pacific Islander alone (% change since 2000)
Races - Two or more races(%)
Races - Two or more races(% change since 2000)
Races - Other race alone (%)
Races - Other race alone (% change since 2000)
Racial diversity
Place of birth - Born in state of residence (%)
Place of birth - Born in state of residence (%) - White
Place of birth - Born in state of residence (%) - Black or African American
Place of birth - Born in state of residence (%) - Asian
Place of birth - Born in state of residence (%) - Hispanic or Latino
Place of birth - Born in state of residence (%) - American Indian and Alaska Native
Place of birth - Born in state of residence (%) - Multirace
Place of birth - Born in state of residence (%) - Other Race
Place of birth - Born in other state (%)
Place of birth - Born in other state (%) - White
Place of birth - Born in other state (%) - Black or African American
Place of birth - Born in other state (%) - Asian
Place of birth - Born in other state (%) - Hispanic or Latino
Place of birth - Born in other state (%) - American Indian and Alaska Native
Place of birth - Born in other state (%) - Multirace
Place of birth - Born in other state (%) - Other Race
Place of birth - Native, outside of US (%)
Place of birth - Native, outside of US (%) - White
Place of birth - Native, outside of US (%) - Black or African American
Place of birth - Native, outside of US (%) - Asian
Place of birth - Native, outside of US (%) - Hispanic or Latino
Place of birth - Native, outside of US (%) - American Indian and Alaska Native
Place of birth - Native, outside of US (%) - Multirace
Place of birth - Native, outside of US (%) - Other Race
Place of birth - Foreign born (%)
Place of birth - Foreign born (%) - White
Place of birth - Foreign born (%) - Black or African American
Place of birth - Foreign born (%) - Asian
Place of birth - Foreign born (%) - Hispanic or Latino
Place of birth - Foreign born (%) - American Indian and Alaska Native
Place of birth - Foreign born (%) - Multirace
Place of birth - Foreign born (%) - Other Race
Residents speaking English at home (%)
Residents speaking English at home - Born in the United States (%)
Residents speaking English at home - Native, born elsewhere (%)
Residents speaking English at home - Foreign born (%)
Residents speaking Spanish at home (%)
Residents speaking Spanish at home - Born in the United States (%)
Residents speaking Spanish at home - Native, born elsewhere (%)
Residents speaking Spanish at home - Foreign born (%)
Residents speaking other language at home (%)
Residents speaking other language at home - Born in the United States (%)
Residents speaking other language at home - Native, born elsewhere (%)
Residents speaking other language at home - Foreign born (%)
Marital status - Never married (%)
Marital status - Now married (%)
Marital status - Separated (%)
Marital status - Widowed (%)
Marital status - Divorced (%)
Ancestries Reported - Arab (%)
Ancestries Reported - Czech (%)
Ancestries Reported - Danish (%)
Ancestries Reported - Dutch (%)
Ancestries Reported - English (%)
Ancestries Reported - French (%)
Ancestries Reported - French Canadian (%)
Ancestries Reported - German (%)
Ancestries Reported - Greek (%)
Ancestries Reported - Hungarian (%)
Ancestries Reported - Irish (%)
Ancestries Reported - Italian (%)
Ancestries Reported - Lithuanian (%)
Ancestries Reported - Norwegian (%)
Ancestries Reported - Polish (%)
Ancestries Reported - Portuguese (%)
Ancestries Reported - Russian (%)
Ancestries Reported - Scotch-Irish (%)
Ancestries Reported - Scottish (%)
Ancestries Reported - Slovak (%)
Ancestries Reported - Subsaharan African (%)
Ancestries Reported - Swedish (%)
Ancestries Reported - Swiss (%)
Ancestries Reported - Ukrainian (%)
Ancestries Reported - United States (%)
Ancestries Reported - Welsh (%)
Ancestries Reported - West Indian (%)
Ancestries Reported - Other (%)
Geographical mobility - Same house 1 year ago (%)
Geographical mobility - Same house 1 year ago (%) - White
Geographical mobility - Same house 1 year ago (%) - Black or African American
Geographical mobility - Same house 1 year ago (%) - Asian
Geographical mobility - Same house 1 year ago (%) - Hispanic or Latino
Geographical mobility - Same house 1 year ago (%) - American Indian and Alaska Native
Geographical mobility - Same house 1 year ago (%) - Multirace
Geographical mobility - Same house 1 year ago (%) - Other Race
Geographical mobility - Moved within same county (%)
Geographical mobility - Moved within same county (%) - White
Geographical mobility - Moved within same county (%) - Black or African American
Geographical mobility - Moved within same county (%) - Asian
Geographical mobility - Moved within same county (%) - Hispanic or Latino
Geographical mobility - Moved within same county (%) - American Indian and Alaska Native
Geographical mobility - Moved within same county (%) - Multirace
Geographical mobility - Moved within same county (%) - Other Race
Geographical mobility - Moved from different county within same state (%)
Geographical mobility - Moved from different county within same state (%) - White
Geographical mobility - Moved from different county within same state (%) - Black or African American
Geographical mobility - Moved from different county within same state (%) - Asian
Geographical mobility - Moved from different county within same state (%) - Hispanic or Latino
Geographical mobility - Moved from different county within same state (%) - American Indian and Alaska Native
Geographical mobility - Moved from different county within same state (%) - Multirace
Geographical mobility - Moved from different county within same state (%) - Other Race
Geographical mobility - Moved from different state (%)
Geographical mobility - Moved from different state (%) - White
Geographical mobility - Moved from different state (%) - Black or African American
Geographical mobility - Moved from different state (%) - Asian
Geographical mobility - Moved from different state (%) - Hispanic or Latino
Geographical mobility - Moved from different state (%) - American Indian and Alaska Native
Geographical mobility - Moved from different state (%) - Multirace
Geographical mobility - Moved from different state (%) - Other Race
Geographical mobility - Moved from abroad (%)
Geographical mobility - Moved from abroad (%) - White
Geographical mobility - Moved from abroad (%) - Black or African American
Geographical mobility - Moved from abroad (%) - Asian
Geographical mobility - Moved from abroad (%) - Hispanic or Latino
Geographical mobility - Moved from abroad (%) - American Indian and Alaska Native
Geographical mobility - Moved from abroad (%) - Multirace
Geographical mobility - Moved from abroad (%) - Other Race
Place of birth for the foreign-born population - Ireland (%)
Place of birth for the foreign-born population - Denmark (%)
Place of birth for the foreign-born population - Norway (%)
Place of birth for the foreign-born population - Sweden (%)
Place of birth for the foreign-born population - United Kingdom (%)
Place of birth for the foreign-born population - England (%)
Place of birth for the foreign-born population - Scotland (%)
Place of birth for the foreign-born population - Other Northern Europe (%)
Place of birth for the foreign-born population - Austria (%)
Place of birth for the foreign-born population - Belgium (%)
Place of birth for the foreign-born population - France (%)
Place of birth for the foreign-born population - Germany (%)
Place of birth for the foreign-born population - Netherlands (%)
Place of birth for the foreign-born population - Switzerland (%)
Place of birth for the foreign-born population - Other Western Europe (%)
Place of birth for the foreign-born population - Greece (%)
Place of birth for the foreign-born population - Italy (%)
Place of birth for the foreign-born population - Portugal (%)
Place of birth for the foreign-born population - Spain (%)
Place of birth for the foreign-born population - Other Southern Europe (%)
Place of birth for the foreign-born population - Albania (%)
Place of birth for the foreign-born population - Belarus (%)
Place of birth for the foreign-born population - Bosnia and Herzegovina (%)
Place of birth for the foreign-born population - Bulgaria (%)
Place of birth for the foreign-born population - Croatia (%)
Place of birth for the foreign-born population - Czechoslovakia (%)
Place of birth for the foreign-born population - Hungary (%)
Place of birth for the foreign-born population - Latvia (%)
Place of birth for the foreign-born population - Lithuania (%)
Place of birth for the foreign-born population - North Macedonia (Macedonia) (%)
Place of birth for the foreign-born population - Moldova (%)
Place of birth for the foreign-born population - Poland (%)
Place of birth for the foreign-born population - Romania (%)
Place of birth for the foreign-born population - Russia (%)
Place of birth for the foreign-born population - Serbia (%)
Place of birth for the foreign-born population - Ukraine (%)
Place of birth for the foreign-born population - Other Eastern Europe (%)
Place of birth for the foreign-born population - China (%)
Place of birth for the foreign-born population - Hong Kong (%)
Place of birth for the foreign-born population - Taiwan (%)
Place of birth for the foreign-born population - Japan (%)
Place of birth for the foreign-born population - Korea (%)
Place of birth for the foreign-born population - Other Eastern Asia (%)
Place of birth for the foreign-born population - Afghanistan (%)
Place of birth for the foreign-born population - Bangladesh (%)
Place of birth for the foreign-born population - India (%)
Place of birth for the foreign-born population - Iran (%)
Place of birth for the foreign-born population - Kazakhstan (%)
Place of birth for the foreign-born population - Nepal (%)
Place of birth for the foreign-born population - Pakistan (%)
Place of birth for the foreign-born population - Sri Lanka (%)
Place of birth for the foreign-born population - Uzbekistan (%)
Place of birth for the foreign-born population - Other South Central Asia (%)
Place of birth for the foreign-born population - Burma (%)
Place of birth for the foreign-born population - Cambodia (%)
Place of birth for the foreign-born population - Indonesia (%)
Place of birth for the foreign-born population - Laos (%)
Place of birth for the foreign-born population - Malaysia (%)
Place of birth for the foreign-born population - Philippines (%)
Place of birth for the foreign-born population - Singapore (%)
Place of birth for the foreign-born population - Thailand (%)
Place of birth for the foreign-born population - Vietnam (%)
Place of birth for the foreign-born population - Other South Eastern Asia (%)
Place of birth for the foreign-born population - Armenia (%)
Place of birth for the foreign-born population - Iraq (%)
Place of birth for the foreign-born population - Israel (%)
Place of birth for the foreign-born population - Jordan (%)
Place of birth for the foreign-born population - Kuwait (%)
Place of birth for the foreign-born population - Lebanon (%)
Place of birth for the foreign-born population - Saudi Arabia (%)
Place of birth for the foreign-born population - Syria (%)
Place of birth for the foreign-born population - Turkey (%)
Place of birth for the foreign-born population - Yemen (%)
Place of birth for the foreign-born population - Other Western Asia (%)
Place of birth for the foreign-born population - Eritrea (%)
Place of birth for the foreign-born population - Ethiopia (%)
Place of birth for the foreign-born population - Kenya (%)
Place of birth for the foreign-born population - Somalia (%)
Place of birth for the foreign-born population - Uganda (%)
Place of birth for the foreign-born population - Zimbabwe (%)
Place of birth for the foreign-born population - Other Eastern Africa (%)
Place of birth for the foreign-born population - Cameroon (%)
Place of birth for the foreign-born population - Congo (%)
Place of birth for the foreign-born population - Democratic Republic of Congo (Zaire) (%)
Place of birth for the foreign-born population - Other Middle Africa (%)
Place of birth for the foreign-born population - Egypt (%)
Place of birth for the foreign-born population - Morocco (%)
Place of birth for the foreign-born population - Sudan (%)
Place of birth for the foreign-born population - Other Northern Africa (%)
Place of birth for the foreign-born population - South Africa (%)
Place of birth for the foreign-born population - Other Southern Africa (%)
Place of birth for the foreign-born population - Cabo Verde (%)
Place of birth for the foreign-born population - Ghana (%)
Place of birth for the foreign-born population - Liberia (%)
Place of birth for the foreign-born population - Nigeria (%)
Place of birth for the foreign-born population - Senegal (%)
Place of birth for the foreign-born population - Sierra Leone (%)
Place of birth for the foreign-born population - Other Western Africa (%)
Place of birth for the foreign-born population - Australia (%)
Place of birth for the foreign-born population - New Zealand (%)
Place of birth for the foreign-born population - Fiji (%)
Place of birth for the foreign-born population - Micronesia (%)
Place of birth for the foreign-born population - Bahamas (%)
Place of birth for the foreign-born population - Barbados (%)
Place of birth for the foreign-born population - Cuba (%)
Place of birth for the foreign-born population - Dominica (%)
Place of birth for the foreign-born population - Dominican Republic (%)
Place of birth for the foreign-born population - Grenada (%)
Place of birth for the foreign-born population - Haiti (%)
Place of birth for the foreign-born population - Jamaica (%)
Place of birth for the foreign-born population - St. Vincent and the Grenadines (%)
Place of birth for the foreign-born population - Trinidad and Tobago (%)
Place of birth for the foreign-born population - West Indies (%)
Place of birth for the foreign-born population - Other Caribbean (%)
Place of birth for the foreign-born population - Belize (%)
Place of birth for the foreign-born population - Costa Rica (%)
Place of birth for the foreign-born population - El Salvador (%)
Place of birth for the foreign-born population - Guatemala (%)
Place of birth for the foreign-born population - Honduras (%)
Place of birth for the foreign-born population - Mexico (%)
Place of birth for the foreign-born population - Nicaragua (%)
Place of birth for the foreign-born population - Panama (%)
Place of birth for the foreign-born population - Other Central America (%)
Place of birth for the foreign-born population - Argentina (%)
Place of birth for the foreign-born population - Bolivia (%)
Place of birth for the foreign-born population - Brazil (%)
Place of birth for the foreign-born population - Chile (%)
Place of birth for the foreign-born population - Colombia (%)
Place of birth for the foreign-born population - Ecuador (%)
Place of birth for the foreign-born population - Guyana (%)
Place of birth for the foreign-born population - Peru (%)
Place of birth for the foreign-born population - Uruguay (%)
Place of birth for the foreign-born population - Venezuela (%)
Place of birth for the foreign-born population - Other South America (%)
Place of birth for the foreign-born population - Canada (%)
Place of birth for the foreign-born population - Other Northern America (%)
Place of birth for the foreign-born population - Other (%)
Latest news about races in Yukon, OK collected exclusively by city-data.com from local newspapers, TV, and radio stations
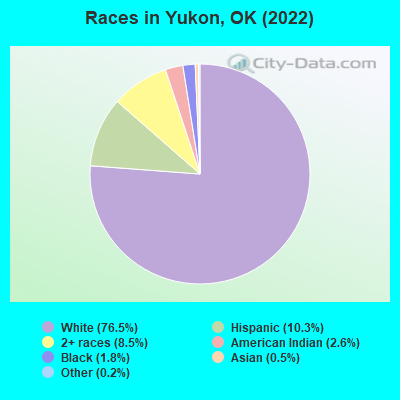
According to 2022 data, the most numerous races in Yukon, OK are White alone (19,984 residents), Hispanic (2,689 residents), and Two or more races (2,213 residents). 93.1% of Yukon residents speak English at home. 2.6% of Yukon, OK residents are foreign-born (1.2% born in Latin America, 0.8% born in Asia, 0.3% born in Europe, 0.3% born in North America), which is 128.5% less than the foreign-born rate of 6.0% across the entire state of Oklahoma.
Race distribution in Yukon
2000 2022
2,556,368 74.1% White alone 266,158 7.7% American Indian alone 257,981 7.5% Black alone 179,304 5.2% Hispanic 140,249 4.1% Two or more races 46,172 1.3% Asian alone 2,322 0.07% Other race alone 2,100 0.06% Native Hawaiian and Other
2,517,403 62.6% White alone 486,692 12.1% Hispanic 364,453 9.1% Two or more races 273,650 6.8% American Indian alone 268,543 6.7% Black alone 92,672 2.3% Asian alone 10,786 0.3% Other race alone 5,601 0.1% Native Hawaiian and Other
Income and house value in Yukon Median household income in 2022 $74,492 White non-Hispanic householders$156,137 Black householders$66,515 American Indian and Alaska Native householders$127,064 Some other race householders$90,921 Two or more races householders$68,992 Hispanic or Latino race householdersMedian 2022 house value $191,937 White Non-Hispanic householders$209,430 Black or African American householders$180,110 American Indian or Alaska Native householders $243,678 Asian householders$234,069 Native Hawaiian and other Pacific Islander householders$145,369 Some other race householders$228,402 Two or more races householders$165,327 Hispanic or Latino householders
Median age by race in Yukon
43.8 Median age for White residents44.2 43.4 27.9 Median age for Black or African American residents24.8 62.2 28.5 Median age for American Indian / Alaska Native residents25.6 19.4 34.4 Median age for Asian residents29.2 35.8 -846,761,452.5 Median age for Native Hawaiian / Pacific Islander residents-666,666,666.0 -767,251,461.2 34.8 Median age for Other race residents34.4 17.9 21.4 Median age for Two or more races residents25.6 17.1 44.3 Median age for White alone residents44.9 44.0 23.6 Median age for Hispanic or Latino residents27.4 18.9
Owner/renter occupied households by race in Yukon
House owners and renters - White residents 5,772 70.4% Owner occupied2,422 29.6% Renter occupiedHouse owners and renters - Black or African American residents 58 49.9% Owner occupied58 50.1% Renter occupiedHouse owners and renters - American Indian / Alaska Native residents 123 51.5% Owner occupied115 48.5% Renter occupiedHouse owners and renters - Asian residents 50 100.0% Owner occupiedHouse owners and renters - Other race residents 147 75.4% Owner occupied48 24.6% Renter occupiedHouse owners and renters - Two or more races residents 587 77.0% Owner occupied176 23.0% Renter occupiedHouse owners and renters - White alone residents 5,626 70.6% Owner occupied2,341 29.4% Renter occupiedHouse owners and renters - Hispanic or Latino residents 642 77.5% Owner occupied187 22.5% Renter occupied
Language usage in Yukon
English speakers - Total 93.1% of residents of Yukon speak English at home.
6.0% of residents speak Spanish at home 1,276 86.4% Speak English very well200 13.6% Speak English less than very well1.0% of residents speak other language at home 189 74.4% Speak English very well65 25.6% Speak English less than very well
English speakers - Born in the United States 92.2% of residents of Yukon speak English at home.
7.9% of residents speak Spanish at home 562 83.9% Speak English very well108 16.1% Speak English less than very well0.5% of residents speak other language at home 38 88.4% Speak English very well5 11.6% Speak English less than very well
English speakers - Native, born elsewhere 88.2% of residents of Yukon speak English at home.
English speakers - Foreign-born 32.6% of residents of Yukon speak English at home.
45.7% of residents speak Spanish at home 185 62.5% Speak English very well111 37.5% Speak English less than very well17.0% of residents speak other language at home 57 51.8% Speak English very well53 48.2% Speak English less than very well
White (Caucasian) - Speak only English Native:
96.5% (19,234)Foreign-born:
61.0% (105)
White (Caucasian) - Speak another language Native:
3.5% (694)Foreign-born:
48.9% (84)
American Indian / Alaska Native - Speak only English Native:
97.6% (611)Foreign-born:
93.4% (16)
Asian - Speak only English Native:
73.2% (27)Foreign-born:
35.5% (31)
Asian - Speak another language Native:
26.7% (10)Foreign-born:
57.0% (49)
Other race - Speak another language Native:
35.1% (184)Foreign-born:
100.0% (219)
Two or more races - Speak only English Native:
79.0% (1,857)Foreign-born:
14.0% (29)
Two or more races - Speak another language Native:
20.4% (479)Foreign-born:
57.8% (118)
White alone - Speak only English Native:
98.1% (18,781)Foreign-born:
80.9% (109)
White alone - Speak another language Native:
1.9% (372)Foreign-born:
15.7% (21)
Hispanic or Latino - Speak another language Native:
46.4% (974)Foreign-born:
98.3% (310)
Foreign-born residents in Yukon 686 residents are foreign born (1.2% Latin America , 0.8% Asia , 0.3% Europe , 0.3% North America ).
This city:
2.6%Oklahoma:
6.1%
Marital status for residents in Yukon Marital status - White (Caucasian) population 15 years and over
Males 28.0% Never married54.0% Now married0.4% Separated3.7% Widowed13.8% DivorcedFemales 23.3% Never married51.7% Now married1.6% Separated9.8% Widowed13.5% DivorcedWomen who gave birth in the past 12 months Now married:
48.7% (155)Unmarried:
51.3% (163)
Women who did not give birth in the past 12 months Now married:
48.2% (2,308)Unmarried:
51.8% (2,484)
Marital status - Black or African American population 15 years and over
Males 77.3% Never married19.0% Now married0.0% Separated0.0% Widowed3.7% DivorcedFemales 65.7% Never married15.7% Now married0.0% Separated18.5% Widowed0.0% DivorcedWomen who did not give birth in the past 12 months Now married:
13.2% (9)Unmarried:
86.8% (62)
Marital status - American Indian / Alaska Native population 15 years and over
Males 45.5% Never married52.3% Now married0.0% Separated0.0% Widowed2.3% DivorcedFemales 23.7% Never married55.2% Now married0.0% Separated9.8% Widowed11.4% DivorcedWomen who gave birth in the past 12 months Now married:
100.0% (57)Unmarried:
0.0% (0)
Women who did not give birth in the past 12 months Now married:
59.9% (143)Unmarried:
40.1% (95)
Marital status - Asian population 15 years and over
Males 15.8% Never married66.7% Now married0.0% Separated0.0% Widowed17.5% DivorcedFemales 22.7% Never married77.3% Now married0.0% Separated0.0% Widowed0.0% DivorcedWomen who did not give birth in the past 12 months Now married:
58.3% (14)Unmarried:
41.7% (10)
Marital status - Other race population 15 years and over
Males 23.7% Never married73.5% Now married0.0% Separated0.0% Widowed2.8% DivorcedFemales 55.0% Never married45.0% Now married0.0% Separated0.0% Widowed0.0% DivorcedWomen who did not give birth in the past 12 months Now married:
41.7% (50)Unmarried:
58.3% (70)
Marital status - Two or more races population 15 years and over
Males 40.1% Never married58.1% Now married0.0% Separated0.0% Widowed1.8% DivorcedFemales 20.3% Never married68.3% Now married0.0% Separated4.5% Widowed6.9% DivorcedWomen who gave birth in the past 12 months Now married:
80.9% (56)Unmarried:
19.1% (13)
Women who did not give birth in the past 12 months Now married:
63.5% (372)Unmarried:
36.5% (213)
Marital status - White alone, not Hispanic / Latino population 15 years and over
Males 27.6% Never married54.8% Now married0.4% Separated3.2% Widowed13.9% DivorcedFemales 21.8% Never married52.6% Now married1.7% Separated9.9% Widowed13.9% DivorcedWomen who gave birth in the past 12 months Now married:
44.8% (131)Unmarried:
55.2% (162)
Women who did not give birth in the past 12 months Now married:
50.0% (2,213)Unmarried:
50.0% (2,210)
Marital status - Hispanic or Latino population 15 years and over
Males 36.1% Never married52.3% Now married0.0% Separated5.8% Widowed5.8% DivorcedFemales 51.6% Never married38.5% Now married0.0% Separated5.4% Widowed4.5% DivorcedWomen who gave birth in the past 12 months Now married:
100.0% (75)Unmarried:
0.0% (0)
Women who did not give birth in the past 12 months Now married:
25.5% (143)Unmarried:
74.5% (417)
Ancestries in Yukon
2,496 19.0% English2,057 15.7% American1,151 8.8% Irish1,089 8.3% German568 4.3% European175 1.3% Norwegian157 1.2% Scottish141 1.1% British138 1.1% Dutch123 0.9% Italian119 0.9% Scotch-Irish69 0.5% Scandinavian68 0.5% Polish60 0.5% French44 0.3% French Canadian39 0.3% Albanian38 0.3% Swedish37 0.3% Czech35 0.3% Swiss31 0.2% Canadian23 0.2% Greek22 0.2% Northern European21 0.2% Austrian20 0.2% Czechoslovakian19 0.1% Welsh18 0.1% Iranian16 0.1% Russian12 0.09% Cajun9 0.07% Lebanese6 0.05% Brazilian4 0.03% Danish4 0.03% Ukrainian1 0.01% Slovak
Geographical mobility in Yukon Same house 1 year ago 17,919 86.5% White (Caucasian)430 100.0% Black or African American777 82.3% American Indian / Alaska Native122 92.8% Asian20 100.0% Native Hawaiian / Pacific Islander573 77.3% Other race2,501 82.0% Two or more races17,188 86.9% White alone, not Hispanic / Latino2,042 78.0% Hispanic or LatinoMoved within same county 1,122 5.4% White / Caucasian130 13.8% American Indian / Alaska Native10 7.4% Asian171 5.6% Two or more races1,073 5.4% White alone, not Hispanic / Latino83 3.2% Hispanic or LatinoMoved within same state 1,116 5.4% White / Caucasian28 2.9% American Indian / Alaska Native140 18.9% Other race227 7.4% Two or more races1,075 5.4% White alone, not Hispanic / Latino359 13.7% Hispanic or LatinoMoved from different state 244 1.2% White / Caucasian51 1.7% Two or more races199 1.0% White alone, not Hispanic / Latino56 2.1% Hispanic or LatinoMoved from abroad 11 0.1% White36 1.2% Two or more races5 0.0% White alone, not Hispanic / Latino20 0.8% Hispanic or Latino
Children Nativity (place of birth) in Yukon
Children under 6 years - Living with two parents Both parents native 1,159 100.0% NativeBoth parents foreign-born 13 100.0% NativeOne native, one foreign-born parent 160 100.0% NativeChildren under 6 years - Living with one parent Native parent 380 100.0% NativeChildren 6 to 17 years - Living with two parents Both parents native 2,447 99.5% Native13 0.5% Foreign-bornBoth parents foreign-born 44 100.0% NativeOne native, one foreign-born parent 210 100.0% NativeChildren 6 to 17 years - Living with one parent Native parent 990 100.0% NativeForeign-born parent 127 49.7% Native129 50.3% Foreign-born
Grandparents responsible for own grandchildren in Yukon
Grandparents (30 to 59 years) White / Caucasian 100 40.4% Responsible for grandchildren148 59.6% Not responsible for grandchildrenWhite alone, not Hispanic / Latino 100 38.9% Responsible for grandchildren157 61.1% Not responsible for grandchildrenGrandparents (60 years and over) White / Caucasian 17 20.2% Responsible for grandchildren67 79.8% Not responsible for grandchildrenWhite alone, not Hispanic / Latino 17 20.2% Responsible for grandchildren68 79.8% Not responsible for grandchildren