Races in York, Pennsylvania (PA) Detailed Stats
Data:
Races - White alone (%)
Races - White alone (% change since 2000)
Races - Black alone (%)
Races - Black alone (% change since 2000)
Races - American Indian alone (%)
Races - American Indian alone (% change since 2000)
Races - Asian alone (%)
Races - Asian alone (% change since 2000)
Races - Hispanic (%)
Races - Hispanic (% change since 2000)
Races - Native Hawaiian and Other Pacific Islander alone (%)
Races - Native Hawaiian and Other Pacific Islander alone (% change since 2000)
Races - Two or more races(%)
Races - Two or more races(% change since 2000)
Races - Other race alone (%)
Races - Other race alone (% change since 2000)
Racial diversity
Place of birth - Born in state of residence (%)
Place of birth - Born in state of residence (%) - White
Place of birth - Born in state of residence (%) - Black or African American
Place of birth - Born in state of residence (%) - Asian
Place of birth - Born in state of residence (%) - Hispanic or Latino
Place of birth - Born in state of residence (%) - American Indian and Alaska Native
Place of birth - Born in state of residence (%) - Multirace
Place of birth - Born in state of residence (%) - Other Race
Place of birth - Born in other state (%)
Place of birth - Born in other state (%) - White
Place of birth - Born in other state (%) - Black or African American
Place of birth - Born in other state (%) - Asian
Place of birth - Born in other state (%) - Hispanic or Latino
Place of birth - Born in other state (%) - American Indian and Alaska Native
Place of birth - Born in other state (%) - Multirace
Place of birth - Born in other state (%) - Other Race
Place of birth - Native, outside of US (%)
Place of birth - Native, outside of US (%) - White
Place of birth - Native, outside of US (%) - Black or African American
Place of birth - Native, outside of US (%) - Asian
Place of birth - Native, outside of US (%) - Hispanic or Latino
Place of birth - Native, outside of US (%) - American Indian and Alaska Native
Place of birth - Native, outside of US (%) - Multirace
Place of birth - Native, outside of US (%) - Other Race
Place of birth - Foreign born (%)
Place of birth - Foreign born (%) - White
Place of birth - Foreign born (%) - Black or African American
Place of birth - Foreign born (%) - Asian
Place of birth - Foreign born (%) - Hispanic or Latino
Place of birth - Foreign born (%) - American Indian and Alaska Native
Place of birth - Foreign born (%) - Multirace
Place of birth - Foreign born (%) - Other Race
Residents speaking English at home (%)
Residents speaking English at home - Born in the United States (%)
Residents speaking English at home - Native, born elsewhere (%)
Residents speaking English at home - Foreign born (%)
Residents speaking Spanish at home (%)
Residents speaking Spanish at home - Born in the United States (%)
Residents speaking Spanish at home - Native, born elsewhere (%)
Residents speaking Spanish at home - Foreign born (%)
Residents speaking other language at home (%)
Residents speaking other language at home - Born in the United States (%)
Residents speaking other language at home - Native, born elsewhere (%)
Residents speaking other language at home - Foreign born (%)
Marital status - Never married (%)
Marital status - Now married (%)
Marital status - Separated (%)
Marital status - Widowed (%)
Marital status - Divorced (%)
Ancestries Reported - Arab (%)
Ancestries Reported - Czech (%)
Ancestries Reported - Danish (%)
Ancestries Reported - Dutch (%)
Ancestries Reported - English (%)
Ancestries Reported - French (%)
Ancestries Reported - French Canadian (%)
Ancestries Reported - German (%)
Ancestries Reported - Greek (%)
Ancestries Reported - Hungarian (%)
Ancestries Reported - Irish (%)
Ancestries Reported - Italian (%)
Ancestries Reported - Lithuanian (%)
Ancestries Reported - Norwegian (%)
Ancestries Reported - Polish (%)
Ancestries Reported - Portuguese (%)
Ancestries Reported - Russian (%)
Ancestries Reported - Scotch-Irish (%)
Ancestries Reported - Scottish (%)
Ancestries Reported - Slovak (%)
Ancestries Reported - Subsaharan African (%)
Ancestries Reported - Swedish (%)
Ancestries Reported - Swiss (%)
Ancestries Reported - Ukrainian (%)
Ancestries Reported - United States (%)
Ancestries Reported - Welsh (%)
Ancestries Reported - West Indian (%)
Ancestries Reported - Other (%)
Geographical mobility - Same house 1 year ago (%)
Geographical mobility - Same house 1 year ago (%) - White
Geographical mobility - Same house 1 year ago (%) - Black or African American
Geographical mobility - Same house 1 year ago (%) - Asian
Geographical mobility - Same house 1 year ago (%) - Hispanic or Latino
Geographical mobility - Same house 1 year ago (%) - American Indian and Alaska Native
Geographical mobility - Same house 1 year ago (%) - Multirace
Geographical mobility - Same house 1 year ago (%) - Other Race
Geographical mobility - Moved within same county (%)
Geographical mobility - Moved within same county (%) - White
Geographical mobility - Moved within same county (%) - Black or African American
Geographical mobility - Moved within same county (%) - Asian
Geographical mobility - Moved within same county (%) - Hispanic or Latino
Geographical mobility - Moved within same county (%) - American Indian and Alaska Native
Geographical mobility - Moved within same county (%) - Multirace
Geographical mobility - Moved within same county (%) - Other Race
Geographical mobility - Moved from different county within same state (%)
Geographical mobility - Moved from different county within same state (%) - White
Geographical mobility - Moved from different county within same state (%) - Black or African American
Geographical mobility - Moved from different county within same state (%) - Asian
Geographical mobility - Moved from different county within same state (%) - Hispanic or Latino
Geographical mobility - Moved from different county within same state (%) - American Indian and Alaska Native
Geographical mobility - Moved from different county within same state (%) - Multirace
Geographical mobility - Moved from different county within same state (%) - Other Race
Geographical mobility - Moved from different state (%)
Geographical mobility - Moved from different state (%) - White
Geographical mobility - Moved from different state (%) - Black or African American
Geographical mobility - Moved from different state (%) - Asian
Geographical mobility - Moved from different state (%) - Hispanic or Latino
Geographical mobility - Moved from different state (%) - American Indian and Alaska Native
Geographical mobility - Moved from different state (%) - Multirace
Geographical mobility - Moved from different state (%) - Other Race
Geographical mobility - Moved from abroad (%)
Geographical mobility - Moved from abroad (%) - White
Geographical mobility - Moved from abroad (%) - Black or African American
Geographical mobility - Moved from abroad (%) - Asian
Geographical mobility - Moved from abroad (%) - Hispanic or Latino
Geographical mobility - Moved from abroad (%) - American Indian and Alaska Native
Geographical mobility - Moved from abroad (%) - Multirace
Geographical mobility - Moved from abroad (%) - Other Race
Place of birth for the foreign-born population - Ireland (%)
Place of birth for the foreign-born population - Denmark (%)
Place of birth for the foreign-born population - Norway (%)
Place of birth for the foreign-born population - Sweden (%)
Place of birth for the foreign-born population - United Kingdom (%)
Place of birth for the foreign-born population - England (%)
Place of birth for the foreign-born population - Scotland (%)
Place of birth for the foreign-born population - Other Northern Europe (%)
Place of birth for the foreign-born population - Austria (%)
Place of birth for the foreign-born population - Belgium (%)
Place of birth for the foreign-born population - France (%)
Place of birth for the foreign-born population - Germany (%)
Place of birth for the foreign-born population - Netherlands (%)
Place of birth for the foreign-born population - Switzerland (%)
Place of birth for the foreign-born population - Other Western Europe (%)
Place of birth for the foreign-born population - Greece (%)
Place of birth for the foreign-born population - Italy (%)
Place of birth for the foreign-born population - Portugal (%)
Place of birth for the foreign-born population - Spain (%)
Place of birth for the foreign-born population - Other Southern Europe (%)
Place of birth for the foreign-born population - Albania (%)
Place of birth for the foreign-born population - Belarus (%)
Place of birth for the foreign-born population - Bosnia and Herzegovina (%)
Place of birth for the foreign-born population - Bulgaria (%)
Place of birth for the foreign-born population - Croatia (%)
Place of birth for the foreign-born population - Czechoslovakia (%)
Place of birth for the foreign-born population - Hungary (%)
Place of birth for the foreign-born population - Latvia (%)
Place of birth for the foreign-born population - Lithuania (%)
Place of birth for the foreign-born population - North Macedonia (Macedonia) (%)
Place of birth for the foreign-born population - Moldova (%)
Place of birth for the foreign-born population - Poland (%)
Place of birth for the foreign-born population - Romania (%)
Place of birth for the foreign-born population - Russia (%)
Place of birth for the foreign-born population - Serbia (%)
Place of birth for the foreign-born population - Ukraine (%)
Place of birth for the foreign-born population - Other Eastern Europe (%)
Place of birth for the foreign-born population - China (%)
Place of birth for the foreign-born population - Hong Kong (%)
Place of birth for the foreign-born population - Taiwan (%)
Place of birth for the foreign-born population - Japan (%)
Place of birth for the foreign-born population - Korea (%)
Place of birth for the foreign-born population - Other Eastern Asia (%)
Place of birth for the foreign-born population - Afghanistan (%)
Place of birth for the foreign-born population - Bangladesh (%)
Place of birth for the foreign-born population - India (%)
Place of birth for the foreign-born population - Iran (%)
Place of birth for the foreign-born population - Kazakhstan (%)
Place of birth for the foreign-born population - Nepal (%)
Place of birth for the foreign-born population - Pakistan (%)
Place of birth for the foreign-born population - Sri Lanka (%)
Place of birth for the foreign-born population - Uzbekistan (%)
Place of birth for the foreign-born population - Other South Central Asia (%)
Place of birth for the foreign-born population - Burma (%)
Place of birth for the foreign-born population - Cambodia (%)
Place of birth for the foreign-born population - Indonesia (%)
Place of birth for the foreign-born population - Laos (%)
Place of birth for the foreign-born population - Malaysia (%)
Place of birth for the foreign-born population - Philippines (%)
Place of birth for the foreign-born population - Singapore (%)
Place of birth for the foreign-born population - Thailand (%)
Place of birth for the foreign-born population - Vietnam (%)
Place of birth for the foreign-born population - Other South Eastern Asia (%)
Place of birth for the foreign-born population - Armenia (%)
Place of birth for the foreign-born population - Iraq (%)
Place of birth for the foreign-born population - Israel (%)
Place of birth for the foreign-born population - Jordan (%)
Place of birth for the foreign-born population - Kuwait (%)
Place of birth for the foreign-born population - Lebanon (%)
Place of birth for the foreign-born population - Saudi Arabia (%)
Place of birth for the foreign-born population - Syria (%)
Place of birth for the foreign-born population - Turkey (%)
Place of birth for the foreign-born population - Yemen (%)
Place of birth for the foreign-born population - Other Western Asia (%)
Place of birth for the foreign-born population - Eritrea (%)
Place of birth for the foreign-born population - Ethiopia (%)
Place of birth for the foreign-born population - Kenya (%)
Place of birth for the foreign-born population - Somalia (%)
Place of birth for the foreign-born population - Uganda (%)
Place of birth for the foreign-born population - Zimbabwe (%)
Place of birth for the foreign-born population - Other Eastern Africa (%)
Place of birth for the foreign-born population - Cameroon (%)
Place of birth for the foreign-born population - Congo (%)
Place of birth for the foreign-born population - Democratic Republic of Congo (Zaire) (%)
Place of birth for the foreign-born population - Other Middle Africa (%)
Place of birth for the foreign-born population - Egypt (%)
Place of birth for the foreign-born population - Morocco (%)
Place of birth for the foreign-born population - Sudan (%)
Place of birth for the foreign-born population - Other Northern Africa (%)
Place of birth for the foreign-born population - South Africa (%)
Place of birth for the foreign-born population - Other Southern Africa (%)
Place of birth for the foreign-born population - Cabo Verde (%)
Place of birth for the foreign-born population - Ghana (%)
Place of birth for the foreign-born population - Liberia (%)
Place of birth for the foreign-born population - Nigeria (%)
Place of birth for the foreign-born population - Senegal (%)
Place of birth for the foreign-born population - Sierra Leone (%)
Place of birth for the foreign-born population - Other Western Africa (%)
Place of birth for the foreign-born population - Australia (%)
Place of birth for the foreign-born population - New Zealand (%)
Place of birth for the foreign-born population - Fiji (%)
Place of birth for the foreign-born population - Micronesia (%)
Place of birth for the foreign-born population - Bahamas (%)
Place of birth for the foreign-born population - Barbados (%)
Place of birth for the foreign-born population - Cuba (%)
Place of birth for the foreign-born population - Dominica (%)
Place of birth for the foreign-born population - Dominican Republic (%)
Place of birth for the foreign-born population - Grenada (%)
Place of birth for the foreign-born population - Haiti (%)
Place of birth for the foreign-born population - Jamaica (%)
Place of birth for the foreign-born population - St. Vincent and the Grenadines (%)
Place of birth for the foreign-born population - Trinidad and Tobago (%)
Place of birth for the foreign-born population - West Indies (%)
Place of birth for the foreign-born population - Other Caribbean (%)
Place of birth for the foreign-born population - Belize (%)
Place of birth for the foreign-born population - Costa Rica (%)
Place of birth for the foreign-born population - El Salvador (%)
Place of birth for the foreign-born population - Guatemala (%)
Place of birth for the foreign-born population - Honduras (%)
Place of birth for the foreign-born population - Mexico (%)
Place of birth for the foreign-born population - Nicaragua (%)
Place of birth for the foreign-born population - Panama (%)
Place of birth for the foreign-born population - Other Central America (%)
Place of birth for the foreign-born population - Argentina (%)
Place of birth for the foreign-born population - Bolivia (%)
Place of birth for the foreign-born population - Brazil (%)
Place of birth for the foreign-born population - Chile (%)
Place of birth for the foreign-born population - Colombia (%)
Place of birth for the foreign-born population - Ecuador (%)
Place of birth for the foreign-born population - Guyana (%)
Place of birth for the foreign-born population - Peru (%)
Place of birth for the foreign-born population - Uruguay (%)
Place of birth for the foreign-born population - Venezuela (%)
Place of birth for the foreign-born population - Other South America (%)
Place of birth for the foreign-born population - Canada (%)
Place of birth for the foreign-born population - Other Northern America (%)
Place of birth for the foreign-born population - Other (%)
Latest news about races in York, PA collected exclusively by city-data.com from local newspapers, TV, and radio stations
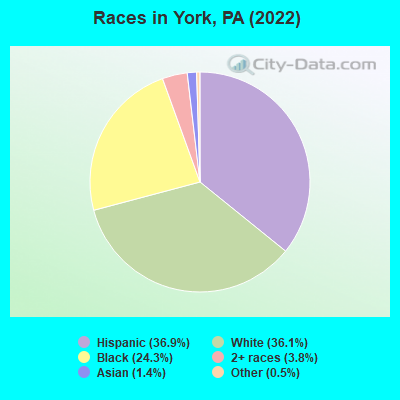
According to 2022 data, the most numerous races in York, PA are White alone (16,323 residents), Black alone (10,971 residents), and Hispanic (16,662 residents). 71.4% of York residents speak English at home. 11.1% of York, PA residents are foreign-born (8.8% born in Latin America, 1.2% born in Asia), which is 36.8% greater than the foreign-born rate of 7.0% across the entire state of Pennsylvania.
Race distribution in York
2000 2022
10,322,455 84.1% White alone 1,202,437 9.8% Black alone 394,088 3.2% Hispanic 218,296 1.8% Asian alone 113,097 0.9% Two or more races 13,086 0.1% Other race alone 14,904 0.1% American Indian alone 2,691 0.02% Native Hawaiian and Other
9,487,228 73.1% White alone 1,311,581 10.1% Black alone 1,115,997 8.6% Hispanic 493,942 3.8% Two or more races 487,124 3.8% Asian alone 63,582 0.5% Other race alone 10,130 0.08% American Indian alone 2,424 0.02% Native Hawaiian and Other
Income and house value in York Median household income in 2022 $48,334 White non-Hispanic householders$29,132 Black householders$32,982 American Indian and Alaska Native householders$73,431 Asian householders$62,623 Some other race householders$37,909 Two or more races householders$41,101 Hispanic or Latino race householdersMedian 2022 house value $101,875 White Non-Hispanic householders$94,243 Black or African American householders $126,013 Asian householders$168,609 Native Hawaiian and other Pacific Islander householders$84,127 Some other race householders$112,879 Two or more races householders$92,823 Hispanic or Latino householders
Median age by race in York
39.1 Median age for White residents38.0 39.7 36.2 Median age for Black or African American residents32.0 39.2 38.6 Median age for American Indian / Alaska Native residents67.1 45.5 56.1 Median age for Asian residents46.7 56.6 -680,432,644.4 Median age for Native Hawaiian / Pacific Islander residents-649,523,808.9 -747,474,746.7 28.6 Median age for Other race residents25.2 34.8 28.6 Median age for Two or more races residents24.3 29.7 44.9 Median age for White alone residents40.8 48.5 28.3 Median age for Hispanic or Latino residents26.7 29.6
Owner/renter occupied households by race in York
House owners and renters - White residents 5,253 50.0% Owner occupied5,260 50.0% Renter occupiedHouse owners and renters - Black or African American residents 1,386 34.8% Owner occupied2,593 65.2% Renter occupiedHouse owners and renters - American Indian / Alaska Native residents 38 38.9% Owner occupied59 61.1% Renter occupiedHouse owners and renters - Asian residents 283 76.9% Owner occupied85 23.1% Renter occupiedHouse owners and renters - Other race residents 1,145 63.3% Owner occupied664 36.7% Renter occupiedHouse owners and renters - Two or more races residents 584 25.1% Owner occupied1,738 74.9% Renter occupiedHouse owners and renters - White alone residents 4,604 54.2% Owner occupied3,890 45.8% Renter occupiedHouse owners and renters - Hispanic or Latino residents 2,243 42.2% Owner occupied3,072 57.8% Renter occupied
Language usage in York
English speakers - Total 71.4% of residents of York speak English at home.
28.6% of residents speak Spanish at home 7,223 59.4% Speak English very well4,946 40.6% Speak English less than very well2.8% of residents speak other language at home 633 53.6% Speak English very well548 46.4% Speak English less than very well
English speakers - Born in the United States 80.2% of residents of York speak English at home.
21.6% of residents speak Spanish at home 2,034 81.1% Speak English very well475 18.9% Speak English less than very well2.0% of residents speak other language at home 231 97.5% Speak English very well6 2.5% Speak English less than very well
English speakers - Native, born elsewhere 11.9% of residents of York speak English at home.
72.6% of residents speak Spanish at home 749 33.7% Speak English very well1,471 66.3% Speak English less than very well
English speakers - Foreign-born 21.9% of residents of York speak English at home.
65.4% of residents speak Spanish at home 1,317 36.5% Speak English very well2,290 63.5% Speak English less than very well13.5% of residents speak other language at home 274 36.7% Speak English very well472 63.3% Speak English less than very well
White (Caucasian) - Speak only English Native:
82.0% (16,302)Foreign-born:
16.3% (213)
White (Caucasian) - Speak another language Native:
14.0% (2,775)Foreign-born:
83.9% (1,100)
Black or African American - Speak only English Native:
90.3% (9,419)Foreign-born:
24.7% (252)
Black or African American - Speak another language Native:
10.6% (1,103)Foreign-born:
62.7% (638)
Asian - Speak only English Native:
49.1% (35)Foreign-born:
34.7% (226)
Asian - Speak another language Native:
51.0% (36)Foreign-born:
65.4% (426)
Other race - Speak only English Native:
23.0% (1,086)Foreign-born:
23.6% (419)
Other race - Speak another language Native:
78.4% (3,710)Foreign-born:
76.2% (1,354)
Two or more races - Speak only English Native:
61.6% (2,705)Foreign-born:
2.1% (22)
Two or more races - Speak another language Native:
47.0% (2,066)Foreign-born:
100.0% (1,025)
White alone - Speak only English Native:
97.0% (15,208)Foreign-born:
60.5% (104)
White alone - Speak another language Native:
3.4% (534)Foreign-born:
38.3% (66)
Hispanic or Latino - Speak only English Native:
29.3% (3,326)Foreign-born:
10.0% (390)
Hispanic or Latino - Speak another language Native:
72.5% (8,220)Foreign-born:
90.1% (3,497)
Foreign-born residents in York 5,004 residents are foreign born (8.8% Latin America , 1.2% Asia ).
This city:
11.1%Pennsylvania:
7.3%
Marital status for residents in York Marital status - White (Caucasian) population 15 years and over
Males 49.8% Never married30.3% Now married3.0% Separated3.6% Widowed13.3% DivorcedFemales 43.6% Never married27.4% Now married5.1% Separated10.5% Widowed13.5% DivorcedWomen who gave birth in the past 12 months Now married:
88.6% (229)Unmarried:
11.4% (29)
Women who did not give birth in the past 12 months Now married:
25.1% (1,333)Unmarried:
74.9% (3,975)
Marital status - Black or African American population 15 years and over
Males 59.1% Never married28.5% Now married2.0% Separated1.7% Widowed8.7% DivorcedFemales 51.2% Never married23.9% Now married5.0% Separated9.9% Widowed9.9% DivorcedWomen who gave birth in the past 12 months Now married:
23.3% (41)Unmarried:
76.7% (134)
Women who did not give birth in the past 12 months Now married:
28.0% (756)Unmarried:
72.0% (1,942)
Marital status - American Indian / Alaska Native population 15 years and over
Males 19.4% Never married0.0% Now married0.0% Separated19.4% Widowed61.3% DivorcedFemales 28.8% Never married39.0% Now married0.0% Separated6.8% Widowed25.4% DivorcedWomen who did not give birth in the past 12 months Now married:
48.6% (31)Unmarried:
51.4% (33)
Marital status - Asian population 15 years and over
Males 33.3% Never married66.7% Now married0.0% Separated0.0% Widowed0.0% DivorcedFemales 23.6% Never married41.4% Now married0.0% Separated0.0% Widowed35.1% DivorcedWomen who did not give birth in the past 12 months Now married:
43.4% (64)Unmarried:
56.6% (83)
Marital status - Other race population 15 years and over
Males 57.3% Never married32.3% Now married2.7% Separated1.3% Widowed6.4% DivorcedFemales 43.5% Never married32.5% Now married3.6% Separated6.9% Widowed13.5% DivorcedWomen who gave birth in the past 12 months Now married:
24.4% (90)Unmarried:
75.6% (278)
Women who did not give birth in the past 12 months Now married:
39.8% (554)Unmarried:
60.2% (838)
Marital status - Two or more races population 15 years and over
Males 51.8% Never married29.5% Now married3.7% Separated1.9% Widowed13.0% DivorcedFemales 48.4% Never married19.3% Now married5.8% Separated2.6% Widowed24.0% DivorcedWomen who gave birth in the past 12 months Now married:
59.2% (43)Unmarried:
40.8% (30)
Women who did not give birth in the past 12 months Now married:
18.8% (373)Unmarried:
81.2% (1,610)
Marital status - White alone, not Hispanic / Latino population 15 years and over
Males 49.4% Never married29.9% Now married1.8% Separated4.5% Widowed14.4% DivorcedFemales 40.9% Never married27.3% Now married4.8% Separated11.6% Widowed15.4% DivorcedWomen who gave birth in the past 12 months Now married:
96.7% (198)Unmarried:
3.3% (7)
Women who did not give birth in the past 12 months Now married:
23.0% (853)Unmarried:
77.0% (2,855)
Marital status - Hispanic or Latino population 15 years and over
Males 54.2% Never married32.4% Now married4.7% Separated1.1% Widowed7.6% DivorcedFemales 46.1% Never married30.2% Now married5.1% Separated5.5% Widowed13.1% DivorcedWomen who gave birth in the past 12 months Now married:
38.0% (165)Unmarried:
62.0% (269)
Women who did not give birth in the past 12 months Now married:
32.5% (1,347)Unmarried:
67.5% (2,794)
Ancestries in York
3,004 12.3% German1,697 6.9% American631 2.6% English361 1.5% Irish360 1.5% Italian311 1.3% African246 1.0% Jamaican156 0.6% European110 0.4% Pennsylvania German105 0.4% Lebanese96 0.4% Slovak95 0.4% Polish92 0.4% Haitian63 0.3% Scotch-Irish58 0.2% Northern European50 0.2% French46 0.2% Hungarian46 0.2% U.S. Virgin Islander45 0.2% Dutch45 0.2% French Canadian45 0.2% Greek45 0.2% Kenyan37 0.2% Egyptian31 0.1% Scottish27 0.1% Swedish26 0.1% Welsh24 0.10% British19 0.08% Ghanaian13 0.05% Eastern European7 0.03% Swiss5 0.02% Romanian3 0.01% Canadian
Geographical mobility in York Same house 1 year ago 18,148 82.6% White (Caucasian)9,874 82.9% Black or African American210 95.1% American Indian / Alaska Native629 92.8% Asian4,894 87.8% Other race4,706 81.9% Two or more races13,480 83.5% White alone, not Hispanic / Latino12,980 80.3% Hispanic or LatinoMoved within same county 2,261 10.3% White / Caucasian907 7.6% Black or African American27 4.0% Asian237 4.2% Other race614 10.7% Two or more races1,723 10.7% White alone, not Hispanic / Latino1,877 11.6% Hispanic or LatinoMoved within same state 444 2.0% White / Caucasian195 1.6% Black or African American6 2.6% American Indian / Alaska Native21 3.0% Asian70 1.3% Other race130 2.3% Two or more races323 2.0% White alone, not Hispanic / Latino346 2.1% Hispanic or LatinoMoved from different state 800 3.6% White / Caucasian754 6.3% Black or African American5 0.8% Asian401 7.2% Other race184 3.2% Two or more races519 3.2% White alone, not Hispanic / Latino902 5.6% Hispanic or LatinoMoved from abroad 190 0.9% White22 0.2% Black or African American40 0.7% Other race56 0.3% White alone, not Hispanic / Latino112 0.7% Hispanic or Latino
Children Nativity (place of birth) in York
Children under 6 years - Living with two parents Both parents native 736 100.0% NativeBoth parents foreign-born 141 100.0% NativeOne native, one foreign-born parent 151 100.0% NativeChildren under 6 years - Living with one parent Native parent 1,600 100.0% NativeForeign-born parent 231 65.8% Native120 34.2% Foreign-bornChildren 6 to 17 years - Living with two parents Both parents native 2,027 100.0% NativeBoth parents foreign-born 381 66.8% Native189 33.2% Foreign-bornOne native, one foreign-born parent 39 19.8% Native158 80.2% Foreign-bornChildren 6 to 17 years - Living with one parent Native parent 3,508 100.0% NativeForeign-born parent 237 41.1% Native340 58.9% Foreign-born
Grandparents responsible for own grandchildren in York
Grandparents (30 to 59 years) White / Caucasian 160 60.7% Responsible for grandchildren104 39.3% Not responsible for grandchildrenBlack or African American 117 72.9% Responsible for grandchildren43 27.1% Not responsible for grandchildrenOther race 72 100.0% Not responsible for grandchildrenTwo or more races 44 27.8% Responsible for grandchildren114 72.2% Not responsible for grandchildrenWhite alone, not Hispanic / Latino 86 50.0% Responsible for grandchildren86 50.0% Not responsible for grandchildrenHispanic or Latino 90 29.5% Responsible for grandchildren214 70.5% Not responsible for grandchildrenGrandparents (60 years and over) White / Caucasian 42 21.1% Responsible for grandchildren156 78.9% Not responsible for grandchildrenBlack or African American 10 23.7% Responsible for grandchildren34 76.3% Not responsible for grandchildrenOther race 3 2.8% Responsible for grandchildren113 97.2% Not responsible for grandchildrenTwo or more races 48 38.8% Responsible for grandchildren76 61.2% Not responsible for grandchildrenWhite alone, not Hispanic / Latino 43 32.5% Responsible for grandchildren88 67.5% Not responsible for grandchildrenHispanic or Latino 32 11.4% Responsible for grandchildren249 88.6% Not responsible for grandchildren