Races in Wyoming, Michigan (MI) Detailed Stats
Data:
Races - White alone (%)
Races - White alone (% change since 2000)
Races - Black alone (%)
Races - Black alone (% change since 2000)
Races - American Indian alone (%)
Races - American Indian alone (% change since 2000)
Races - Asian alone (%)
Races - Asian alone (% change since 2000)
Races - Hispanic (%)
Races - Hispanic (% change since 2000)
Races - Native Hawaiian and Other Pacific Islander alone (%)
Races - Native Hawaiian and Other Pacific Islander alone (% change since 2000)
Races - Two or more races(%)
Races - Two or more races(% change since 2000)
Races - Other race alone (%)
Races - Other race alone (% change since 2000)
Racial diversity
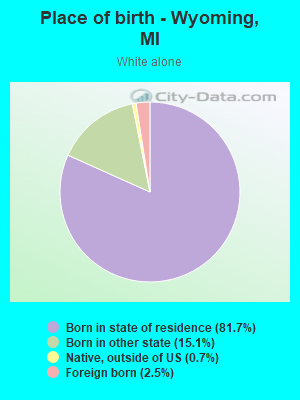
Place of birth - Born in state of residence (%)
Place of birth - Born in state of residence (%) - White
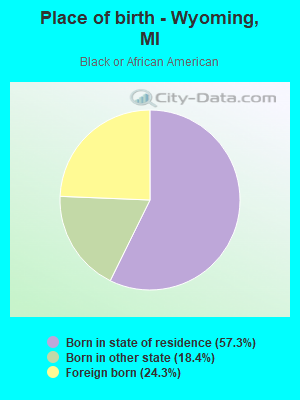
Place of birth - Born in state of residence (%) - Black or African American
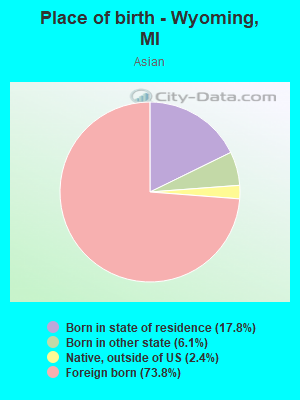
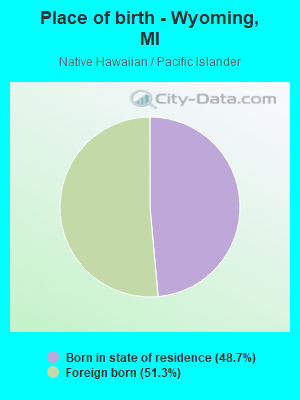
Place of birth - Born in state of residence (%) - Asian
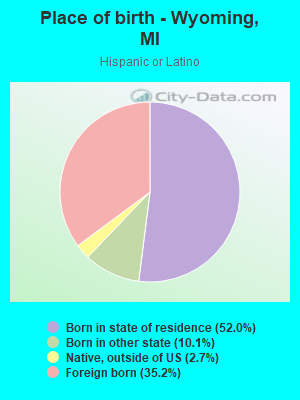
Place of birth - Born in state of residence (%) - Hispanic or Latino
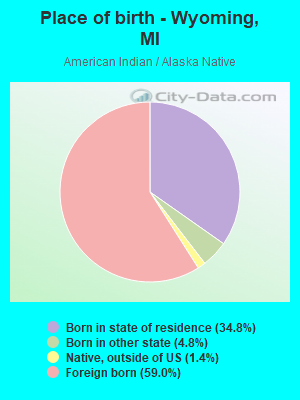
Place of birth - Born in state of residence (%) - American Indian and Alaska Native
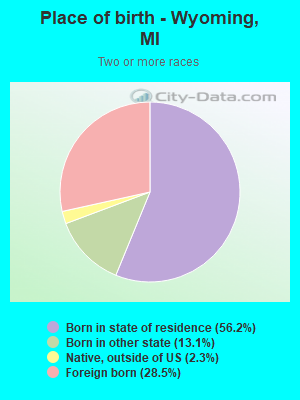
Place of birth - Born in state of residence (%) - Multirace
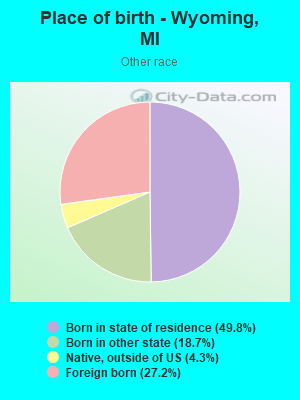
Place of birth - Born in state of residence (%) - Other Race
Place of birth - Born in other state (%)
Place of birth - Born in other state (%) - White
Place of birth - Born in other state (%) - Black or African American
Place of birth - Born in other state (%) - Asian
Place of birth - Born in other state (%) - Hispanic or Latino
Place of birth - Born in other state (%) - American Indian and Alaska Native
Place of birth - Born in other state (%) - Multirace
Place of birth - Born in other state (%) - Other Race
Place of birth - Native, outside of US (%)
Place of birth - Native, outside of US (%) - White
Place of birth - Native, outside of US (%) - Black or African American
Place of birth - Native, outside of US (%) - Asian
Place of birth - Native, outside of US (%) - Hispanic or Latino
Place of birth - Native, outside of US (%) - American Indian and Alaska Native
Place of birth - Native, outside of US (%) - Multirace
Place of birth - Native, outside of US (%) - Other Race
Place of birth - Foreign born (%)
Place of birth - Foreign born (%) - White
Place of birth - Foreign born (%) - Black or African American
Place of birth - Foreign born (%) - Asian
Place of birth - Foreign born (%) - Hispanic or Latino
Place of birth - Foreign born (%) - American Indian and Alaska Native
Place of birth - Foreign born (%) - Multirace
Place of birth - Foreign born (%) - Other Race
Residents speaking English at home (%)
Residents speaking English at home - Born in the United States (%)
Residents speaking English at home - Native, born elsewhere (%)
Residents speaking English at home - Foreign born (%)
Residents speaking Spanish at home (%)
Residents speaking Spanish at home - Born in the United States (%)
Residents speaking Spanish at home - Native, born elsewhere (%)
Residents speaking Spanish at home - Foreign born (%)
Residents speaking other language at home (%)
Residents speaking other language at home - Born in the United States (%)
Residents speaking other language at home - Native, born elsewhere (%)
Residents speaking other language at home - Foreign born (%)
Marital status - Never married (%)
Marital status - Now married (%)
Marital status - Separated (%)
Marital status - Widowed (%)
Marital status - Divorced (%)
Ancestries Reported - Arab (%)
Ancestries Reported - Czech (%)
Ancestries Reported - Danish (%)
Ancestries Reported - Dutch (%)
Ancestries Reported - English (%)
Ancestries Reported - French (%)
Ancestries Reported - French Canadian (%)
Ancestries Reported - German (%)
Ancestries Reported - Greek (%)
Ancestries Reported - Hungarian (%)
Ancestries Reported - Irish (%)
Ancestries Reported - Italian (%)
Ancestries Reported - Lithuanian (%)
Ancestries Reported - Norwegian (%)
Ancestries Reported - Polish (%)
Ancestries Reported - Portuguese (%)
Ancestries Reported - Russian (%)
Ancestries Reported - Scotch-Irish (%)
Ancestries Reported - Scottish (%)
Ancestries Reported - Slovak (%)
Ancestries Reported - Subsaharan African (%)
Ancestries Reported - Swedish (%)
Ancestries Reported - Swiss (%)
Ancestries Reported - Ukrainian (%)
Ancestries Reported - United States (%)
Ancestries Reported - Welsh (%)
Ancestries Reported - West Indian (%)
Ancestries Reported - Other (%)
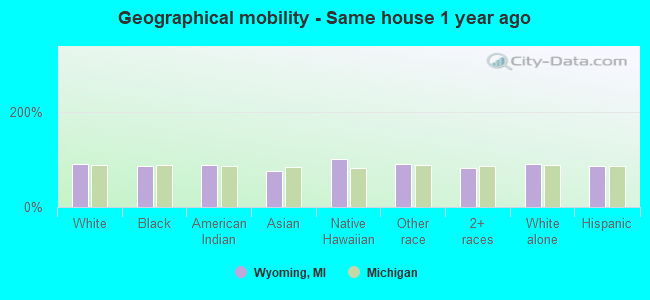
Geographical mobility - Same house 1 year ago (%)
Geographical mobility - Same house 1 year ago (%) - White
Geographical mobility - Same house 1 year ago (%) - Black or African American
Geographical mobility - Same house 1 year ago (%) - Asian
Geographical mobility - Same house 1 year ago (%) - Hispanic or Latino
Geographical mobility - Same house 1 year ago (%) - American Indian and Alaska Native
Geographical mobility - Same house 1 year ago (%) - Multirace
Geographical mobility - Same house 1 year ago (%) - Other Race
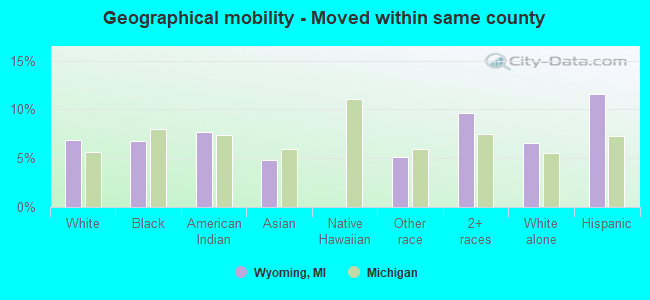
Geographical mobility - Moved within same county (%)
Geographical mobility - Moved within same county (%) - White
Geographical mobility - Moved within same county (%) - Black or African American
Geographical mobility - Moved within same county (%) - Asian
Geographical mobility - Moved within same county (%) - Hispanic or Latino
Geographical mobility - Moved within same county (%) - American Indian and Alaska Native
Geographical mobility - Moved within same county (%) - Multirace
Geographical mobility - Moved within same county (%) - Other Race
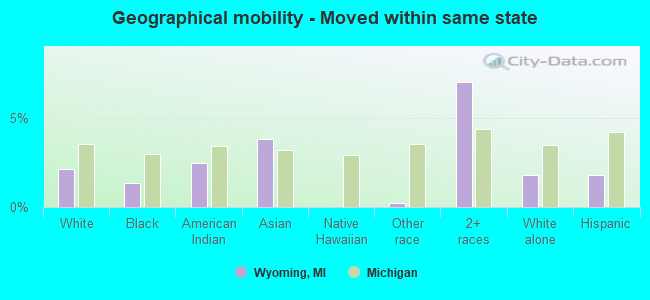
Geographical mobility - Moved from different county within same state (%)
Geographical mobility - Moved from different county within same state (%) - White
Geographical mobility - Moved from different county within same state (%) - Black or African American
Geographical mobility - Moved from different county within same state (%) - Asian
Geographical mobility - Moved from different county within same state (%) - Hispanic or Latino
Geographical mobility - Moved from different county within same state (%) - American Indian and Alaska Native
Geographical mobility - Moved from different county within same state (%) - Multirace
Geographical mobility - Moved from different county within same state (%) - Other Race
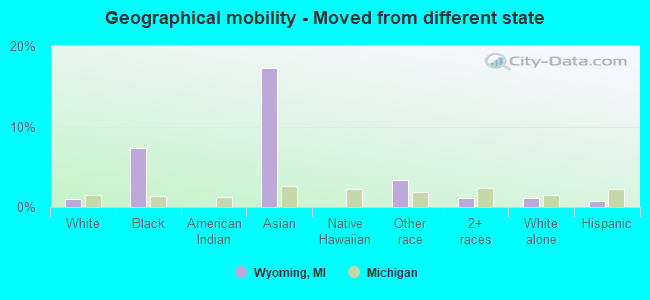
Geographical mobility - Moved from different state (%)
Geographical mobility - Moved from different state (%) - White
Geographical mobility - Moved from different state (%) - Black or African American
Geographical mobility - Moved from different state (%) - Asian
Geographical mobility - Moved from different state (%) - Hispanic or Latino
Geographical mobility - Moved from different state (%) - American Indian and Alaska Native
Geographical mobility - Moved from different state (%) - Multirace
Geographical mobility - Moved from different state (%) - Other Race
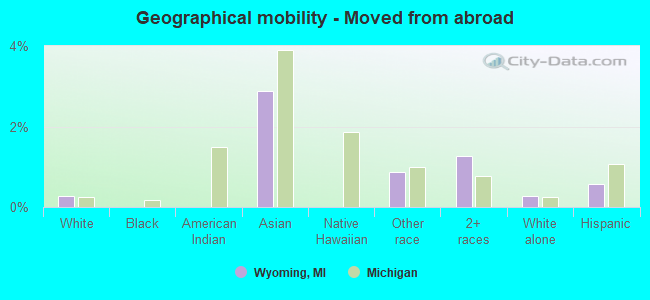
Geographical mobility - Moved from abroad (%)
Geographical mobility - Moved from abroad (%) - White
Geographical mobility - Moved from abroad (%) - Black or African American
Geographical mobility - Moved from abroad (%) - Asian
Geographical mobility - Moved from abroad (%) - Hispanic or Latino
Geographical mobility - Moved from abroad (%) - American Indian and Alaska Native
Geographical mobility - Moved from abroad (%) - Multirace
Geographical mobility - Moved from abroad (%) - Other Race
Place of birth for the foreign-born population - Ireland (%)
Place of birth for the foreign-born population - Denmark (%)
Place of birth for the foreign-born population - Norway (%)
Place of birth for the foreign-born population - Sweden (%)
Place of birth for the foreign-born population - United Kingdom (%)
Place of birth for the foreign-born population - England (%)
Place of birth for the foreign-born population - Scotland (%)
Place of birth for the foreign-born population - Other Northern Europe (%)
Place of birth for the foreign-born population - Austria (%)
Place of birth for the foreign-born population - Belgium (%)
Place of birth for the foreign-born population - France (%)
Place of birth for the foreign-born population - Germany (%)
Place of birth for the foreign-born population - Netherlands (%)
Place of birth for the foreign-born population - Switzerland (%)
Place of birth for the foreign-born population - Other Western Europe (%)
Place of birth for the foreign-born population - Greece (%)
Place of birth for the foreign-born population - Italy (%)
Place of birth for the foreign-born population - Portugal (%)
Place of birth for the foreign-born population - Spain (%)
Place of birth for the foreign-born population - Other Southern Europe (%)
Place of birth for the foreign-born population - Albania (%)
Place of birth for the foreign-born population - Belarus (%)
Place of birth for the foreign-born population - Bosnia and Herzegovina (%)
Place of birth for the foreign-born population - Bulgaria (%)
Place of birth for the foreign-born population - Croatia (%)
Place of birth for the foreign-born population - Czechoslovakia (%)
Place of birth for the foreign-born population - Hungary (%)
Place of birth for the foreign-born population - Latvia (%)
Place of birth for the foreign-born population - Lithuania (%)
Place of birth for the foreign-born population - North Macedonia (Macedonia) (%)
Place of birth for the foreign-born population - Moldova (%)
Place of birth for the foreign-born population - Poland (%)
Place of birth for the foreign-born population - Romania (%)
Place of birth for the foreign-born population - Russia (%)
Place of birth for the foreign-born population - Serbia (%)
Place of birth for the foreign-born population - Ukraine (%)
Place of birth for the foreign-born population - Other Eastern Europe (%)
Place of birth for the foreign-born population - China (%)
Place of birth for the foreign-born population - Hong Kong (%)
Place of birth for the foreign-born population - Taiwan (%)
Place of birth for the foreign-born population - Japan (%)
Place of birth for the foreign-born population - Korea (%)
Place of birth for the foreign-born population - Other Eastern Asia (%)
Place of birth for the foreign-born population - Afghanistan (%)
Place of birth for the foreign-born population - Bangladesh (%)
Place of birth for the foreign-born population - India (%)
Place of birth for the foreign-born population - Iran (%)
Place of birth for the foreign-born population - Kazakhstan (%)
Place of birth for the foreign-born population - Nepal (%)
Place of birth for the foreign-born population - Pakistan (%)
Place of birth for the foreign-born population - Sri Lanka (%)
Place of birth for the foreign-born population - Uzbekistan (%)
Place of birth for the foreign-born population - Other South Central Asia (%)
Place of birth for the foreign-born population - Burma (%)
Place of birth for the foreign-born population - Cambodia (%)
Place of birth for the foreign-born population - Indonesia (%)
Place of birth for the foreign-born population - Laos (%)
Place of birth for the foreign-born population - Malaysia (%)
Place of birth for the foreign-born population - Philippines (%)
Place of birth for the foreign-born population - Singapore (%)
Place of birth for the foreign-born population - Thailand (%)
Place of birth for the foreign-born population - Vietnam (%)
Place of birth for the foreign-born population - Other South Eastern Asia (%)
Place of birth for the foreign-born population - Armenia (%)
Place of birth for the foreign-born population - Iraq (%)
Place of birth for the foreign-born population - Israel (%)
Place of birth for the foreign-born population - Jordan (%)
Place of birth for the foreign-born population - Kuwait (%)
Place of birth for the foreign-born population - Lebanon (%)
Place of birth for the foreign-born population - Saudi Arabia (%)
Place of birth for the foreign-born population - Syria (%)
Place of birth for the foreign-born population - Turkey (%)
Place of birth for the foreign-born population - Yemen (%)
Place of birth for the foreign-born population - Other Western Asia (%)
Place of birth for the foreign-born population - Eritrea (%)
Place of birth for the foreign-born population - Ethiopia (%)
Place of birth for the foreign-born population - Kenya (%)
Place of birth for the foreign-born population - Somalia (%)
Place of birth for the foreign-born population - Uganda (%)
Place of birth for the foreign-born population - Zimbabwe (%)
Place of birth for the foreign-born population - Other Eastern Africa (%)
Place of birth for the foreign-born population - Cameroon (%)
Place of birth for the foreign-born population - Congo (%)
Place of birth for the foreign-born population - Democratic Republic of Congo (Zaire) (%)
Place of birth for the foreign-born population - Other Middle Africa (%)
Place of birth for the foreign-born population - Egypt (%)
Place of birth for the foreign-born population - Morocco (%)
Place of birth for the foreign-born population - Sudan (%)
Place of birth for the foreign-born population - Other Northern Africa (%)
Place of birth for the foreign-born population - South Africa (%)
Place of birth for the foreign-born population - Other Southern Africa (%)
Place of birth for the foreign-born population - Cabo Verde (%)
Place of birth for the foreign-born population - Ghana (%)
Place of birth for the foreign-born population - Liberia (%)
Place of birth for the foreign-born population - Nigeria (%)
Place of birth for the foreign-born population - Senegal (%)
Place of birth for the foreign-born population - Sierra Leone (%)
Place of birth for the foreign-born population - Other Western Africa (%)
Place of birth for the foreign-born population - Australia (%)
Place of birth for the foreign-born population - New Zealand (%)
Place of birth for the foreign-born population - Fiji (%)
Place of birth for the foreign-born population - Micronesia (%)
Place of birth for the foreign-born population - Bahamas (%)
Place of birth for the foreign-born population - Barbados (%)
Place of birth for the foreign-born population - Cuba (%)
Place of birth for the foreign-born population - Dominica (%)
Place of birth for the foreign-born population - Dominican Republic (%)
Place of birth for the foreign-born population - Grenada (%)
Place of birth for the foreign-born population - Haiti (%)
Place of birth for the foreign-born population - Jamaica (%)
Place of birth for the foreign-born population - St. Vincent and the Grenadines (%)
Place of birth for the foreign-born population - Trinidad and Tobago (%)
Place of birth for the foreign-born population - West Indies (%)
Place of birth for the foreign-born population - Other Caribbean (%)
Place of birth for the foreign-born population - Belize (%)
Place of birth for the foreign-born population - Costa Rica (%)
Place of birth for the foreign-born population - El Salvador (%)
Place of birth for the foreign-born population - Guatemala (%)
Place of birth for the foreign-born population - Honduras (%)
Place of birth for the foreign-born population - Mexico (%)
Place of birth for the foreign-born population - Nicaragua (%)
Place of birth for the foreign-born population - Panama (%)
Place of birth for the foreign-born population - Other Central America (%)
Place of birth for the foreign-born population - Argentina (%)
Place of birth for the foreign-born population - Bolivia (%)
Place of birth for the foreign-born population - Brazil (%)
Place of birth for the foreign-born population - Chile (%)
Place of birth for the foreign-born population - Colombia (%)
Place of birth for the foreign-born population - Ecuador (%)
Place of birth for the foreign-born population - Guyana (%)
Place of birth for the foreign-born population - Peru (%)
Place of birth for the foreign-born population - Uruguay (%)
Place of birth for the foreign-born population - Venezuela (%)
Place of birth for the foreign-born population - Other South America (%)
Place of birth for the foreign-born population - Canada (%)
Place of birth for the foreign-born population - Other Northern America (%)
Place of birth for the foreign-born population - Other (%)
Latest news about races in Wyoming, MI collected exclusively by city-data.com from local newspapers, TV, and radio stations
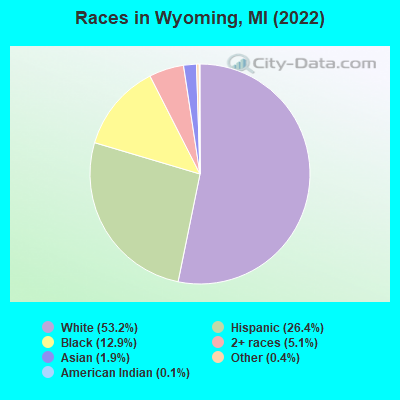
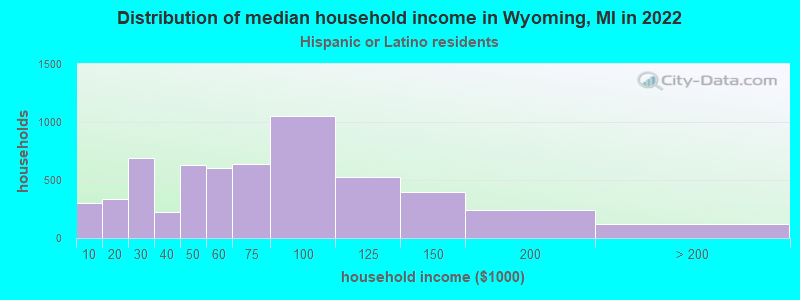
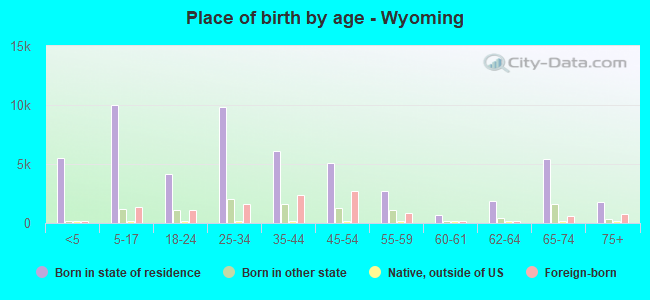
According to 2022 data, the most numerous races in Wyoming, MI are White alone (40,827 residents), Black alone (9,912 residents), and Hispanic (20,258 residents). 74.8% of Wyoming residents speak English at home. 12.6% of Wyoming, MI residents are foreign-born (8.6% born in Latin America, 1.9% born in Asia), which is 52.3% greater than the foreign-born rate of 6.0% across the entire state of Michigan.
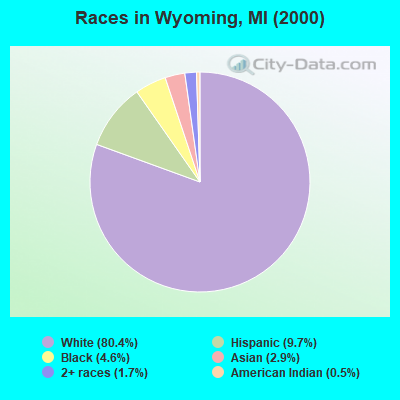
Race distribution in Wyoming
2000 2022
55,801 80.4% White alone 6,704 9.7% Hispanic 3,205 4.6% Black alone 2,015 2.9% Asian alone 1,212 1.7% Two or more races 348 0.5% American Indian alone 62 0.09% Other race alone 21 0.03% Native Hawaiian and Other
40,827 53.2% White alone 20,258 26.4% Hispanic 9,912 12.9% Black alone 3,880 5.1% Two or more races 1,471 1.9% Asian alone 297 0.4% Other race alone 85 0.1% American Indian alone
2000 2022
7,806,691 78.6% White alone 1,402,047 14.1% Black alone 323,877 3.3% Hispanic 175,311 1.8% Asian alone 163,487 1.6% Two or more races 53,421 0.5% American Indian alone 11,465 0.1% Other race alone 2,145 0.02% Native Hawaiian and Other
7,289,051 72.6% White alone 1,310,464 13.1% Black alone 572,405 5.7% Hispanic 450,031 4.5% Two or more races 335,732 3.3% Asian alone 45,217 0.5% Other race alone 29,011 0.3% American Indian alone 2,207 0.02% Native Hawaiian and Other
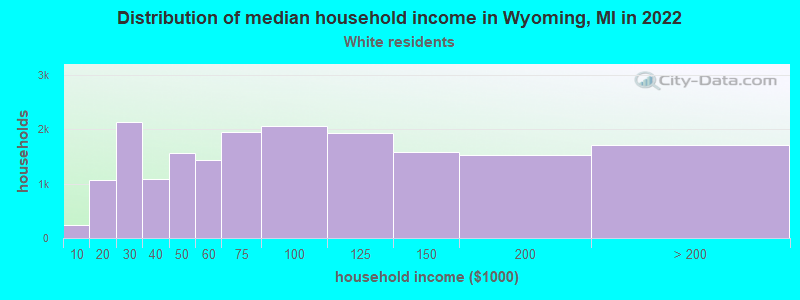
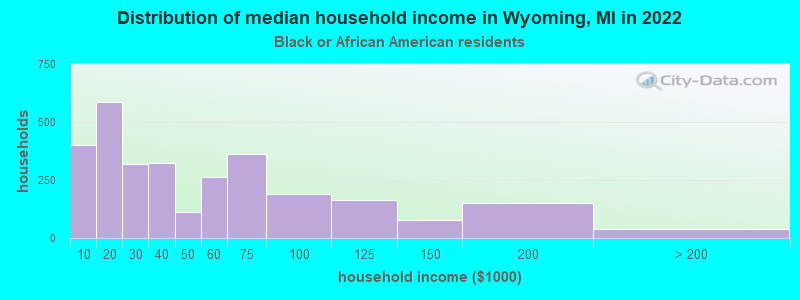
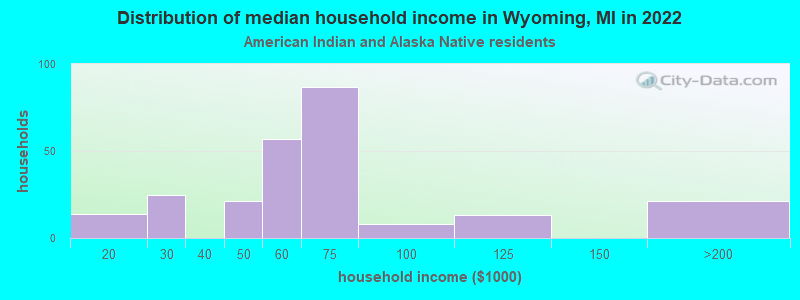
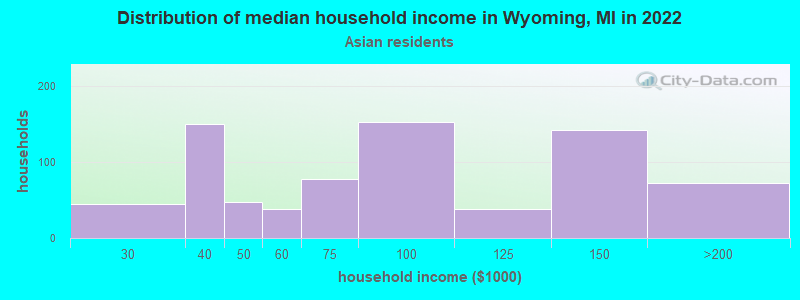
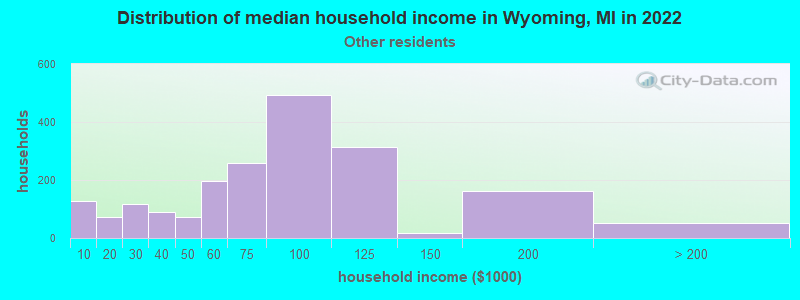
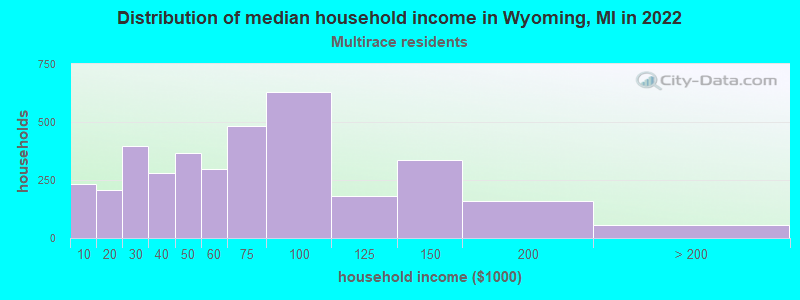
Income and house value in Wyoming Median household income in 2022 $74,893 White non-Hispanic householders$51,006 Black householders$51,842 American Indian and Alaska Native householders$66,435 Asian householders$85,317 Some other race householders$64,805 Two or more races householders$55,188 Hispanic or Latino race householdersMedian 2022 house value $231,379 White Non-Hispanic householders$218,704 Black or African American householders$216,964 American Indian or Alaska Native householders $263,936 Asian householders$221,935 Some other race householders$214,728 Two or more races householders$221,935 Hispanic or Latino householders
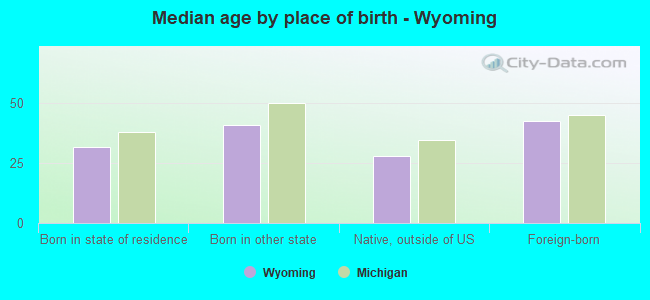
Median age by race in Wyoming
39.9 Median age for White residents39.2 41.2 30.1 Median age for Black or African American residents27.3 30.6 18.5 Median age for American Indian / Alaska Native residents21.6 17.0 39.2 Median age for Asian residents41.6 32.7 -666,666,666.0 Median age for Native Hawaiian / Pacific Islander residents-666,666,666.0 -666,666,666.0 31.8 Median age for Other race residents25.9 45.4 26.6 Median age for Two or more races residents26.3 26.7 40.9 Median age for White alone residents39.3 44.3 26.2 Median age for Hispanic or Latino residents25.4 26.3
Owner/renter occupied households by race in Wyoming
House owners and renters - White residents 13,490 73.8% Owner occupied4,795 26.2% Renter occupiedHouse owners and renters - Black or African American residents 890 33.6% Owner occupied1,762 66.4% Renter occupiedHouse owners and renters - American Indian / Alaska Native residents 299 81.8% Owner occupied67 18.2% Renter occupiedHouse owners and renters - Asian residents 554 69.7% Owner occupied241 30.3% Renter occupiedHouse owners and renters - Other race residents 644 66.3% Owner occupied327 33.7% Renter occupiedHouse owners and renters - Two or more races residents 2,340 57.9% Owner occupied1,704 42.1% Renter occupiedHouse owners and renters - White alone residents 13,066 74.8% Owner occupied4,393 25.2% Renter occupiedHouse owners and renters - Hispanic or Latino residents 3,187 59.6% Owner occupied2,161 40.4% Renter occupied
Language usage in Wyoming
English speakers - Total 74.8% of residents of Wyoming speak English at home.
18.5% of residents speak Spanish at home 6,689 50.8% Speak English very well6,476 49.2% Speak English less than very well6.6% of residents speak other language at home 1,694 35.9% Speak English very well3,023 64.1% Speak English less than very well
English speakers - Born in the United States 89.1% of residents of Wyoming speak English at home.
10.9% of residents speak Spanish at home 1,186 100.0% Speak English very well
English speakers - Native, born elsewhere 33.6% of residents of Wyoming speak English at home.
66.4% of residents speak Spanish at home 265 48.8% Speak English very well278 51.2% Speak English less than very well
English speakers - Foreign-born 7.1% of residents of Wyoming speak English at home.
57.7% of residents speak Spanish at home 1,622 24.2% Speak English very well5,081 75.8% Speak English less than very well35.2% of residents speak other language at home 1,164 28.4% Speak English very well2,930 71.6% Speak English less than very well
White (Caucasian) - Speak only English Native:
96.6% (37,818)Foreign-born:
19.1% (325)
White (Caucasian) - Speak another language Native:
3.4% (1,350)Foreign-born:
80.9% (1,376)
Black or African American - Speak only English Native:
91.3% (5,815)Foreign-born:
14.2% (138)
Black or African American - Speak another language Native:
9.4% (602)Foreign-born:
86.2% (839)
American Indian / Alaska Native - Speak another language Native:
100.0% (430)Foreign-born:
100.0% (809)
Asian - Speak only English Native:
47.9% (206)Foreign-born:
19.6% (307)
Asian - Speak another language Native:
52.1% (224)Foreign-born:
80.4% (1,256)
Other race - Speak only English Native:
33.8% (839)Foreign-born:
5.3% (88)
Other race - Speak another language Native:
60.5% (1,500)Foreign-born:
94.3% (1,564)
Two or more races - Speak only English Native:
67.1% (6,289)Foreign-born:
4.3% (196)
Two or more races - Speak another language Native:
32.9% (3,088)Foreign-born:
95.7% (4,345)
White alone - Speak only English Native:
98.5% (37,203)Foreign-born:
9.8% (99)
White alone - Speak another language Native:
1.5% (553)Foreign-born:
90.2% (910)
Hispanic or Latino - Speak only English Native:
42.6% (4,628)Foreign-born:
5.9% (422)
Hispanic or Latino - Speak another language Native:
57.4% (6,243)Foreign-born:
94.1% (6,703)
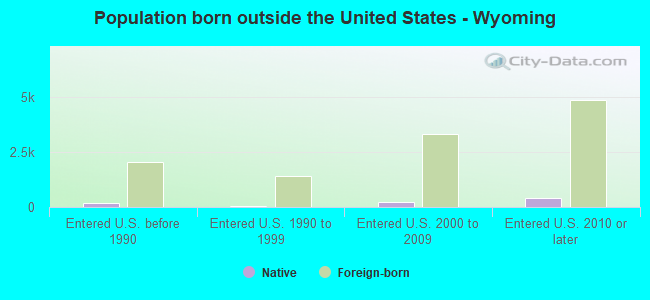
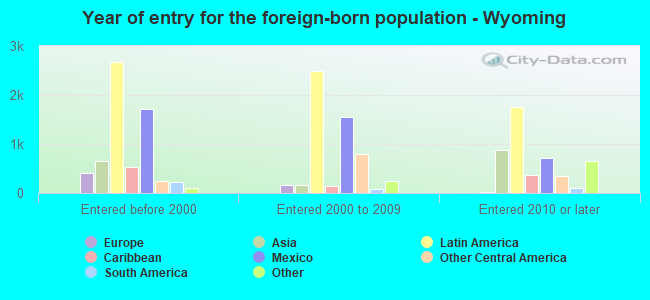
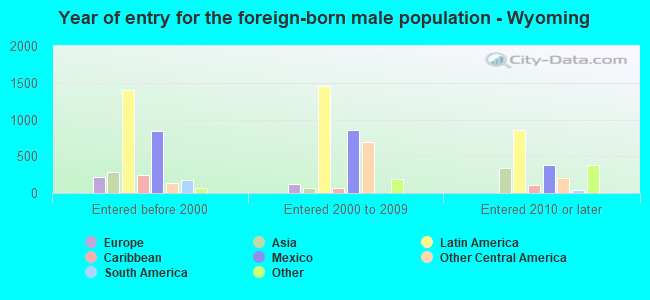
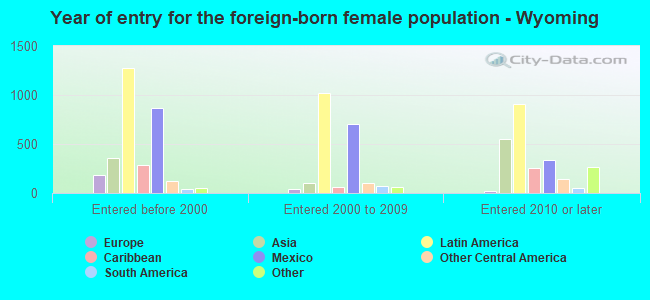
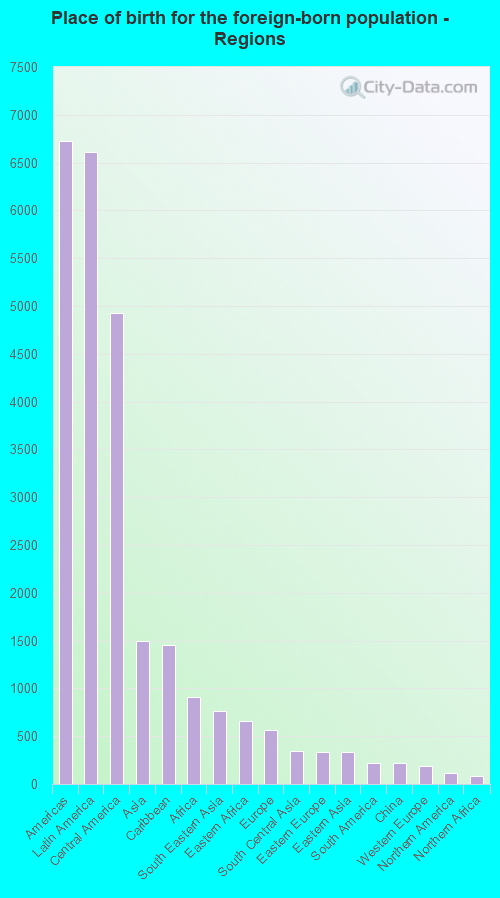
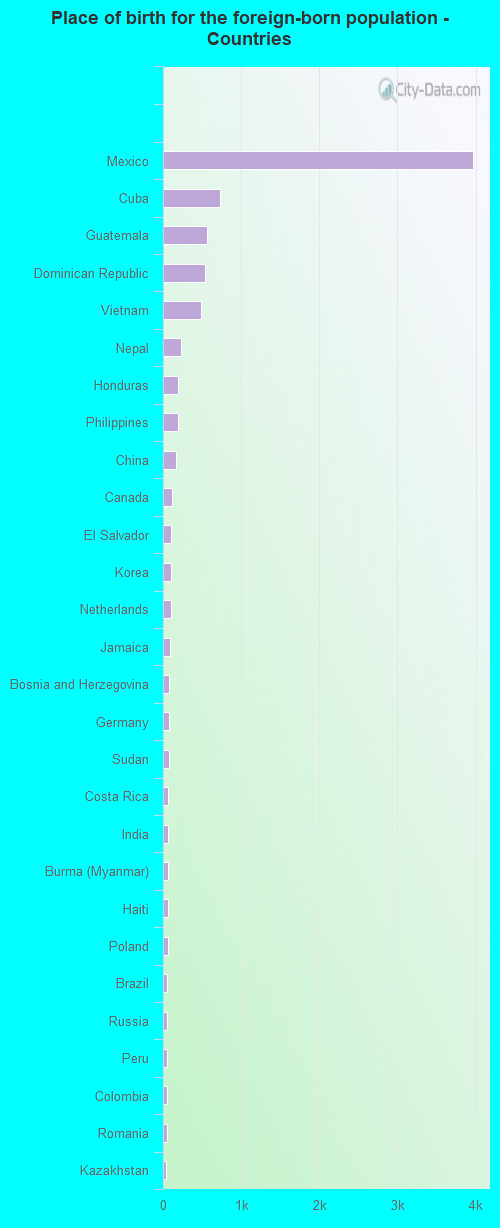
Foreign-born residents in Wyoming 9,685 residents are foreign born (8.6% Latin America , 1.9% Asia ).
This city:
12.6%Michigan:
6.9%
Marital status for residents in Wyoming Marital status - White (Caucasian) population 15 years and over
Males 31.6% Never married53.6% Now married2.0% Separated1.3% Widowed11.5% DivorcedFemales 24.6% Never married54.5% Now married0.6% Separated7.6% Widowed12.6% DivorcedWomen who gave birth in the past 12 months Now married:
83.3% (450)Unmarried:
16.7% (90)
Women who did not give birth in the past 12 months Now married:
49.8% (4,868)Unmarried:
50.2% (4,905)
Marital status - Black or African American population 15 years and over
Males 46.0% Never married26.0% Now married13.5% Separated0.0% Widowed14.5% DivorcedFemales 57.1% Never married13.8% Now married0.0% Separated0.0% Widowed29.1% DivorcedWomen who gave birth in the past 12 months Now married:
57.4% (31)Unmarried:
42.6% (23)
Women who did not give birth in the past 12 months Now married:
15.7% (321)Unmarried:
84.3% (1,727)
Marital status - American Indian / Alaska Native population 15 years and over
Males 56.9% Never married36.7% Now married3.3% Separated0.0% Widowed3.0% DivorcedFemales 40.5% Never married29.7% Now married10.5% Separated0.0% Widowed19.2% DivorcedWomen who gave birth in the past 12 months Now married:
50.0% (8)Unmarried:
50.0% (8)
Women who did not give birth in the past 12 months Now married:
36.7% (125)Unmarried:
63.3% (216)
Marital status - Asian population 15 years and over
Males 29.7% Never married67.3% Now married0.0% Separated3.0% Widowed0.0% DivorcedFemales 34.8% Never married58.7% Now married1.3% Separated1.6% Widowed3.6% DivorcedWomen who gave birth in the past 12 months Now married:
100.0% (31)Unmarried:
0.0% (0)
Women who did not give birth in the past 12 months Now married:
51.9% (380)Unmarried:
48.1% (352)
Marital status - Native Hawaiian / Pacific Islander population 15 years and over
Males 100.0% Never married0.0% Now married0.0% Separated0.0% Widowed0.0% DivorcedFemales 0.0% Never married100.0% Now married0.0% Separated0.0% Widowed0.0% DivorcedWomen who gave birth in the past 12 months Now married:
100.0% (7)Unmarried:
0.0% (0)
Marital status - Other race population 15 years and over
Males 44.5% Never married41.7% Now married0.0% Separated2.6% Widowed11.2% DivorcedFemales 45.1% Never married44.2% Now married0.4% Separated2.9% Widowed7.5% DivorcedWomen who gave birth in the past 12 months Now married:
43.9% (23)Unmarried:
56.1% (30)
Women who did not give birth in the past 12 months Now married:
39.3% (472)Unmarried:
60.7% (730)
Marital status - Two or more races population 15 years and over
Males 44.5% Never married47.4% Now married0.0% Separated0.0% Widowed8.1% DivorcedFemales 53.5% Never married42.7% Now married0.0% Separated2.7% Widowed1.1% DivorcedWomen who gave birth in the past 12 months Now married:
100.0% (83)Unmarried:
0.0% (0)
Women who did not give birth in the past 12 months Now married:
37.7% (1,336)Unmarried:
62.3% (2,212)
Marital status - White alone, not Hispanic / Latino population 15 years and over
Males 31.2% Never married54.3% Now married1.9% Separated1.3% Widowed11.3% DivorcedFemales 22.3% Never married55.6% Now married0.7% Separated8.1% Widowed13.4% DivorcedWomen who gave birth in the past 12 months Now married:
83.3% (450)Unmarried:
16.7% (90)
Women who did not give birth in the past 12 months Now married:
51.6% (4,506)Unmarried:
48.4% (4,233)
Marital status - Hispanic or Latino population 15 years and over
Males 44.9% Never married49.6% Now married0.5% Separated0.0% Widowed5.0% DivorcedFemales 51.7% Never married44.8% Now married0.0% Separated1.3% Widowed2.1% DivorcedWomen who gave birth in the past 12 months Now married:
68.8% (136)Unmarried:
31.2% (62)
Women who did not give birth in the past 12 months Now married:
36.8% (1,903)Unmarried:
63.2% (3,270)
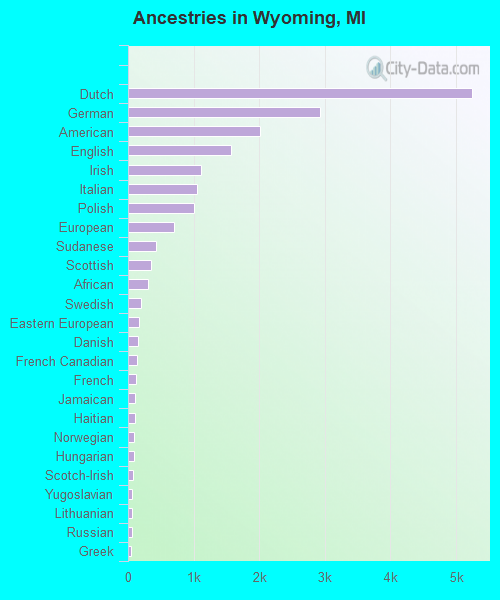
Ancestries in Wyoming
5,240 14.0% Dutch2,932 7.8% German2,012 5.4% American1,569 4.2% English1,116 3.0% Irish1,049 2.8% Italian1,006 2.7% Polish704 1.9% European428 1.1% Sudanese344 0.9% Scottish305 0.8% African191 0.5% Swedish170 0.5% Eastern European156 0.4% Danish132 0.4% French Canadian122 0.3% French104 0.3% Jamaican103 0.3% Haitian91 0.2% Norwegian89 0.2% Hungarian78 0.2% Scotch-Irish68 0.2% Yugoslavian63 0.2% Lithuanian62 0.2% Russian49 0.1% Greek46 0.1% Croatian41 0.1% Finnish38 0.1% Brazilian36 0.10% Scandinavian36 0.10% Lebanese35 0.09% Romanian33 0.09% Trinidadian and Tobagonian32 0.09% Ethiopian32 0.09% Nigerian30 0.08% Celtic26 0.07% Welsh22 0.06% Latvian21 0.06% British16 0.04% Slovak13 0.03% Belgian10 0.03% Ukrainian8 0.02% Austrian8 0.02% South African8 0.02% Kenyan7 0.02% Albanian5 0.01% Barbadian4 0.01% Jordanian3 0.01% Ghanaian
Geographical mobility in Wyoming Same house 1 year ago 38,207 89.8% White (Caucasian)8,560 84.6% Black or African American884 89.3% American Indian / Alaska Native1,551 74.7% Asian16 100.0% Native Hawaiian / Pacific Islander3,936 90.7% Other race10,413 81.5% Two or more races36,397 90.3% White alone, not Hispanic / Latino15,965 85.1% Hispanic or LatinoMoved within same county 2,905 6.8% White / Caucasian687 6.8% Black or African American76 7.7% American Indian / Alaska Native100 4.8% Asian223 5.1% Other race1,227 9.6% Two or more races2,632 6.5% White alone, not Hispanic / Latino2,177 11.6% Hispanic or LatinoMoved within same state 910 2.1% White / Caucasian135 1.3% Black or African American25 2.5% American Indian / Alaska Native79 3.8% Asian9 0.2% Other race893 7.0% Two or more races727 1.8% White alone, not Hispanic / Latino334 1.8% Hispanic or LatinoMoved from different state 426 1.0% White / Caucasian740 7.3% Black or African American357 17.2% Asian147 3.4% Other race138 1.1% Two or more races426 1.1% White alone, not Hispanic / Latino129 0.7% Hispanic or LatinoMoved from abroad 113 0.3% White60 2.9% Asian38 0.9% Other race163 1.3% Two or more races113 0.3% White alone, not Hispanic / Latino109 0.6% Hispanic or Latino
Children Nativity (place of birth) in Wyoming
Children under 6 years - Living with two parents Both parents native 2,709 100.0% NativeBoth parents foreign-born 286 100.0% NativeOne native, one foreign-born parent 830 100.0% NativeChildren under 6 years - Living with one parent Native parent 1,297 100.0% NativeForeign-born parent 90 87.1% Native13 12.9% Foreign-bornChildren 6 to 17 years - Living with two parents Both parents native 4,263 98.0% Native89 2.0% Foreign-bornBoth parents foreign-born 1,216 81.4% Native279 18.6% Foreign-bornOne native, one foreign-born parent 1,700 99.4% Native11 0.6% Foreign-bornChildren 6 to 17 years - Living with one parent Native parent 3,388 100.0% NativeForeign-born parent 693 52.7% Native622 47.3% Foreign-born
Grandparents responsible for own grandchildren in Wyoming
Grandparents (30 to 59 years) White / Caucasian 93 24.9% Responsible for grandchildren282 75.1% Not responsible for grandchildrenBlack or African American 15 100.0% Not responsible for grandchildrenOther race 56 38.0% Responsible for grandchildren92 62.0% Not responsible for grandchildrenWhite alone, not Hispanic / Latino 74 22.8% Responsible for grandchildren249 77.2% Not responsible for grandchildrenHispanic or Latino 30 18.5% Responsible for grandchildren133 81.5% Not responsible for grandchildrenGrandparents (60 years and over) White / Caucasian 65 12.5% Responsible for grandchildren455 87.5% Not responsible for grandchildrenBlack or African American 36 100.0% Not responsible for grandchildrenOther race 90 42.7% Responsible for grandchildren121 57.3% Not responsible for grandchildrenWhite alone, not Hispanic / Latino 65 14.8% Responsible for grandchildren373 85.2% Not responsible for grandchildrenHispanic or Latino 39 21.2% Responsible for grandchildren147 78.8% Not responsible for grandchildren