Races in Wright, Florida (FL) Detailed Stats
Data:
Races - White alone (%)
Races - White alone (% change since 2000)
Races - Black alone (%)
Races - Black alone (% change since 2000)
Races - American Indian alone (%)
Races - American Indian alone (% change since 2000)
Races - Asian alone (%)
Races - Asian alone (% change since 2000)
Races - Hispanic (%)
Races - Hispanic (% change since 2000)
Races - Native Hawaiian and Other Pacific Islander alone (%)
Races - Native Hawaiian and Other Pacific Islander alone (% change since 2000)
Races - Two or more races(%)
Races - Two or more races(% change since 2000)
Races - Other race alone (%)
Races - Other race alone (% change since 2000)
Racial diversity
Place of birth - Born in state of residence (%)
Place of birth - Born in state of residence (%) - White
Place of birth - Born in state of residence (%) - Black or African American
Place of birth - Born in state of residence (%) - Asian
Place of birth - Born in state of residence (%) - Hispanic or Latino
Place of birth - Born in state of residence (%) - American Indian and Alaska Native
Place of birth - Born in state of residence (%) - Multirace
Place of birth - Born in state of residence (%) - Other Race
Place of birth - Born in other state (%)
Place of birth - Born in other state (%) - White
Place of birth - Born in other state (%) - Black or African American
Place of birth - Born in other state (%) - Asian
Place of birth - Born in other state (%) - Hispanic or Latino
Place of birth - Born in other state (%) - American Indian and Alaska Native
Place of birth - Born in other state (%) - Multirace
Place of birth - Born in other state (%) - Other Race
Place of birth - Native, outside of US (%)
Place of birth - Native, outside of US (%) - White
Place of birth - Native, outside of US (%) - Black or African American
Place of birth - Native, outside of US (%) - Asian
Place of birth - Native, outside of US (%) - Hispanic or Latino
Place of birth - Native, outside of US (%) - American Indian and Alaska Native
Place of birth - Native, outside of US (%) - Multirace
Place of birth - Native, outside of US (%) - Other Race
Place of birth - Foreign born (%)
Place of birth - Foreign born (%) - White
Place of birth - Foreign born (%) - Black or African American
Place of birth - Foreign born (%) - Asian
Place of birth - Foreign born (%) - Hispanic or Latino
Place of birth - Foreign born (%) - American Indian and Alaska Native
Place of birth - Foreign born (%) - Multirace
Place of birth - Foreign born (%) - Other Race
Residents speaking English at home (%)
Residents speaking English at home - Born in the United States (%)
Residents speaking English at home - Native, born elsewhere (%)
Residents speaking English at home - Foreign born (%)
Residents speaking Spanish at home (%)
Residents speaking Spanish at home - Born in the United States (%)
Residents speaking Spanish at home - Native, born elsewhere (%)
Residents speaking Spanish at home - Foreign born (%)
Residents speaking other language at home (%)
Residents speaking other language at home - Born in the United States (%)
Residents speaking other language at home - Native, born elsewhere (%)
Residents speaking other language at home - Foreign born (%)
Marital status - Never married (%)
Marital status - Now married (%)
Marital status - Separated (%)
Marital status - Widowed (%)
Marital status - Divorced (%)
Ancestries Reported - Arab (%)
Ancestries Reported - Czech (%)
Ancestries Reported - Danish (%)
Ancestries Reported - Dutch (%)
Ancestries Reported - English (%)
Ancestries Reported - French (%)
Ancestries Reported - French Canadian (%)
Ancestries Reported - German (%)
Ancestries Reported - Greek (%)
Ancestries Reported - Hungarian (%)
Ancestries Reported - Irish (%)
Ancestries Reported - Italian (%)
Ancestries Reported - Lithuanian (%)
Ancestries Reported - Norwegian (%)
Ancestries Reported - Polish (%)
Ancestries Reported - Portuguese (%)
Ancestries Reported - Russian (%)
Ancestries Reported - Scotch-Irish (%)
Ancestries Reported - Scottish (%)
Ancestries Reported - Slovak (%)
Ancestries Reported - Subsaharan African (%)
Ancestries Reported - Swedish (%)
Ancestries Reported - Swiss (%)
Ancestries Reported - Ukrainian (%)
Ancestries Reported - United States (%)
Ancestries Reported - Welsh (%)
Ancestries Reported - West Indian (%)
Ancestries Reported - Other (%)
Geographical mobility - Same house 1 year ago (%)
Geographical mobility - Same house 1 year ago (%) - White
Geographical mobility - Same house 1 year ago (%) - Black or African American
Geographical mobility - Same house 1 year ago (%) - Asian
Geographical mobility - Same house 1 year ago (%) - Hispanic or Latino
Geographical mobility - Same house 1 year ago (%) - American Indian and Alaska Native
Geographical mobility - Same house 1 year ago (%) - Multirace
Geographical mobility - Same house 1 year ago (%) - Other Race
Geographical mobility - Moved within same county (%)
Geographical mobility - Moved within same county (%) - White
Geographical mobility - Moved within same county (%) - Black or African American
Geographical mobility - Moved within same county (%) - Asian
Geographical mobility - Moved within same county (%) - Hispanic or Latino
Geographical mobility - Moved within same county (%) - American Indian and Alaska Native
Geographical mobility - Moved within same county (%) - Multirace
Geographical mobility - Moved within same county (%) - Other Race
Geographical mobility - Moved from different county within same state (%)
Geographical mobility - Moved from different county within same state (%) - White
Geographical mobility - Moved from different county within same state (%) - Black or African American
Geographical mobility - Moved from different county within same state (%) - Asian
Geographical mobility - Moved from different county within same state (%) - Hispanic or Latino
Geographical mobility - Moved from different county within same state (%) - American Indian and Alaska Native
Geographical mobility - Moved from different county within same state (%) - Multirace
Geographical mobility - Moved from different county within same state (%) - Other Race
Geographical mobility - Moved from different state (%)
Geographical mobility - Moved from different state (%) - White
Geographical mobility - Moved from different state (%) - Black or African American
Geographical mobility - Moved from different state (%) - Asian
Geographical mobility - Moved from different state (%) - Hispanic or Latino
Geographical mobility - Moved from different state (%) - American Indian and Alaska Native
Geographical mobility - Moved from different state (%) - Multirace
Geographical mobility - Moved from different state (%) - Other Race
Geographical mobility - Moved from abroad (%)
Geographical mobility - Moved from abroad (%) - White
Geographical mobility - Moved from abroad (%) - Black or African American
Geographical mobility - Moved from abroad (%) - Asian
Geographical mobility - Moved from abroad (%) - Hispanic or Latino
Geographical mobility - Moved from abroad (%) - American Indian and Alaska Native
Geographical mobility - Moved from abroad (%) - Multirace
Geographical mobility - Moved from abroad (%) - Other Race
Place of birth for the foreign-born population - Ireland (%)
Place of birth for the foreign-born population - Denmark (%)
Place of birth for the foreign-born population - Norway (%)
Place of birth for the foreign-born population - Sweden (%)
Place of birth for the foreign-born population - United Kingdom (%)
Place of birth for the foreign-born population - England (%)
Place of birth for the foreign-born population - Scotland (%)
Place of birth for the foreign-born population - Other Northern Europe (%)
Place of birth for the foreign-born population - Austria (%)
Place of birth for the foreign-born population - Belgium (%)
Place of birth for the foreign-born population - France (%)
Place of birth for the foreign-born population - Germany (%)
Place of birth for the foreign-born population - Netherlands (%)
Place of birth for the foreign-born population - Switzerland (%)
Place of birth for the foreign-born population - Other Western Europe (%)
Place of birth for the foreign-born population - Greece (%)
Place of birth for the foreign-born population - Italy (%)
Place of birth for the foreign-born population - Portugal (%)
Place of birth for the foreign-born population - Spain (%)
Place of birth for the foreign-born population - Other Southern Europe (%)
Place of birth for the foreign-born population - Albania (%)
Place of birth for the foreign-born population - Belarus (%)
Place of birth for the foreign-born population - Bosnia and Herzegovina (%)
Place of birth for the foreign-born population - Bulgaria (%)
Place of birth for the foreign-born population - Croatia (%)
Place of birth for the foreign-born population - Czechoslovakia (%)
Place of birth for the foreign-born population - Hungary (%)
Place of birth for the foreign-born population - Latvia (%)
Place of birth for the foreign-born population - Lithuania (%)
Place of birth for the foreign-born population - North Macedonia (Macedonia) (%)
Place of birth for the foreign-born population - Moldova (%)
Place of birth for the foreign-born population - Poland (%)
Place of birth for the foreign-born population - Romania (%)
Place of birth for the foreign-born population - Russia (%)
Place of birth for the foreign-born population - Serbia (%)
Place of birth for the foreign-born population - Ukraine (%)
Place of birth for the foreign-born population - Other Eastern Europe (%)
Place of birth for the foreign-born population - China (%)
Place of birth for the foreign-born population - Hong Kong (%)
Place of birth for the foreign-born population - Taiwan (%)
Place of birth for the foreign-born population - Japan (%)
Place of birth for the foreign-born population - Korea (%)
Place of birth for the foreign-born population - Other Eastern Asia (%)
Place of birth for the foreign-born population - Afghanistan (%)
Place of birth for the foreign-born population - Bangladesh (%)
Place of birth for the foreign-born population - India (%)
Place of birth for the foreign-born population - Iran (%)
Place of birth for the foreign-born population - Kazakhstan (%)
Place of birth for the foreign-born population - Nepal (%)
Place of birth for the foreign-born population - Pakistan (%)
Place of birth for the foreign-born population - Sri Lanka (%)
Place of birth for the foreign-born population - Uzbekistan (%)
Place of birth for the foreign-born population - Other South Central Asia (%)
Place of birth for the foreign-born population - Burma (%)
Place of birth for the foreign-born population - Cambodia (%)
Place of birth for the foreign-born population - Indonesia (%)
Place of birth for the foreign-born population - Laos (%)
Place of birth for the foreign-born population - Malaysia (%)
Place of birth for the foreign-born population - Philippines (%)
Place of birth for the foreign-born population - Singapore (%)
Place of birth for the foreign-born population - Thailand (%)
Place of birth for the foreign-born population - Vietnam (%)
Place of birth for the foreign-born population - Other South Eastern Asia (%)
Place of birth for the foreign-born population - Armenia (%)
Place of birth for the foreign-born population - Iraq (%)
Place of birth for the foreign-born population - Israel (%)
Place of birth for the foreign-born population - Jordan (%)
Place of birth for the foreign-born population - Kuwait (%)
Place of birth for the foreign-born population - Lebanon (%)
Place of birth for the foreign-born population - Saudi Arabia (%)
Place of birth for the foreign-born population - Syria (%)
Place of birth for the foreign-born population - Turkey (%)
Place of birth for the foreign-born population - Yemen (%)
Place of birth for the foreign-born population - Other Western Asia (%)
Place of birth for the foreign-born population - Eritrea (%)
Place of birth for the foreign-born population - Ethiopia (%)
Place of birth for the foreign-born population - Kenya (%)
Place of birth for the foreign-born population - Somalia (%)
Place of birth for the foreign-born population - Uganda (%)
Place of birth for the foreign-born population - Zimbabwe (%)
Place of birth for the foreign-born population - Other Eastern Africa (%)
Place of birth for the foreign-born population - Cameroon (%)
Place of birth for the foreign-born population - Congo (%)
Place of birth for the foreign-born population - Democratic Republic of Congo (Zaire) (%)
Place of birth for the foreign-born population - Other Middle Africa (%)
Place of birth for the foreign-born population - Egypt (%)
Place of birth for the foreign-born population - Morocco (%)
Place of birth for the foreign-born population - Sudan (%)
Place of birth for the foreign-born population - Other Northern Africa (%)
Place of birth for the foreign-born population - South Africa (%)
Place of birth for the foreign-born population - Other Southern Africa (%)
Place of birth for the foreign-born population - Cabo Verde (%)
Place of birth for the foreign-born population - Ghana (%)
Place of birth for the foreign-born population - Liberia (%)
Place of birth for the foreign-born population - Nigeria (%)
Place of birth for the foreign-born population - Senegal (%)
Place of birth for the foreign-born population - Sierra Leone (%)
Place of birth for the foreign-born population - Other Western Africa (%)
Place of birth for the foreign-born population - Australia (%)
Place of birth for the foreign-born population - New Zealand (%)
Place of birth for the foreign-born population - Fiji (%)
Place of birth for the foreign-born population - Micronesia (%)
Place of birth for the foreign-born population - Bahamas (%)
Place of birth for the foreign-born population - Barbados (%)
Place of birth for the foreign-born population - Cuba (%)
Place of birth for the foreign-born population - Dominica (%)
Place of birth for the foreign-born population - Dominican Republic (%)
Place of birth for the foreign-born population - Grenada (%)
Place of birth for the foreign-born population - Haiti (%)
Place of birth for the foreign-born population - Jamaica (%)
Place of birth for the foreign-born population - St. Vincent and the Grenadines (%)
Place of birth for the foreign-born population - Trinidad and Tobago (%)
Place of birth for the foreign-born population - West Indies (%)
Place of birth for the foreign-born population - Other Caribbean (%)
Place of birth for the foreign-born population - Belize (%)
Place of birth for the foreign-born population - Costa Rica (%)
Place of birth for the foreign-born population - El Salvador (%)
Place of birth for the foreign-born population - Guatemala (%)
Place of birth for the foreign-born population - Honduras (%)
Place of birth for the foreign-born population - Mexico (%)
Place of birth for the foreign-born population - Nicaragua (%)
Place of birth for the foreign-born population - Panama (%)
Place of birth for the foreign-born population - Other Central America (%)
Place of birth for the foreign-born population - Argentina (%)
Place of birth for the foreign-born population - Bolivia (%)
Place of birth for the foreign-born population - Brazil (%)
Place of birth for the foreign-born population - Chile (%)
Place of birth for the foreign-born population - Colombia (%)
Place of birth for the foreign-born population - Ecuador (%)
Place of birth for the foreign-born population - Guyana (%)
Place of birth for the foreign-born population - Peru (%)
Place of birth for the foreign-born population - Uruguay (%)
Place of birth for the foreign-born population - Venezuela (%)
Place of birth for the foreign-born population - Other South America (%)
Place of birth for the foreign-born population - Canada (%)
Place of birth for the foreign-born population - Other Northern America (%)
Place of birth for the foreign-born population - Other (%)
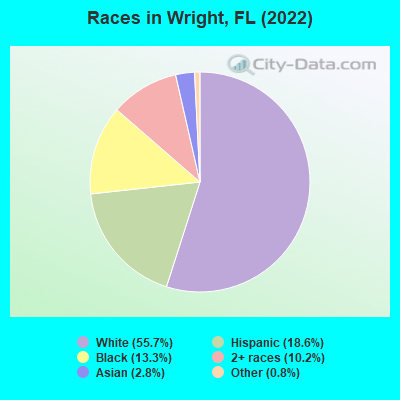
According to 2022 data, the most numerous races in Wright, FL are White alone (14,932 residents), Hispanic (4,986 residents), and Black alone (3,581 residents). 83.6% of Wright residents speak English at home. 15.9% of Wright, FL residents are foreign-born (9.7% born in Latin America, 2.9% born in Asia, 2.6% born in Europe), which is 32.1% less than the foreign-born rate of 21.0% across the entire state of Florida.
Race distribution in Wright
2000 2022
10,458,509 65.4% White alone 2,682,715 16.8% Hispanic 2,264,268 14.2% Black alone 261,693 1.6% Asian alone 236,954 1.5% Two or more races 42,358 0.3% American Indian alone 28,994 0.2% Other race alone 6,887 0.04% Native Hawaiian and Other
11,309,403 50.8% White alone 6,025,039 27.1% Hispanic 3,241,015 14.6% Black alone 861,630 3.9% Two or more races 623,692 2.8% Asian alone 152,054 0.7% Other race alone 22,504 0.1% American Indian alone 9,486 0.04% Native Hawaiian and Other
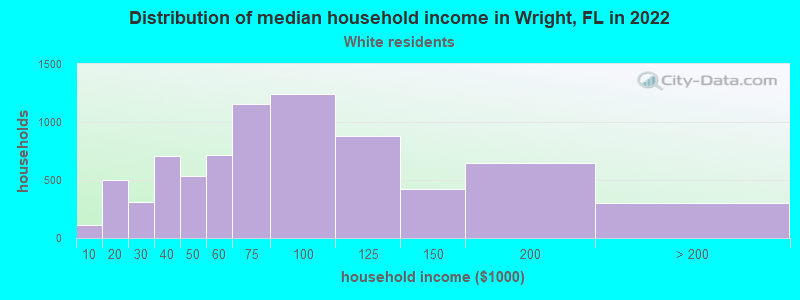
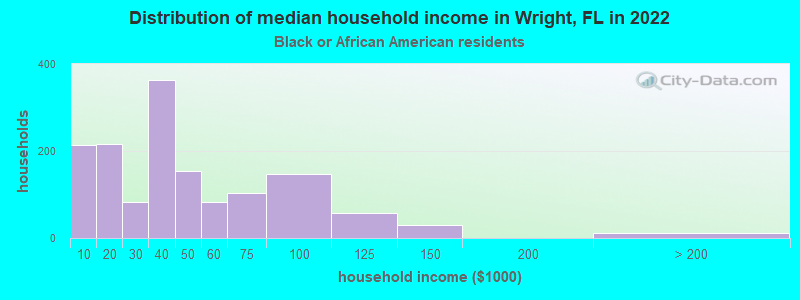
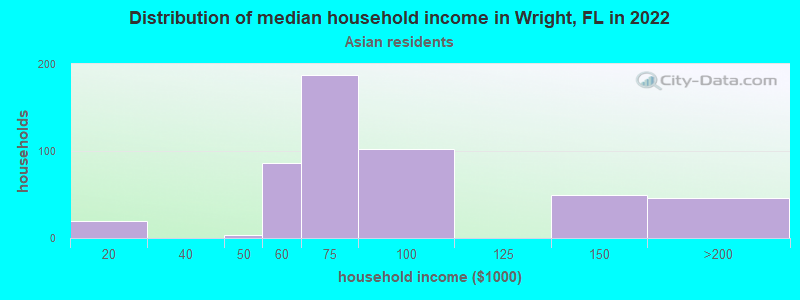
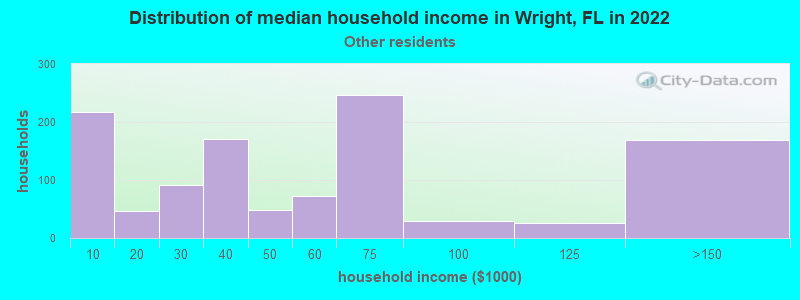
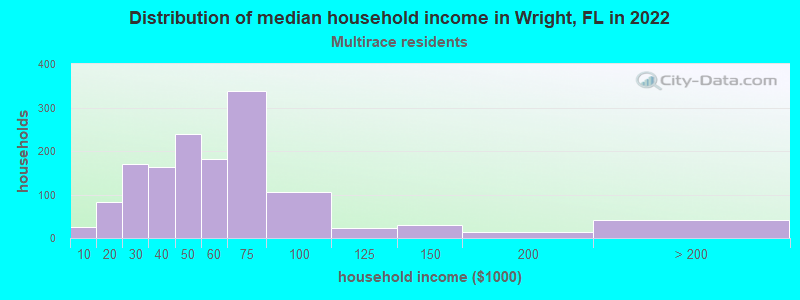
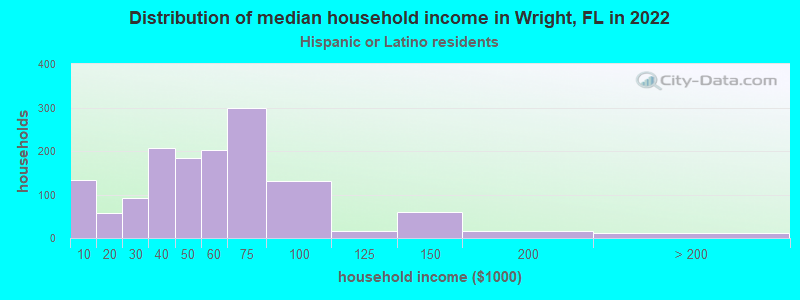
Income and house value in Wright Median household income in 2022 $70,485 White non-Hispanic householders$40,662 Black householders$100,152 Asian householders$46,713 Some other race householders$49,420 Two or more races householders$51,264 Hispanic or Latino race householdersMedian 2022 house value $319,020 White Non-Hispanic householders$294,557 Black or African American householders$261,047 American Indian or Alaska Native householders $364,929 Asian householders$267,078 Some other race householders$306,621 Two or more races householders$269,424 Hispanic or Latino householders
Median age by race in Wright
41.7 Median age for White residents38.3 46.6 38.9 Median age for Black or African American residents37.3 42.0 -598,566,307.6 Median age for American Indian / Alaska Native residents-611,418,047.3 -594,925,633.7 44.7 Median age for Asian residents28.2 48.3 -570,491,802.7 Median age for Native Hawaiian / Pacific Islander residents-588,888,888.3 -402,088,772.4 24.6 Median age for Other race residents25.2 28.2 22.6 Median age for Two or more races residents31.0 19.4 44.0 Median age for White alone residents39.1 49.6 28.7 Median age for Hispanic or Latino residents32.3 23.3
Owner/renter occupied households by race in Wright
House owners and renters - White residents 5,094 68.4% Owner occupied2,353 31.6% Renter occupiedHouse owners and renters - Black or African American residents 649 40.8% Owner occupied940 59.2% Renter occupiedHouse owners and renters - American Indian / Alaska Native residents 15 45.6% Owner occupied18 54.4% Renter occupiedHouse owners and renters - Asian residents 280 51.4% Owner occupied264 48.6% Renter occupiedHouse owners and renters - Native Hawaiian / Pacific Islander residents 9 100.0% Renter occupiedHouse owners and renters - Other race residents 497 49.1% Owner occupied515 50.9% Renter occupiedHouse owners and renters - Two or more races residents 331 23.0% Owner occupied1,105 77.0% Renter occupiedHouse owners and renters - White alone residents 4,878 67.5% Owner occupied2,350 32.5% Renter occupiedHouse owners and renters - Hispanic or Latino residents 746 48.5% Owner occupied791 51.5% Renter occupied
Language usage in Wright
English speakers - Total 83.6% of residents of Wright speak English at home.
13.4% of residents speak Spanish at home 1,180 35.5% Speak English very well2,146 64.5% Speak English less than very well3.8% of residents speak other language at home 495 51.8% Speak English very well461 48.2% Speak English less than very well
English speakers - Born in the United States 94.9% of residents of Wright speak English at home.
5.0% of residents speak Spanish at home 559 79.0% Speak English very well149 21.0% Speak English less than very well0.5% of residents speak other language at home 50 69.4% Speak English very well22 30.6% Speak English less than very well
English speakers - Native, born elsewhere 72.7% of residents of Wright speak English at home.
30.4% of residents speak Spanish at home 233 65.4% Speak English very well123 34.6% Speak English less than very well0.4% of residents speak other language at home 5 100.0% Speak English very well
English speakers - Foreign-born 28.1% of residents of Wright speak English at home.
52.0% of residents speak Spanish at home 138 7.1% Speak English very well1,808 92.9% Speak English less than very well25.4% of residents speak other language at home 497 52.3% Speak English very well454 47.7% Speak English less than very well
White (Caucasian) - Speak only English Native:
99.0% (14,113)Foreign-born:
61.9% (467)
White (Caucasian) - Speak another language Native:
1.5% (209)Foreign-born:
35.9% (271)
Black or African American - Speak only English Native:
96.0% (2,880)Foreign-born:
88.2% (151)
Black or African American - Speak another language Native:
3.9% (116)Foreign-born:
9.2% (16)
Asian - Speak only English Native:
100.0% (170)Foreign-born:
13.3% (92)
Asian - Speak another language Native:
27.1% (46)Foreign-born:
85.7% (590)
Other race - Speak another language Native:
70.1% (897)Foreign-born:
97.3% (1,113)
Two or more races - Speak only English Native:
86.5% (2,332)Foreign-born:
16.6% (134)
Two or more races - Speak another language Native:
12.8% (344)Foreign-born:
78.4% (633)
White alone - Speak only English Native:
99.6% (13,685)Foreign-born:
81.9% (482)
White alone - Speak another language Native:
0.9% (117)Foreign-born:
23.9% (141)
Hispanic or Latino - Speak only English Native:
54.7% (1,304)Foreign-born:
7.9% (153)
Hispanic or Latino - Speak another language Native:
44.9% (1,070)Foreign-born:
90.0% (1,748)
Foreign-born residents in Wright 4,264 residents are foreign born (9.7% Latin America , 2.9% Asia , 2.6% Europe ).
This city:
15.9%Florida:
21.1%
Marital status for residents in Wright Marital status - White (Caucasian) population 15 years and over
Males 28.6% Never married53.2% Now married1.8% Separated1.7% Widowed14.6% DivorcedFemales 21.0% Never married49.4% Now married2.5% Separated10.6% Widowed16.5% DivorcedWomen who gave birth in the past 12 months Now married:
91.0% (312)Unmarried:
9.0% (31)
Women who did not give birth in the past 12 months Now married:
42.9% (1,287)Unmarried:
57.1% (1,712)
Marital status - Black or African American population 15 years and over
Males 58.5% Never married23.8% Now married2.4% Separated1.3% Widowed14.0% DivorcedFemales 39.3% Never married28.3% Now married8.5% Separated0.5% Widowed23.4% DivorcedWomen who did not give birth in the past 12 months Now married:
36.2% (267)Unmarried:
63.8% (471)
Marital status - Asian population 15 years and over
Males 54.0% Never married42.3% Now married3.8% Separated0.0% Widowed0.0% DivorcedFemales 13.2% Never married72.8% Now married0.0% Separated3.0% Widowed10.9% DivorcedWomen who did not give birth in the past 12 months Now married:
69.5% (168)Unmarried:
30.5% (73)
Marital status - Other race population 15 years and over
Males 47.3% Never married47.2% Now married5.5% Separated0.0% Widowed0.0% DivorcedFemales 29.9% Never married42.8% Now married2.1% Separated0.6% Widowed24.6% DivorcedWomen who gave birth in the past 12 months Now married:
0.0% (0)Unmarried:
100.0% (30)
Women who did not give birth in the past 12 months Now married:
47.2% (402)Unmarried:
52.8% (451)
Marital status - Two or more races population 15 years and over
Males 33.9% Never married53.4% Now married0.3% Separated2.3% Widowed10.1% DivorcedFemales 45.7% Never married44.6% Now married2.2% Separated0.0% Widowed7.5% DivorcedWomen who gave birth in the past 12 months Now married:
61.9% (101)Unmarried:
38.1% (62)
Women who did not give birth in the past 12 months Now married:
45.4% (481)Unmarried:
54.6% (578)
Marital status - White alone, not Hispanic / Latino population 15 years and over
Males 28.2% Never married53.1% Now married1.9% Separated1.8% Widowed15.0% DivorcedFemales 19.8% Never married49.5% Now married2.3% Separated11.2% Widowed17.1% DivorcedWomen who gave birth in the past 12 months Now married:
91.0% (314)Unmarried:
9.0% (31)
Women who did not give birth in the past 12 months Now married:
41.4% (1,101)Unmarried:
58.6% (1,556)
Marital status - Hispanic or Latino population 15 years and over
Males 35.2% Never married60.3% Now married2.7% Separated0.0% Widowed1.8% DivorcedFemales 34.7% Never married47.5% Now married2.3% Separated0.3% Widowed15.1% DivorcedWomen who gave birth in the past 12 months Now married:
52.4% (94)Unmarried:
47.6% (85)
Women who did not give birth in the past 12 months Now married:
48.8% (628)Unmarried:
51.2% (660)
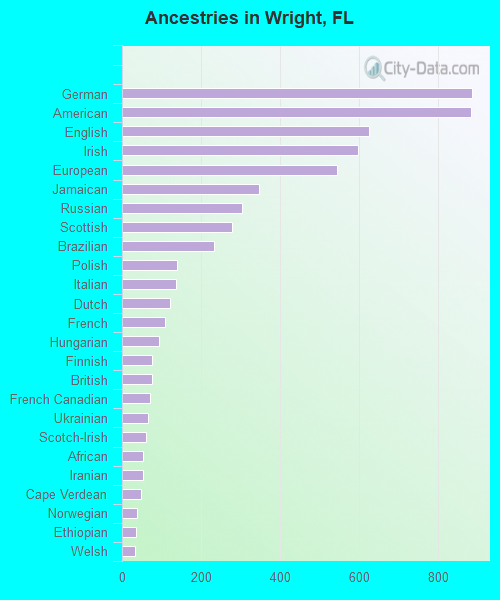
Ancestries in Wright
886 6.4% German885 6.4% American625 4.5% English599 4.4% Irish546 4.0% European348 2.5% Jamaican305 2.2% Russian279 2.0% Scottish234 1.7% Brazilian139 1.0% Polish137 1.0% Italian121 0.9% Dutch108 0.8% French94 0.7% Hungarian76 0.6% Finnish75 0.5% British71 0.5% French Canadian66 0.5% Ukrainian62 0.5% Scotch-Irish54 0.4% African53 0.4% Iranian49 0.4% Cape Verdean38 0.3% Norwegian36 0.3% Ethiopian32 0.2% Welsh15 0.1% Swedish11 0.08% Portuguese10 0.07% Canadian10 0.07% Scandinavian5 0.04% Turkish
Geographical mobility in Wright Same house 1 year ago 13,121 85.4% White (Caucasian)2,634 72.5% Black or African American19 51.6% American Indian / Alaska Native788 84.7% Asian8 100.0% Native Hawaiian / Pacific Islander2,142 69.9% Other race3,489 75.1% Two or more races12,552 85.3% White alone, not Hispanic / Latino3,992 83.3% Hispanic or LatinoMoved within same county 1,105 7.2% White / Caucasian322 8.9% Black or African American14 38.6% American Indian / Alaska Native21 2.3% Asian526 17.2% Other race366 7.9% Two or more races1,080 7.3% White alone, not Hispanic / Latino381 7.9% Hispanic or LatinoMoved within same state 383 2.5% White / Caucasian384 10.6% Black or African American184 6.0% Other race35 0.7% Two or more races369 2.5% White alone, not Hispanic / Latino154 3.2% Hispanic or LatinoMoved from different state 675 4.4% White / Caucasian146 4.0% Black or African American29 3.1% Asian85 2.8% Other race636 13.7% Two or more races621 4.2% White alone, not Hispanic / Latino244 5.1% Hispanic or LatinoMoved from abroad 67 0.4% White80 2.2% Black or African American104 11.2% Asian39 1.3% Other race25 0.5% Two or more races76 0.5% White alone, not Hispanic / Latino22 0.5% Hispanic or Latino
Children Nativity (place of birth) in Wright
Children under 6 years - Living with two parents Both parents foreign-born 39 100.0% NativeOne native, one foreign-born parent 1,340 100.0% NativeChildren under 6 years - Living with one parent Native parent 129 100.0% NativeForeign-born parent 198 48.9% Native207 51.1% Foreign-bornChildren 6 to 17 years - Living with two parents Both parents native 1,350 92.7% Native106 7.3% Foreign-bornBoth parents foreign-born 33 28.7% Native83 71.3% Foreign-bornOne native, one foreign-born parent 255 78.1% Native72 21.9% Foreign-bornChildren 6 to 17 years - Living with one parent Native parent 412 100.0% NativeForeign-born parent 501 64.8% Native272 35.2% Foreign-born
Grandparents responsible for own grandchildren in Wright
Grandparents (30 to 59 years) White / Caucasian 11 28.5% Responsible for grandchildren28 71.5% Not responsible for grandchildrenBlack or African American 9 17.6% Responsible for grandchildren41 82.4% Not responsible for grandchildrenTwo or more races 444 89.7% Responsible for grandchildren51 10.3% Not responsible for grandchildrenWhite alone, not Hispanic / Latino 11 47.0% Responsible for grandchildren12 53.0% Not responsible for grandchildrenHispanic or Latino 258 100.0% Responsible for grandchildrenGrandparents (60 years and over) White / Caucasian 32 34.5% Responsible for grandchildren60 65.5% Not responsible for grandchildrenBlack or African American 10 39.0% Responsible for grandchildren15 61.0% Not responsible for grandchildrenTwo or more races 71 100.0% Responsible for grandchildrenWhite alone, not Hispanic / Latino 32 34.5% Responsible for grandchildren60 65.5% Not responsible for grandchildrenHispanic or Latino 42 100.0% Responsible for grandchildren