Races in World Golf Village, Florida (FL) Detailed Stats
Data:
Races - White alone (%)
Races - White alone (% change since 2000)
Races - Black alone (%)
Races - Black alone (% change since 2000)
Races - American Indian alone (%)
Races - American Indian alone (% change since 2000)
Races - Asian alone (%)
Races - Asian alone (% change since 2000)
Races - Hispanic (%)
Races - Hispanic (% change since 2000)
Races - Native Hawaiian and Other Pacific Islander alone (%)
Races - Native Hawaiian and Other Pacific Islander alone (% change since 2000)
Races - Two or more races(%)
Races - Two or more races(% change since 2000)
Races - Other race alone (%)
Races - Other race alone (% change since 2000)
Racial diversity
Place of birth - Born in state of residence (%)
Place of birth - Born in state of residence (%) - White
Place of birth - Born in state of residence (%) - Black or African American
Place of birth - Born in state of residence (%) - Asian
Place of birth - Born in state of residence (%) - Hispanic or Latino
Place of birth - Born in state of residence (%) - American Indian and Alaska Native
Place of birth - Born in state of residence (%) - Multirace
Place of birth - Born in state of residence (%) - Other Race
Place of birth - Born in other state (%)
Place of birth - Born in other state (%) - White
Place of birth - Born in other state (%) - Black or African American
Place of birth - Born in other state (%) - Asian
Place of birth - Born in other state (%) - Hispanic or Latino
Place of birth - Born in other state (%) - American Indian and Alaska Native
Place of birth - Born in other state (%) - Multirace
Place of birth - Born in other state (%) - Other Race
Place of birth - Native, outside of US (%)
Place of birth - Native, outside of US (%) - White
Place of birth - Native, outside of US (%) - Black or African American
Place of birth - Native, outside of US (%) - Asian
Place of birth - Native, outside of US (%) - Hispanic or Latino
Place of birth - Native, outside of US (%) - American Indian and Alaska Native
Place of birth - Native, outside of US (%) - Multirace
Place of birth - Native, outside of US (%) - Other Race
Place of birth - Foreign born (%)
Place of birth - Foreign born (%) - White
Place of birth - Foreign born (%) - Black or African American
Place of birth - Foreign born (%) - Asian
Place of birth - Foreign born (%) - Hispanic or Latino
Place of birth - Foreign born (%) - American Indian and Alaska Native
Place of birth - Foreign born (%) - Multirace
Place of birth - Foreign born (%) - Other Race
Residents speaking English at home (%)
Residents speaking English at home - Born in the United States (%)
Residents speaking English at home - Native, born elsewhere (%)
Residents speaking English at home - Foreign born (%)
Residents speaking Spanish at home (%)
Residents speaking Spanish at home - Born in the United States (%)
Residents speaking Spanish at home - Native, born elsewhere (%)
Residents speaking Spanish at home - Foreign born (%)
Residents speaking other language at home (%)
Residents speaking other language at home - Born in the United States (%)
Residents speaking other language at home - Native, born elsewhere (%)
Residents speaking other language at home - Foreign born (%)
Marital status - Never married (%)
Marital status - Now married (%)
Marital status - Separated (%)
Marital status - Widowed (%)
Marital status - Divorced (%)
Ancestries Reported - Arab (%)
Ancestries Reported - Czech (%)
Ancestries Reported - Danish (%)
Ancestries Reported - Dutch (%)
Ancestries Reported - English (%)
Ancestries Reported - French (%)
Ancestries Reported - French Canadian (%)
Ancestries Reported - German (%)
Ancestries Reported - Greek (%)
Ancestries Reported - Hungarian (%)
Ancestries Reported - Irish (%)
Ancestries Reported - Italian (%)
Ancestries Reported - Lithuanian (%)
Ancestries Reported - Norwegian (%)
Ancestries Reported - Polish (%)
Ancestries Reported - Portuguese (%)
Ancestries Reported - Russian (%)
Ancestries Reported - Scotch-Irish (%)
Ancestries Reported - Scottish (%)
Ancestries Reported - Slovak (%)
Ancestries Reported - Subsaharan African (%)
Ancestries Reported - Swedish (%)
Ancestries Reported - Swiss (%)
Ancestries Reported - Ukrainian (%)
Ancestries Reported - United States (%)
Ancestries Reported - Welsh (%)
Ancestries Reported - West Indian (%)
Ancestries Reported - Other (%)
Geographical mobility - Same house 1 year ago (%)
Geographical mobility - Same house 1 year ago (%) - White
Geographical mobility - Same house 1 year ago (%) - Black or African American
Geographical mobility - Same house 1 year ago (%) - Asian
Geographical mobility - Same house 1 year ago (%) - Hispanic or Latino
Geographical mobility - Same house 1 year ago (%) - American Indian and Alaska Native
Geographical mobility - Same house 1 year ago (%) - Multirace
Geographical mobility - Same house 1 year ago (%) - Other Race
Geographical mobility - Moved within same county (%)
Geographical mobility - Moved within same county (%) - White
Geographical mobility - Moved within same county (%) - Black or African American
Geographical mobility - Moved within same county (%) - Asian
Geographical mobility - Moved within same county (%) - Hispanic or Latino
Geographical mobility - Moved within same county (%) - American Indian and Alaska Native
Geographical mobility - Moved within same county (%) - Multirace
Geographical mobility - Moved within same county (%) - Other Race
Geographical mobility - Moved from different county within same state (%)
Geographical mobility - Moved from different county within same state (%) - White
Geographical mobility - Moved from different county within same state (%) - Black or African American
Geographical mobility - Moved from different county within same state (%) - Asian
Geographical mobility - Moved from different county within same state (%) - Hispanic or Latino
Geographical mobility - Moved from different county within same state (%) - American Indian and Alaska Native
Geographical mobility - Moved from different county within same state (%) - Multirace
Geographical mobility - Moved from different county within same state (%) - Other Race
Geographical mobility - Moved from different state (%)
Geographical mobility - Moved from different state (%) - White
Geographical mobility - Moved from different state (%) - Black or African American
Geographical mobility - Moved from different state (%) - Asian
Geographical mobility - Moved from different state (%) - Hispanic or Latino
Geographical mobility - Moved from different state (%) - American Indian and Alaska Native
Geographical mobility - Moved from different state (%) - Multirace
Geographical mobility - Moved from different state (%) - Other Race
Geographical mobility - Moved from abroad (%)
Geographical mobility - Moved from abroad (%) - White
Geographical mobility - Moved from abroad (%) - Black or African American
Geographical mobility - Moved from abroad (%) - Asian
Geographical mobility - Moved from abroad (%) - Hispanic or Latino
Geographical mobility - Moved from abroad (%) - American Indian and Alaska Native
Geographical mobility - Moved from abroad (%) - Multirace
Geographical mobility - Moved from abroad (%) - Other Race
Place of birth for the foreign-born population - Ireland (%)
Place of birth for the foreign-born population - Denmark (%)
Place of birth for the foreign-born population - Norway (%)
Place of birth for the foreign-born population - Sweden (%)
Place of birth for the foreign-born population - United Kingdom (%)
Place of birth for the foreign-born population - England (%)
Place of birth for the foreign-born population - Scotland (%)
Place of birth for the foreign-born population - Other Northern Europe (%)
Place of birth for the foreign-born population - Austria (%)
Place of birth for the foreign-born population - Belgium (%)
Place of birth for the foreign-born population - France (%)
Place of birth for the foreign-born population - Germany (%)
Place of birth for the foreign-born population - Netherlands (%)
Place of birth for the foreign-born population - Switzerland (%)
Place of birth for the foreign-born population - Other Western Europe (%)
Place of birth for the foreign-born population - Greece (%)
Place of birth for the foreign-born population - Italy (%)
Place of birth for the foreign-born population - Portugal (%)
Place of birth for the foreign-born population - Spain (%)
Place of birth for the foreign-born population - Other Southern Europe (%)
Place of birth for the foreign-born population - Albania (%)
Place of birth for the foreign-born population - Belarus (%)
Place of birth for the foreign-born population - Bosnia and Herzegovina (%)
Place of birth for the foreign-born population - Bulgaria (%)
Place of birth for the foreign-born population - Croatia (%)
Place of birth for the foreign-born population - Czechoslovakia (%)
Place of birth for the foreign-born population - Hungary (%)
Place of birth for the foreign-born population - Latvia (%)
Place of birth for the foreign-born population - Lithuania (%)
Place of birth for the foreign-born population - North Macedonia (Macedonia) (%)
Place of birth for the foreign-born population - Moldova (%)
Place of birth for the foreign-born population - Poland (%)
Place of birth for the foreign-born population - Romania (%)
Place of birth for the foreign-born population - Russia (%)
Place of birth for the foreign-born population - Serbia (%)
Place of birth for the foreign-born population - Ukraine (%)
Place of birth for the foreign-born population - Other Eastern Europe (%)
Place of birth for the foreign-born population - China (%)
Place of birth for the foreign-born population - Hong Kong (%)
Place of birth for the foreign-born population - Taiwan (%)
Place of birth for the foreign-born population - Japan (%)
Place of birth for the foreign-born population - Korea (%)
Place of birth for the foreign-born population - Other Eastern Asia (%)
Place of birth for the foreign-born population - Afghanistan (%)
Place of birth for the foreign-born population - Bangladesh (%)
Place of birth for the foreign-born population - India (%)
Place of birth for the foreign-born population - Iran (%)
Place of birth for the foreign-born population - Kazakhstan (%)
Place of birth for the foreign-born population - Nepal (%)
Place of birth for the foreign-born population - Pakistan (%)
Place of birth for the foreign-born population - Sri Lanka (%)
Place of birth for the foreign-born population - Uzbekistan (%)
Place of birth for the foreign-born population - Other South Central Asia (%)
Place of birth for the foreign-born population - Burma (%)
Place of birth for the foreign-born population - Cambodia (%)
Place of birth for the foreign-born population - Indonesia (%)
Place of birth for the foreign-born population - Laos (%)
Place of birth for the foreign-born population - Malaysia (%)
Place of birth for the foreign-born population - Philippines (%)
Place of birth for the foreign-born population - Singapore (%)
Place of birth for the foreign-born population - Thailand (%)
Place of birth for the foreign-born population - Vietnam (%)
Place of birth for the foreign-born population - Other South Eastern Asia (%)
Place of birth for the foreign-born population - Armenia (%)
Place of birth for the foreign-born population - Iraq (%)
Place of birth for the foreign-born population - Israel (%)
Place of birth for the foreign-born population - Jordan (%)
Place of birth for the foreign-born population - Kuwait (%)
Place of birth for the foreign-born population - Lebanon (%)
Place of birth for the foreign-born population - Saudi Arabia (%)
Place of birth for the foreign-born population - Syria (%)
Place of birth for the foreign-born population - Turkey (%)
Place of birth for the foreign-born population - Yemen (%)
Place of birth for the foreign-born population - Other Western Asia (%)
Place of birth for the foreign-born population - Eritrea (%)
Place of birth for the foreign-born population - Ethiopia (%)
Place of birth for the foreign-born population - Kenya (%)
Place of birth for the foreign-born population - Somalia (%)
Place of birth for the foreign-born population - Uganda (%)
Place of birth for the foreign-born population - Zimbabwe (%)
Place of birth for the foreign-born population - Other Eastern Africa (%)
Place of birth for the foreign-born population - Cameroon (%)
Place of birth for the foreign-born population - Congo (%)
Place of birth for the foreign-born population - Democratic Republic of Congo (Zaire) (%)
Place of birth for the foreign-born population - Other Middle Africa (%)
Place of birth for the foreign-born population - Egypt (%)
Place of birth for the foreign-born population - Morocco (%)
Place of birth for the foreign-born population - Sudan (%)
Place of birth for the foreign-born population - Other Northern Africa (%)
Place of birth for the foreign-born population - South Africa (%)
Place of birth for the foreign-born population - Other Southern Africa (%)
Place of birth for the foreign-born population - Cabo Verde (%)
Place of birth for the foreign-born population - Ghana (%)
Place of birth for the foreign-born population - Liberia (%)
Place of birth for the foreign-born population - Nigeria (%)
Place of birth for the foreign-born population - Senegal (%)
Place of birth for the foreign-born population - Sierra Leone (%)
Place of birth for the foreign-born population - Other Western Africa (%)
Place of birth for the foreign-born population - Australia (%)
Place of birth for the foreign-born population - New Zealand (%)
Place of birth for the foreign-born population - Fiji (%)
Place of birth for the foreign-born population - Micronesia (%)
Place of birth for the foreign-born population - Bahamas (%)
Place of birth for the foreign-born population - Barbados (%)
Place of birth for the foreign-born population - Cuba (%)
Place of birth for the foreign-born population - Dominica (%)
Place of birth for the foreign-born population - Dominican Republic (%)
Place of birth for the foreign-born population - Grenada (%)
Place of birth for the foreign-born population - Haiti (%)
Place of birth for the foreign-born population - Jamaica (%)
Place of birth for the foreign-born population - St. Vincent and the Grenadines (%)
Place of birth for the foreign-born population - Trinidad and Tobago (%)
Place of birth for the foreign-born population - West Indies (%)
Place of birth for the foreign-born population - Other Caribbean (%)
Place of birth for the foreign-born population - Belize (%)
Place of birth for the foreign-born population - Costa Rica (%)
Place of birth for the foreign-born population - El Salvador (%)
Place of birth for the foreign-born population - Guatemala (%)
Place of birth for the foreign-born population - Honduras (%)
Place of birth for the foreign-born population - Mexico (%)
Place of birth for the foreign-born population - Nicaragua (%)
Place of birth for the foreign-born population - Panama (%)
Place of birth for the foreign-born population - Other Central America (%)
Place of birth for the foreign-born population - Argentina (%)
Place of birth for the foreign-born population - Bolivia (%)
Place of birth for the foreign-born population - Brazil (%)
Place of birth for the foreign-born population - Chile (%)
Place of birth for the foreign-born population - Colombia (%)
Place of birth for the foreign-born population - Ecuador (%)
Place of birth for the foreign-born population - Guyana (%)
Place of birth for the foreign-born population - Peru (%)
Place of birth for the foreign-born population - Uruguay (%)
Place of birth for the foreign-born population - Venezuela (%)
Place of birth for the foreign-born population - Other South America (%)
Place of birth for the foreign-born population - Canada (%)
Place of birth for the foreign-born population - Other Northern America (%)
Place of birth for the foreign-born population - Other (%)
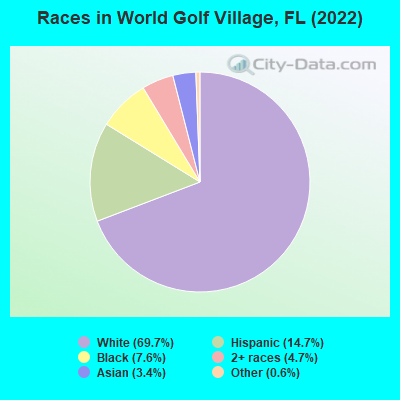
According to 2022 data, the most numerous races in World Golf Village, FL are White alone (16,997 residents), Hispanic (3,580 residents), and Black alone (1,864 residents). 85.0% of World Golf Village residents speak English at home.
Race distribution in World Golf Village 16,997 69.7% White alone 3,580 14.7% Hispanic 1,864 7.6% Black alone 1,141 4.7% Two or more races 834 3.4% Asian alone 155 0.6% Other race alone 6 0.02% Native Hawaiian and Other
2000 2022
10,458,509 65.4% White alone 2,682,715 16.8% Hispanic 2,264,268 14.2% Black alone 261,693 1.6% Asian alone 236,954 1.5% Two or more races 42,358 0.3% American Indian alone 28,994 0.2% Other race alone 6,887 0.04% Native Hawaiian and Other
11,309,403 50.8% White alone 6,025,039 27.1% Hispanic 3,241,015 14.6% Black alone 861,630 3.9% Two or more races 623,692 2.8% Asian alone 152,054 0.7% Other race alone 22,504 0.1% American Indian alone 9,486 0.04% Native Hawaiian and Other
Income and house value in World Golf Village Median household income in 2022 $108,277 White non-Hispanic householders$138,045 Black householders$66,085 Some other race householders$102,862 Hispanic or Latino race householders
Median age by race in World Golf Village
42.2 Median age for White residents43.0 42.1 43.5 Median age for Black or African American residents37.4 50.7 -801,364,023.1 Median age for American Indian / Alaska Native residents-611,418,047.3 -594,925,633.7 44.8 Median age for Asian residents48.6 30.4 -679,849,340.2 Median age for Native Hawaiian / Pacific Islander residents-666,666,666.0 -443,298,968.6 43.2 Median age for Other race residents16.1 46.4 36.1 Median age for Two or more races residents27.6 34.7 43.5 Median age for White alone residents44.1 43.0 24.7 Median age for Hispanic or Latino residents20.4 35.1
Owner/renter occupied households by race in World Golf Village
House owners and renters - White residents 6,550 90.4% Owner occupied697 9.6% Renter occupiedHouse owners and renters - Black or African American residents 618 86.6% Owner occupied95 13.4% Renter occupiedHouse owners and renters - Asian residents 336 100.0% Owner occupiedHouse owners and renters - Other race residents 529 100.0% Owner occupiedHouse owners and renters - Two or more races residents 478 89.0% Owner occupied59 11.0% Renter occupiedHouse owners and renters - White alone residents 6,351 92.5% Owner occupied517 7.5% Renter occupiedHouse owners and renters - Hispanic or Latino residents 571 67.1% Owner occupied280 32.9% Renter occupied
Language usage in World Golf Village
English speakers - Total 85.0% of residents of World Golf Village speak English at home.
6.3% of residents speak Spanish at home 987 67.0% Speak English very well486 33.0% Speak English less than very well8.4% of residents speak other language at home 1,257 64.6% Speak English very well688 35.4% Speak English less than very well
English speakers - Born in the United States 97.6% of residents of World Golf Village speak English at home.
0.7% of residents speak Spanish at home 96 100.0% Speak English very well1.5% of residents speak other language at home 200 100.0% Speak English very well
English speakers - Native, born elsewhere 17.8% of residents of World Golf Village speak English at home.
85.9% of residents speak Spanish at home 148 15.6% Speak English very well802 84.4% Speak English less than very well23.3% of residents speak other language at home 258 100.0% Speak English very well
English speakers - Foreign-born 31.2% of residents of World Golf Village speak English at home.
27.0% of residents speak Spanish at home 451 65.0% Speak English very well243 35.0% Speak English less than very well45.9% of residents speak other language at home 589 50.0% Speak English very well588 50.0% Speak English less than very well
White (Caucasian) - Speak only English Native:
95.8% (15,471)Foreign-born:
33.5% (485)
White (Caucasian) - Speak another language Native:
4.2% (678)Foreign-born:
66.6% (964)
Black or African American - Speak only English Native:
75.3% (1,216)Foreign-born:
10.1% (16)
Black or African American - Speak another language Native:
25.1% (405)Foreign-born:
91.6% (144)
Asian - Speak only English Native:
67.2% (229)Foreign-born:
13.7% (61)
Asian - Speak another language Native:
24.8% (84)Foreign-born:
86.5% (385)
Other race - Speak only English Native:
73.6% (905)Foreign-born:
29.6% (118)
Other race - Speak another language Native:
28.6% (351)Foreign-born:
46.8% (187)
Two or more races - Speak only English Native:
85.1% (1,298)Foreign-born:
16.1% (10)
Two or more races - Speak another language Native:
14.9% (227)Foreign-born:
67.1% (40)
White alone - Speak only English Native:
98.4% (14,713)Foreign-born:
35.5% (426)
White alone - Speak another language Native:
1.5% (217)Foreign-born:
66.3% (797)
Hispanic or Latino - Speak only English Native:
66.0% (1,950)Foreign-born:
29.9% (162)
Hispanic or Latino - Speak another language Native:
33.8% (998)Foreign-born:
73.5% (399)
Foreign-born residents in World Golf Village
Marital status for residents in World Golf Village Marital status - White (Caucasian) population 15 years and over
Males 16.8% Never married72.6% Now married1.7% Separated3.7% Widowed5.2% DivorcedFemales 26.0% Never married59.8% Now married0.9% Separated4.9% Widowed8.4% DivorcedWomen who gave birth in the past 12 months Now married:
19.8% (21)Unmarried:
80.2% (85)
Women who did not give birth in the past 12 months Now married:
51.5% (2,299)Unmarried:
48.5% (2,164)
Marital status - Black or African American population 15 years and over
Males 14.8% Never married81.8% Now married0.1% Separated0.0% Widowed3.2% DivorcedFemales 29.9% Never married67.3% Now married0.0% Separated1.5% Widowed1.3% DivorcedWomen who did not give birth in the past 12 months Now married:
47.0% (259)Unmarried:
53.0% (293)
Marital status - Asian population 15 years and over
Males 0.0% Never married78.5% Now married0.0% Separated0.0% Widowed21.5% DivorcedFemales 48.2% Never married48.0% Now married0.0% Separated0.0% Widowed3.8% DivorcedWomen who did not give birth in the past 12 months Now married:
45.2% (180)Unmarried:
54.8% (219)
Marital status - Other race population 15 years and over
Males 22.8% Never married77.2% Now married0.0% Separated0.0% Widowed0.0% DivorcedFemales 0.0% Never married100.0% Now married0.0% Separated0.0% Widowed0.0% DivorcedWomen who gave birth in the past 12 months Now married:
100.0% (216)Unmarried:
0.0% (0)
Women who did not give birth in the past 12 months Now married:
100.0% (13)Unmarried:
0.0% (0)
Marital status - Two or more races population 15 years and over
Males 37.7% Never married62.3% Now married0.0% Separated0.0% Widowed0.0% DivorcedFemales 28.9% Never married49.3% Now married0.0% Separated21.8% Widowed0.0% DivorcedWomen who did not give birth in the past 12 months Now married:
66.5% (204)Unmarried:
33.5% (102)
Marital status - White alone, not Hispanic / Latino population 15 years and over
Males 15.5% Never married74.3% Now married1.8% Separated2.7% Widowed5.7% DivorcedFemales 24.5% Never married62.2% Now married0.0% Separated5.4% Widowed7.8% DivorcedWomen who gave birth in the past 12 months Now married:
100.0% (22)Unmarried:
0.0% (0)
Women who did not give birth in the past 12 months Now married:
52.7% (2,124)Unmarried:
47.3% (1,903)
Marital status - Hispanic or Latino population 15 years and over
Males 33.0% Never married58.1% Now married0.0% Separated8.9% Widowed0.0% DivorcedFemales 27.2% Never married52.1% Now married6.6% Separated5.1% Widowed9.0% DivorcedWomen who gave birth in the past 12 months Now married:
65.1% (189)Unmarried:
34.9% (102)
Women who did not give birth in the past 12 months Now married:
50.0% (389)Unmarried:
50.0% (389)
Ancestries in World Golf Village
2,660 24.0% English929 8.4% American866 7.8% Russian626 5.6% Italian617 5.6% German519 4.7% Scottish506 4.6% Irish344 3.1% Polish170 1.5% West Indian155 1.4% Haitian134 1.2% Brazilian125 1.1% European97 0.9% Northern European80 0.7% Czech76 0.7% Eastern European60 0.5% Canadian44 0.4% British38 0.3% Norwegian38 0.3% Ukrainian32 0.3% Icelander31 0.3% Hungarian15 0.1% Swedish1 0.01% Jamaican
Geographical mobility in World Golf Village Same house 1 year ago 16,666 90.0% White (Caucasian)1,198 58.4% Black or African American643 86.6% Asian1,174 100.0% Other race1,502 93.1% Two or more races15,239 89.9% White alone, not Hispanic / Latino3,398 97.0% Hispanic or LatinoMoved within same county 543 2.9% White / Caucasian19 0.9% Black or African American539 3.2% White alone, not Hispanic / LatinoMoved within same state 239 1.3% White / Caucasian101 13.6% Asian23 1.4% Two or more races246 1.5% White alone, not Hispanic / Latino28 0.8% Hispanic or LatinoMoved from different state 1,086 5.9% White / Caucasian299 14.5% Black or African American9 100.0% Native Hawaiian / Pacific Islander843 5.0% White alone, not Hispanic / Latino258 7.4% Hispanic or LatinoMoved from abroad 159 0.9% White212 10.3% Black or African American28 1.8% Two or more races203 1.2% White alone, not Hispanic / Latino36 1.0% Hispanic or Latino
Children Nativity (place of birth) in World Golf Village
Children under 6 years - Living with two parents Both parents native 862 100.0% NativeBoth parents foreign-born 166 70.7% Native69 29.3% Foreign-bornOne native, one foreign-born parent 124 100.0% NativeChildren under 6 years - Living with one parent Foreign-born parent 142 100.0% NativeChildren 6 to 17 years - Living with two parents Both parents native 2,645 100.0% NativeBoth parents foreign-born 349 100.0% NativeOne native, one foreign-born parent 747 100.0% NativeChildren 6 to 17 years - Living with one parent Native parent 205 100.0% NativeForeign-born parent 457 53.5% Native397 46.5% Foreign-born