Races in Woodhaven, Michigan (MI) Detailed Stats
Ancestries, Foreign-born residents, place of birth
Settings
X


Recent posts about races in Woodhaven, Michigan on our local forum with over 2,400,000 registered users:
 | Where to live near Troy, Michigan :) (19 replies) |
| Mid 40s, no kids, returning to area. (6 replies) |
| The First Thing That Comes To Mind… (4 replies) |
| West Bloomfield or Farmington Hills.....or Troy? (34 replies) |
| Renting a house vs. apartment in Downriver area (8 replies) |
| To Michigan from Vermont - advice (28 replies) |
Latest news about races in Woodhaven, MI collected exclusively by city-data.com from local newspapers, TV, and radio stations
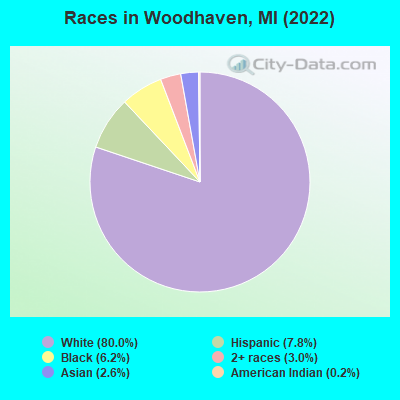
According to 2022 data, the most numerous races in Woodhaven, MI are White alone (10,153 residents), Black alone (792 residents), and Hispanic (985 residents). 94.6% of Woodhaven residents speak English at home. 4.5% of Woodhaven, MI residents are foreign-born (2.4% born in Asia, 1.4% born in Europe, 0.5% born in Latin America), which is 32.2% less than the foreign-born rate of 6.0% across the entire state of Michigan.
Race distribution in Woodhaven
2000
2022

- 11,38190.8%White alone
- 4333.5%Hispanic
- 2922.3%Black alone
- 2011.6%Asian alone
- 1401.1%Two or more races
- 570.5%American Indian alone
- 240.2%Other race alone
- 20.02%Native Hawaiian and Other
Pacific Islander alone

-
- 10,15380.0%White alone
- 9857.8%Hispanic
- 7926.2%Black alone
- 3753.0%Two or more races
- 3272.6%Asian alone
- 250.2%American Indian alone
2000
2022
-
- 7,806,69178.6%White alone
- 1,402,04714.1%Black alone
- 323,8773.3%Hispanic
- 175,3111.8%Asian alone
- 163,4871.6%Two or more races
- 53,4210.5%American Indian alone
- 11,4650.1%Other race alone
- 2,1450.02%Native Hawaiian and Other
Pacific Islander alone

-
- 7,289,05172.6%White alone
- 1,310,46413.1%Black alone
- 572,4055.7%Hispanic
- 450,0314.5%Two or more races
- 335,7323.3%Asian alone
- 45,2170.5%Other race alone
- 29,0110.3%American Indian alone
- 2,2070.02%Native Hawaiian and Other
Pacific Islander alone

Income and house value in Woodhaven
- Median household income in 2022
- $76,754White non-Hispanic householders
- $56,784Black householders
- $140,737Asian householders
- $27,671Two or more races householders
- $79,568Hispanic or Latino race householders
- Median 2022 house value
- $235,737White Non-Hispanic householders
- $202,868Black or African American householders
- $169,847American Indian or Alaska Native householders
- $363,084Asian householders
- $277,167Some other race householders
- $237,571Two or more races householders
- $283,435Hispanic or Latino householders
Household income for White non-Hispanic householders

Household income for Black householders

Household income for Asian householders

Household income for Some other race householders

Household income for Two or more races householders

Household income for Hispanic or Latino race householders

Median age by race in Woodhaven
- 46.3Median age for White residents
- 44.9Males
- 48.5Females
- 54.8Median age for Black or African American residents
- 64.5Males
- 47.7Females
- -738,693,466.6Median age for American Indian / Alaska Native residents
- -795,074,757.3Males
- -684,380,031.5Females
- 46.4Median age for Asian residents
- 40.4Males
- 48.7Females
- -934,108,526.2Median age for Native Hawaiian / Pacific Islander residents
- -674,772,035.8Males
- -699,588,476.7Females
- 64.0Median age for Other race residents
- 34.4Males
- 62.6Females
- 28.6Median age for Two or more races residents
- 27.0Males
- 33.7Females
- 47.0Median age for White alone residents
- 44.4Males
- 50.3Females
- 38.4Median age for Hispanic or Latino residents
- 31.8Males
- 42.8Females
Owner/renter occupied households by race in Woodhaven
- House owners and renters - White residents
- 3,83982.9%Owner occupied
- 79317.1%Renter occupied
- House owners and renters - Black or African American residents
- 3210.9%Owner occupied
- 26589.1%Renter occupied
- House owners and renters - Asian residents
- 8669.4%Owner occupied
- 3830.6%Renter occupied
- House owners and renters - Other race residents
- 15182.9%Owner occupied
- 3117.1%Renter occupied
- House owners and renters - Two or more races residents
- 6850.3%Owner occupied
- 6749.7%Renter occupied
- House owners and renters - White alone residents
- 3,66282.6%Owner occupied
- 77217.4%Renter occupied
- House owners and renters - Hispanic or Latino residents
- 39085.0%Owner occupied
- 6915.0%Renter occupied
Language usage in Woodhaven
- English speakers - Total
- 94.6% of residents of Woodhaven speak English at home.
- 1.5% of residents speak Spanish at home
- 11360.4%Speak English very well
- 7439.6%Speak English less than very well
- 3.6% of residents speak other language at home
- 28063.6%Speak English very well
- 16036.4%Speak English less than very well
- English speakers - Born in the United States
- 96.0% of residents of Woodhaven speak English at home.
- 4.0% of residents speak Spanish at home
- 710.4%Speak English very well
- 6089.6%Speak English less than very well
- 0.8% of residents speak other language at home
- 14100.0%Speak English very well
- English speakers - Native, born elsewhere
- 97.7% of residents of Woodhaven speak English at home.
- 15.9% of residents speak Spanish at home
- 7100.0%Speak English very well
- English speakers - Foreign-born
- 34.6% of residents of Woodhaven speak English at home.
- 5.9% of residents speak Spanish at home
- 1131.4%Speak English very well
- 2468.6%Speak English less than very well
- 57.6% of residents speak other language at home
- 17852.4%Speak English very well
- 16247.6%Speak English less than very well
White (Caucasian) - Speak only English
| Native: | 99.8% (9,782) |
| Foreign-born: | 47.7% (109) |
White (Caucasian) - Speak another language
| Native: | 1.3% (127) |
| Foreign-born: | 53.0% (121) |
Black or African American - Speak only English
| Native: | 100.0% (789) |
| Foreign-born: | 100.0% (6) |
Other race - Speak another language
| Native: | 19.6% (37) |
| Foreign-born: | 100.0% (37) |
White alone - Speak only English
| Native: | 99.9% (9,373) |
| Foreign-born: | 42.8% (94) |
White alone - Speak another language
| Native: | 0.8% (70) |
| Foreign-born: | 56.2% (124) |
Hispanic or Latino - Speak only English
| Native: | 83.5% (743) |
| Foreign-born: | 23.5% (12) |
Hispanic or Latino - Speak another language
| Native: | 15.3% (136) |
| Foreign-born: | 72.0% (37) |
Foreign-born residents in Woodhaven
576 residents are foreign born (2.4% Asia, 1.4% Europe, 0.5% Latin America).
| This city: | 4.5% |
| Michigan: | 6.9% |


Marital status for residents in Woodhaven
Marital status - White (Caucasian) population 15 years and over
- Males
- 27.9%Never married
- 58.6%Now married
- 0.0%Separated
- 2.6%Widowed
- 10.9%Divorced
- Females
- 24.0%Never married
- 50.1%Now married
- 0.6%Separated
- 12.4%Widowed
- 12.9%Divorced
Women who gave birth in the past 12 months
| Now married: | 100.0% (110) |
| Unmarried: | 0.0% (0) |
Women who did not give birth in the past 12 months
| Now married: | 42.0% (838) |
| Unmarried: | 58.0% (1,155) |
Marital status - Black or African American population 15 years and over
- Males
- 37.3%Never married
- 61.0%Now married
- 0.0%Separated
- 0.7%Widowed
- 1.0%Divorced
- Females
- 36.5%Never married
- 23.6%Now married
- 4.1%Separated
- 23.4%Widowed
- 12.4%Divorced
Women who did not give birth in the past 12 months
| Now married: | 9.4% (16) |
| Unmarried: | 90.6% (155) |
Marital status - Asian population 15 years and over
- Males
- 35.0%Never married
- 65.0%Now married
- 0.0%Separated
- 0.0%Widowed
- 0.0%Divorced
- Females
- 20.7%Never married
- 63.7%Now married
- 0.0%Separated
- 0.0%Widowed
- 15.6%Divorced
Women who gave birth in the past 12 months
| Now married: | 100.0% (10) |
| Unmarried: | 0.0% (0) |
Women who did not give birth in the past 12 months
| Now married: | 52.5% (30) |
| Unmarried: | 47.5% (27) |
Marital status - Other race population 15 years and over
- Males
- 0.0%Never married
- 100.0%Now married
- 0.0%Separated
- 0.0%Widowed
- 0.0%Divorced
- Females
- 0.0%Never married
- 69.9%Now married
- 0.0%Separated
- 0.0%Widowed
- 30.1%Divorced
Women who did not give birth in the past 12 months
| Now married: | 100.0% (28) |
| Unmarried: | 0.0% (0) |
Marital status - Two or more races population 15 years and over
- Males
- 77.1%Never married
- 20.0%Now married
- 0.0%Separated
- 0.0%Widowed
- 2.9%Divorced
- Females
- 57.9%Never married
- 10.3%Now married
- 0.0%Separated
- 23.4%Widowed
- 8.3%Divorced
Women who did not give birth in the past 12 months
| Now married: | 15.2% (21) |
| Unmarried: | 84.8% (117) |
Marital status - White alone, not Hispanic / Latino population 15 years and over
- Males
- 27.8%Never married
- 58.5%Now married
- 0.0%Separated
- 2.7%Widowed
- 11.0%Divorced
- Females
- 23.7%Never married
- 48.8%Now married
- 0.7%Separated
- 13.1%Widowed
- 13.7%Divorced
Women who gave birth in the past 12 months
| Now married: | 100.0% (113) |
| Unmarried: | 0.0% (0) |
Women who did not give birth in the past 12 months
| Now married: | 39.9% (728) |
| Unmarried: | 60.1% (1,098) |
Marital status - Hispanic or Latino population 15 years and over
- Males
- 32.3%Never married
- 62.1%Now married
- 0.0%Separated
- 0.0%Widowed
- 5.6%Divorced
- Females
- 21.1%Never married
- 64.7%Now married
- 0.0%Separated
- 2.8%Widowed
- 11.4%Divorced
Women who did not give birth in the past 12 months
| Now married: | 58.9% (164) |
| Unmarried: | 41.1% (115) |
Ancestries in Woodhaven

- 1,03419.8%American
- 67913.0%Polish
- 5069.7%Irish
- 4167.9%German
- 3466.6%Italian
- 2434.6%Scotch-Irish
- 2284.4%English
- 1452.8%Greek
- 1282.4%Scottish
- 821.6%Hungarian
- 721.4%French Canadian
- 701.3%Swedish
- 621.2%French
- 541.0%Serbian
- 230.4%European
- 210.4%Finnish
- 180.3%Belgian
- 180.3%Eastern European
- 180.3%Slovene
- 170.3%Albanian
- 170.3%Maltese
- 110.2%Lithuanian
- 90.2%Norwegian
- 70.1%Dutch
- 70.1%Russian
- 50.10%Ukrainian
- 40.08%Armenian

Geographical mobility in Woodhaven

- Same house 1 year ago
- 9,91694.1%White (Caucasian)
- 69587.4%Black or African American
- 43100.0%American Indian / Alaska Native
- 30392.7%Asian
- 17278.2%Other race
- 41181.3%Two or more races
- 9,46793.9%White alone, not Hispanic / Latino
- 87688.5%Hispanic or Latino

-
- Moved within same county
- 4364.1%White / Caucasian
- 9712.1%Black or African American
- 288.7%Asian
- 5324.2%Other race
- 7114.0%Two or more races
- 4204.2%White alone, not Hispanic / Latino
- 10210.3%Hispanic or Latino

-
- Moved within same state
- 1231.2%White / Caucasian
- 275.4%Two or more races
- 1251.2%White alone, not Hispanic / Latino

-
- Moved from different state
- 380.4%White / Caucasian
- 370.4%White alone, not Hispanic / Latino

Children Nativity (place of birth) in Woodhaven
Place of birth for residents in Woodhaven
![Place of birth for the foreign-born population - Regions]()
- 312Asia
- 178Europe
- 130South Eastern Asia
- 114South Central Asia
- 86Americas
- 68Southern Europe
- 62Latin America
- 55Central America
- 47Northern Europe
- 47Eastern Europe
- 47Eastern Asia
- 36China
- 24Northern America
- 21Western Asia
- 16Western Europe
- 7South America

![Place of birth for the foreign-born population - Countries]()
- 130Philippines
- 81Pakistan
- 55Mexico
- 47United Kingdom
- 45Greece
- 33India
- 24Canada
- 21Saudi Arabia
- 19Hong Kong
- 17China
- 15Russia
- 11Italy
- 10Poland
- 10Korea
- 8Germany
- 8Netherlands
- 7Albania
- 7Guyana
- 5Hungary
- 1Japan

Grandparents responsible for own grandchildren in Woodhaven
Zip codes: 48183.