Races in Woburn, Massachusetts (MA) Detailed Stats
Data:
Races - White alone (%)
Races - White alone (% change since 2000)
Races - Black alone (%)
Races - Black alone (% change since 2000)
Races - American Indian alone (%)
Races - American Indian alone (% change since 2000)
Races - Asian alone (%)
Races - Asian alone (% change since 2000)
Races - Hispanic (%)
Races - Hispanic (% change since 2000)
Races - Native Hawaiian and Other Pacific Islander alone (%)
Races - Native Hawaiian and Other Pacific Islander alone (% change since 2000)
Races - Two or more races(%)
Races - Two or more races(% change since 2000)
Races - Other race alone (%)
Races - Other race alone (% change since 2000)
Racial diversity
Place of birth - Born in state of residence (%)
Place of birth - Born in state of residence (%) - White
Place of birth - Born in state of residence (%) - Black or African American
Place of birth - Born in state of residence (%) - Asian
Place of birth - Born in state of residence (%) - Hispanic or Latino
Place of birth - Born in state of residence (%) - American Indian and Alaska Native
Place of birth - Born in state of residence (%) - Multirace
Place of birth - Born in state of residence (%) - Other Race
Place of birth - Born in other state (%)
Place of birth - Born in other state (%) - White
Place of birth - Born in other state (%) - Black or African American
Place of birth - Born in other state (%) - Asian
Place of birth - Born in other state (%) - Hispanic or Latino
Place of birth - Born in other state (%) - American Indian and Alaska Native
Place of birth - Born in other state (%) - Multirace
Place of birth - Born in other state (%) - Other Race
Place of birth - Native, outside of US (%)
Place of birth - Native, outside of US (%) - White
Place of birth - Native, outside of US (%) - Black or African American
Place of birth - Native, outside of US (%) - Asian
Place of birth - Native, outside of US (%) - Hispanic or Latino
Place of birth - Native, outside of US (%) - American Indian and Alaska Native
Place of birth - Native, outside of US (%) - Multirace
Place of birth - Native, outside of US (%) - Other Race
Place of birth - Foreign born (%)
Place of birth - Foreign born (%) - White
Place of birth - Foreign born (%) - Black or African American
Place of birth - Foreign born (%) - Asian
Place of birth - Foreign born (%) - Hispanic or Latino
Place of birth - Foreign born (%) - American Indian and Alaska Native
Place of birth - Foreign born (%) - Multirace
Place of birth - Foreign born (%) - Other Race
Residents speaking English at home (%)
Residents speaking English at home - Born in the United States (%)
Residents speaking English at home - Native, born elsewhere (%)
Residents speaking English at home - Foreign born (%)
Residents speaking Spanish at home (%)
Residents speaking Spanish at home - Born in the United States (%)
Residents speaking Spanish at home - Native, born elsewhere (%)
Residents speaking Spanish at home - Foreign born (%)
Residents speaking other language at home (%)
Residents speaking other language at home - Born in the United States (%)
Residents speaking other language at home - Native, born elsewhere (%)
Residents speaking other language at home - Foreign born (%)
Marital status - Never married (%)
Marital status - Now married (%)
Marital status - Separated (%)
Marital status - Widowed (%)
Marital status - Divorced (%)
Ancestries Reported - Arab (%)
Ancestries Reported - Czech (%)
Ancestries Reported - Danish (%)
Ancestries Reported - Dutch (%)
Ancestries Reported - English (%)
Ancestries Reported - French (%)
Ancestries Reported - French Canadian (%)
Ancestries Reported - German (%)
Ancestries Reported - Greek (%)
Ancestries Reported - Hungarian (%)
Ancestries Reported - Irish (%)
Ancestries Reported - Italian (%)
Ancestries Reported - Lithuanian (%)
Ancestries Reported - Norwegian (%)
Ancestries Reported - Polish (%)
Ancestries Reported - Portuguese (%)
Ancestries Reported - Russian (%)
Ancestries Reported - Scotch-Irish (%)
Ancestries Reported - Scottish (%)
Ancestries Reported - Slovak (%)
Ancestries Reported - Subsaharan African (%)
Ancestries Reported - Swedish (%)
Ancestries Reported - Swiss (%)
Ancestries Reported - Ukrainian (%)
Ancestries Reported - United States (%)
Ancestries Reported - Welsh (%)
Ancestries Reported - West Indian (%)
Ancestries Reported - Other (%)
Geographical mobility - Same house 1 year ago (%)
Geographical mobility - Same house 1 year ago (%) - White
Geographical mobility - Same house 1 year ago (%) - Black or African American
Geographical mobility - Same house 1 year ago (%) - Asian
Geographical mobility - Same house 1 year ago (%) - Hispanic or Latino
Geographical mobility - Same house 1 year ago (%) - American Indian and Alaska Native
Geographical mobility - Same house 1 year ago (%) - Multirace
Geographical mobility - Same house 1 year ago (%) - Other Race
Geographical mobility - Moved within same county (%)
Geographical mobility - Moved within same county (%) - White
Geographical mobility - Moved within same county (%) - Black or African American
Geographical mobility - Moved within same county (%) - Asian
Geographical mobility - Moved within same county (%) - Hispanic or Latino
Geographical mobility - Moved within same county (%) - American Indian and Alaska Native
Geographical mobility - Moved within same county (%) - Multirace
Geographical mobility - Moved within same county (%) - Other Race
Geographical mobility - Moved from different county within same state (%)
Geographical mobility - Moved from different county within same state (%) - White
Geographical mobility - Moved from different county within same state (%) - Black or African American
Geographical mobility - Moved from different county within same state (%) - Asian
Geographical mobility - Moved from different county within same state (%) - Hispanic or Latino
Geographical mobility - Moved from different county within same state (%) - American Indian and Alaska Native
Geographical mobility - Moved from different county within same state (%) - Multirace
Geographical mobility - Moved from different county within same state (%) - Other Race
Geographical mobility - Moved from different state (%)
Geographical mobility - Moved from different state (%) - White
Geographical mobility - Moved from different state (%) - Black or African American
Geographical mobility - Moved from different state (%) - Asian
Geographical mobility - Moved from different state (%) - Hispanic or Latino
Geographical mobility - Moved from different state (%) - American Indian and Alaska Native
Geographical mobility - Moved from different state (%) - Multirace
Geographical mobility - Moved from different state (%) - Other Race
Geographical mobility - Moved from abroad (%)
Geographical mobility - Moved from abroad (%) - White
Geographical mobility - Moved from abroad (%) - Black or African American
Geographical mobility - Moved from abroad (%) - Asian
Geographical mobility - Moved from abroad (%) - Hispanic or Latino
Geographical mobility - Moved from abroad (%) - American Indian and Alaska Native
Geographical mobility - Moved from abroad (%) - Multirace
Geographical mobility - Moved from abroad (%) - Other Race
Place of birth for the foreign-born population - Ireland (%)
Place of birth for the foreign-born population - Denmark (%)
Place of birth for the foreign-born population - Norway (%)
Place of birth for the foreign-born population - Sweden (%)
Place of birth for the foreign-born population - United Kingdom (%)
Place of birth for the foreign-born population - England (%)
Place of birth for the foreign-born population - Scotland (%)
Place of birth for the foreign-born population - Other Northern Europe (%)
Place of birth for the foreign-born population - Austria (%)
Place of birth for the foreign-born population - Belgium (%)
Place of birth for the foreign-born population - France (%)
Place of birth for the foreign-born population - Germany (%)
Place of birth for the foreign-born population - Netherlands (%)
Place of birth for the foreign-born population - Switzerland (%)
Place of birth for the foreign-born population - Other Western Europe (%)
Place of birth for the foreign-born population - Greece (%)
Place of birth for the foreign-born population - Italy (%)
Place of birth for the foreign-born population - Portugal (%)
Place of birth for the foreign-born population - Spain (%)
Place of birth for the foreign-born population - Other Southern Europe (%)
Place of birth for the foreign-born population - Albania (%)
Place of birth for the foreign-born population - Belarus (%)
Place of birth for the foreign-born population - Bosnia and Herzegovina (%)
Place of birth for the foreign-born population - Bulgaria (%)
Place of birth for the foreign-born population - Croatia (%)
Place of birth for the foreign-born population - Czechoslovakia (%)
Place of birth for the foreign-born population - Hungary (%)
Place of birth for the foreign-born population - Latvia (%)
Place of birth for the foreign-born population - Lithuania (%)
Place of birth for the foreign-born population - North Macedonia (Macedonia) (%)
Place of birth for the foreign-born population - Moldova (%)
Place of birth for the foreign-born population - Poland (%)
Place of birth for the foreign-born population - Romania (%)
Place of birth for the foreign-born population - Russia (%)
Place of birth for the foreign-born population - Serbia (%)
Place of birth for the foreign-born population - Ukraine (%)
Place of birth for the foreign-born population - Other Eastern Europe (%)
Place of birth for the foreign-born population - China (%)
Place of birth for the foreign-born population - Hong Kong (%)
Place of birth for the foreign-born population - Taiwan (%)
Place of birth for the foreign-born population - Japan (%)
Place of birth for the foreign-born population - Korea (%)
Place of birth for the foreign-born population - Other Eastern Asia (%)
Place of birth for the foreign-born population - Afghanistan (%)
Place of birth for the foreign-born population - Bangladesh (%)
Place of birth for the foreign-born population - India (%)
Place of birth for the foreign-born population - Iran (%)
Place of birth for the foreign-born population - Kazakhstan (%)
Place of birth for the foreign-born population - Nepal (%)
Place of birth for the foreign-born population - Pakistan (%)
Place of birth for the foreign-born population - Sri Lanka (%)
Place of birth for the foreign-born population - Uzbekistan (%)
Place of birth for the foreign-born population - Other South Central Asia (%)
Place of birth for the foreign-born population - Burma (%)
Place of birth for the foreign-born population - Cambodia (%)
Place of birth for the foreign-born population - Indonesia (%)
Place of birth for the foreign-born population - Laos (%)
Place of birth for the foreign-born population - Malaysia (%)
Place of birth for the foreign-born population - Philippines (%)
Place of birth for the foreign-born population - Singapore (%)
Place of birth for the foreign-born population - Thailand (%)
Place of birth for the foreign-born population - Vietnam (%)
Place of birth for the foreign-born population - Other South Eastern Asia (%)
Place of birth for the foreign-born population - Armenia (%)
Place of birth for the foreign-born population - Iraq (%)
Place of birth for the foreign-born population - Israel (%)
Place of birth for the foreign-born population - Jordan (%)
Place of birth for the foreign-born population - Kuwait (%)
Place of birth for the foreign-born population - Lebanon (%)
Place of birth for the foreign-born population - Saudi Arabia (%)
Place of birth for the foreign-born population - Syria (%)
Place of birth for the foreign-born population - Turkey (%)
Place of birth for the foreign-born population - Yemen (%)
Place of birth for the foreign-born population - Other Western Asia (%)
Place of birth for the foreign-born population - Eritrea (%)
Place of birth for the foreign-born population - Ethiopia (%)
Place of birth for the foreign-born population - Kenya (%)
Place of birth for the foreign-born population - Somalia (%)
Place of birth for the foreign-born population - Uganda (%)
Place of birth for the foreign-born population - Zimbabwe (%)
Place of birth for the foreign-born population - Other Eastern Africa (%)
Place of birth for the foreign-born population - Cameroon (%)
Place of birth for the foreign-born population - Congo (%)
Place of birth for the foreign-born population - Democratic Republic of Congo (Zaire) (%)
Place of birth for the foreign-born population - Other Middle Africa (%)
Place of birth for the foreign-born population - Egypt (%)
Place of birth for the foreign-born population - Morocco (%)
Place of birth for the foreign-born population - Sudan (%)
Place of birth for the foreign-born population - Other Northern Africa (%)
Place of birth for the foreign-born population - South Africa (%)
Place of birth for the foreign-born population - Other Southern Africa (%)
Place of birth for the foreign-born population - Cabo Verde (%)
Place of birth for the foreign-born population - Ghana (%)
Place of birth for the foreign-born population - Liberia (%)
Place of birth for the foreign-born population - Nigeria (%)
Place of birth for the foreign-born population - Senegal (%)
Place of birth for the foreign-born population - Sierra Leone (%)
Place of birth for the foreign-born population - Other Western Africa (%)
Place of birth for the foreign-born population - Australia (%)
Place of birth for the foreign-born population - New Zealand (%)
Place of birth for the foreign-born population - Fiji (%)
Place of birth for the foreign-born population - Micronesia (%)
Place of birth for the foreign-born population - Bahamas (%)
Place of birth for the foreign-born population - Barbados (%)
Place of birth for the foreign-born population - Cuba (%)
Place of birth for the foreign-born population - Dominica (%)
Place of birth for the foreign-born population - Dominican Republic (%)
Place of birth for the foreign-born population - Grenada (%)
Place of birth for the foreign-born population - Haiti (%)
Place of birth for the foreign-born population - Jamaica (%)
Place of birth for the foreign-born population - St. Vincent and the Grenadines (%)
Place of birth for the foreign-born population - Trinidad and Tobago (%)
Place of birth for the foreign-born population - West Indies (%)
Place of birth for the foreign-born population - Other Caribbean (%)
Place of birth for the foreign-born population - Belize (%)
Place of birth for the foreign-born population - Costa Rica (%)
Place of birth for the foreign-born population - El Salvador (%)
Place of birth for the foreign-born population - Guatemala (%)
Place of birth for the foreign-born population - Honduras (%)
Place of birth for the foreign-born population - Mexico (%)
Place of birth for the foreign-born population - Nicaragua (%)
Place of birth for the foreign-born population - Panama (%)
Place of birth for the foreign-born population - Other Central America (%)
Place of birth for the foreign-born population - Argentina (%)
Place of birth for the foreign-born population - Bolivia (%)
Place of birth for the foreign-born population - Brazil (%)
Place of birth for the foreign-born population - Chile (%)
Place of birth for the foreign-born population - Colombia (%)
Place of birth for the foreign-born population - Ecuador (%)
Place of birth for the foreign-born population - Guyana (%)
Place of birth for the foreign-born population - Peru (%)
Place of birth for the foreign-born population - Uruguay (%)
Place of birth for the foreign-born population - Venezuela (%)
Place of birth for the foreign-born population - Other South America (%)
Place of birth for the foreign-born population - Canada (%)
Place of birth for the foreign-born population - Other Northern America (%)
Place of birth for the foreign-born population - Other (%)
Latest news about races in Woburn, MA collected exclusively by city-data.com from local newspapers, TV, and radio stations
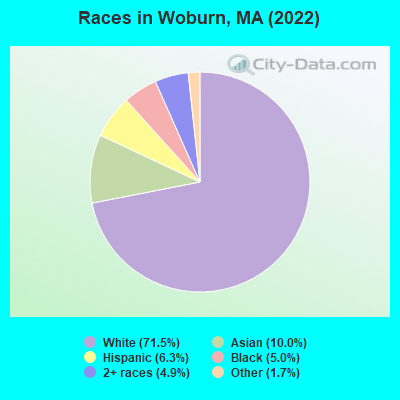
According to 2022 data, the most numerous races in Woburn, MA are White alone (29,198 residents), Hispanic (2,590 residents), and Asian alone (4,086 residents). 74.7% of Woburn residents speak English at home. 20.9% of Woburn, MA residents are foreign-born (7.2% born in Asia, 7.1% born in Latin America, 4.2% born in Europe), which is 14.0% greater than the foreign-born rate of 18.0% across the entire state of Massachusetts.
Race distribution in Woburn
2000 2022
5,198,359 81.9% White alone 428,729 6.8% Hispanic 318,329 5.0% Black alone 236,786 3.7% Asian alone 110,338 1.7% Two or more races 43,586 0.7% Other race alone 11,264 0.2% American Indian alone 1,706 0.03% Native Hawaiian and Other
4,676,627 67.0% White alone 911,038 13.0% Hispanic 501,463 7.2% Asian alone 459,740 6.6% Black alone 341,889 4.9% Two or more races 84,403 1.2% Other race alone 5,838 0.08% American Indian alone 976 0.01% Native Hawaiian and Other
Income and house value in Woburn Median household income in 2022 $105,238 White non-Hispanic householders$62,450 Black householders$72,746 Asian householders$81,401 Some other race householders$147,817 Two or more races householders$102,020 Hispanic or Latino race householdersMedian 2022 house value $652,019 White Non-Hispanic householdersover $1,000,000 Black or African American householders$483,142 American Indian or Alaska Native householders $624,369 Asian householders$434,085 Some other race householders$522,686 Two or more races householders$444,194 Hispanic or Latino householders
Median age by race in Woburn
43.5 Median age for White residents42.3 46.5 29.4 Median age for Black or African American residents24.8 40.2 53.9 Median age for American Indian / Alaska Native residents-751,004,015.3 -1,078,313,251.9 34.6 Median age for Asian residents33.3 36.8 -514,227,641.8 Median age for Native Hawaiian / Pacific Islander residents-513,131,312.6 -508,717,948.2 28.5 Median age for Other race residents26.6 31.3 31.9 Median age for Two or more races residents35.8 23.3 43.6 Median age for White alone residents42.1 46.7 24.9 Median age for Hispanic or Latino residents26.9 24.2
Owner/renter occupied households by race in Woburn
House owners and renters - White residents 8,192 65.7% Owner occupied4,277 34.3% Renter occupiedHouse owners and renters - Black or African American residents 195 27.0% Owner occupied528 73.0% Renter occupiedHouse owners and renters - American Indian / Alaska Native residents 22 100.0% Owner occupiedHouse owners and renters - Asian residents 499 31.9% Owner occupied1,068 68.1% Renter occupiedHouse owners and renters - Other race residents 213 37.9% Owner occupied349 62.1% Renter occupiedHouse owners and renters - Two or more races residents 431 54.8% Owner occupied356 45.2% Renter occupiedHouse owners and renters - White alone residents 8,171 66.1% Owner occupied4,197 33.9% Renter occupiedHouse owners and renters - Hispanic or Latino residents 229 31.7% Owner occupied493 68.3% Renter occupied
Language usage in Woburn
English speakers - Total 74.7% of residents of Woburn speak English at home.
4.4% of residents speak Spanish at home 607 35.9% Speak English very well1,084 64.1% Speak English less than very well20.8% of residents speak other language at home 5,063 63.3% Speak English very well2,936 36.7% Speak English less than very well
English speakers - Born in the United States 91.9% of residents of Woburn speak English at home.
2.8% of residents speak Spanish at home 119 75.3% Speak English very well39 24.7% Speak English less than very well5.0% of residents speak other language at home 258 91.5% Speak English very well24 8.5% Speak English less than very well
English speakers - Native, born elsewhere 78.6% of residents of Woburn speak English at home.
7.8% of residents speak Spanish at home 23 56.1% Speak English very well18 43.9% Speak English less than very well5.9% of residents speak other language at home 31 100.0% Speak English very well
English speakers - Foreign-born 13.2% of residents of Woburn speak English at home.
13.4% of residents speak Spanish at home 221 19.6% Speak English very well908 80.4% Speak English less than very well73.4% of residents speak other language at home 3,366 54.6% Speak English very well2,800 45.4% Speak English less than very well
White (Caucasian) - Speak only English Native:
95.7% (24,884)Foreign-born:
20.7% (481)
White (Caucasian) - Speak another language Native:
4.5% (1,159)Foreign-born:
79.5% (1,850)
Black or African American - Speak only English Native:
85.2% (719)Foreign-born:
28.2% (289)
Black or African American - Speak another language Native:
13.2% (112)Foreign-born:
71.8% (736)
Asian - Speak only English Native:
57.3% (611)Foreign-born:
6.4% (171)
Asian - Speak another language Native:
42.7% (456)Foreign-born:
94.3% (2,505)
Other race - Speak only English Native:
58.1% (272)Foreign-born:
3.0% (40)
Other race - Speak another language Native:
46.0% (216)Foreign-born:
96.6% (1,256)
Two or more races - Speak only English Native:
78.7% (1,037)Foreign-born:
16.5% (170)
Two or more races - Speak another language Native:
19.9% (262)Foreign-born:
83.2% (858)
White alone - Speak only English Native:
95.9% (24,799)Foreign-born:
21.9% (476)
White alone - Speak another language Native:
4.1% (1,051)Foreign-born:
78.6% (1,710)
Hispanic or Latino - Speak only English Native:
48.5% (536)Foreign-born:
0.9% (11)
Hispanic or Latino - Speak another language Native:
51.7% (570)Foreign-born:
99.1% (1,195)
Foreign-born residents in Woburn 8,549 residents are foreign born (7.2% Asia , 7.1% Latin America , 4.2% Europe ).
This city:
20.9%Massachusetts:
17.6%
Marital status for residents in Woburn Marital status - White (Caucasian) population 15 years and over
Males 38.0% Never married49.0% Now married0.5% Separated2.5% Widowed10.0% DivorcedFemales 33.0% Never married41.7% Now married1.1% Separated10.6% Widowed13.6% DivorcedWomen who gave birth in the past 12 months Now married:
96.2% (279)Unmarried:
3.8% (11)
Women who did not give birth in the past 12 months Now married:
37.3% (2,409)Unmarried:
62.7% (4,043)
Marital status - Black or African American population 15 years and over
Males 30.8% Never married59.2% Now married7.6% Separated0.0% Widowed2.5% DivorcedFemales 45.9% Never married33.9% Now married3.1% Separated4.1% Widowed13.0% DivorcedWomen who gave birth in the past 12 months Now married:
0.0% (0)Unmarried:
100.0% (24)
Women who did not give birth in the past 12 months Now married:
41.3% (245)Unmarried:
58.7% (348)
Marital status - American Indian / Alaska Native population 15 years and over
Males 100.0% Never married0.0% Now married0.0% Separated0.0% Widowed0.0% DivorcedFemales 0.0% Never married100.0% Now married0.0% Separated0.0% Widowed0.0% DivorcedWomen who did not give birth in the past 12 months Now married:
100.0% (21)Unmarried:
0.0% (0)
Marital status - Asian population 15 years and over
Males 23.9% Never married76.1% Now married0.0% Separated0.0% Widowed0.1% DivorcedFemales 20.8% Never married71.5% Now married0.4% Separated1.8% Widowed5.5% DivorcedWomen who gave birth in the past 12 months Now married:
100.0% (184)Unmarried:
0.0% (0)
Women who did not give birth in the past 12 months Now married:
56.2% (609)Unmarried:
43.8% (474)
Marital status - Other race population 15 years and over
Males 62.1% Never married25.9% Now married4.9% Separated0.0% Widowed7.1% DivorcedFemales 26.0% Never married48.2% Now married7.0% Separated2.4% Widowed16.5% DivorcedWomen who gave birth in the past 12 months Now married:
100.0% (14)Unmarried:
0.0% (0)
Women who did not give birth in the past 12 months Now married:
55.4% (251)Unmarried:
44.6% (202)
Marital status - Two or more races population 15 years and over
Males 31.1% Never married61.7% Now married0.0% Separated0.0% Widowed7.2% DivorcedFemales 32.7% Never married62.6% Now married0.0% Separated1.0% Widowed3.7% DivorcedWomen who did not give birth in the past 12 months Now married:
55.3% (325)Unmarried:
44.7% (262)
Marital status - White alone, not Hispanic / Latino population 15 years and over
Males 37.6% Never married49.4% Now married0.5% Separated2.5% Widowed10.0% DivorcedFemales 32.9% Never married41.5% Now married1.1% Separated10.9% Widowed13.7% DivorcedWomen who gave birth in the past 12 months Now married:
96.2% (284)Unmarried:
3.8% (11)
Women who did not give birth in the past 12 months Now married:
36.9% (2,338)Unmarried:
63.1% (3,994)
Marital status - Hispanic or Latino population 15 years and over
Males 60.8% Never married32.8% Now married0.0% Separated0.8% Widowed5.7% DivorcedFemales 35.2% Never married49.2% Now married4.9% Separated1.7% Widowed9.1% DivorcedWomen who did not give birth in the past 12 months Now married:
54.0% (342)Unmarried:
46.0% (291)
Ancestries in Woburn
4,596 23.4% Irish2,743 14.0% Italian757 3.9% Portuguese673 3.4% Brazilian660 3.4% English639 3.3% Haitian455 2.3% Greek408 2.1% American371 1.9% Danish360 1.8% German268 1.4% Ugandan262 1.3% Albanian237 1.2% French Canadian217 1.1% Armenian181 0.9% Kenyan168 0.9% Bulgarian143 0.7% Polish125 0.6% European107 0.5% Scottish104 0.5% Swedish85 0.4% Northern European65 0.3% Canadian61 0.3% French61 0.3% Ukrainian60 0.3% Lebanese58 0.3% Sudanese53 0.3% Lithuanian51 0.3% Hungarian48 0.2% African47 0.2% Eastern European47 0.2% British44 0.2% Russian36 0.2% Egyptian32 0.2% Syrian31 0.2% Romanian31 0.2% Palestinian29 0.1% Scotch-Irish26 0.1% Barbadian25 0.1% Scandinavian24 0.1% Moroccan17 0.09% New Zealander11 0.06% Afghan11 0.06% Iranian8 0.04% Nigerian6 0.03% Arab1 0.01% Croatian
Geographical mobility in Woburn Same house 1 year ago 26,301 89.8% White (Caucasian)1,637 80.3% Black or African American39 100.0% American Indian / Alaska Native3,108 79.5% Asian1,370 76.0% Other race1,940 67.4% Two or more races26,185 90.3% White alone, not Hispanic / Latino1,789 69.1% Hispanic or LatinoMoved within same county 1,544 5.3% White / Caucasian239 11.7% Black or African American359 9.2% Asian331 18.4% Other race834 29.0% Two or more races1,468 5.1% White alone, not Hispanic / Latino623 24.1% Hispanic or LatinoMoved within same state 716 2.4% White / Caucasian99 4.8% Black or African American31 0.8% Asian49 2.7% Other race639 2.2% White alone, not Hispanic / Latino129 5.0% Hispanic or LatinoMoved from different state 595 2.0% White / Caucasian22 1.1% Black or African American187 4.8% Asian36 2.0% Other race104 3.6% Two or more races587 2.0% White alone, not Hispanic / Latino36 1.4% Hispanic or LatinoMoved from abroad 116 0.4% White221 5.7% Asian22 0.8% Two or more races116 0.4% White alone, not Hispanic / Latino
Children Nativity (place of birth) in Woburn
Children under 6 years - Living with two parents Both parents native 1,128 100.0% NativeBoth parents foreign-born 518 71.9% Native202 28.1% Foreign-bornOne native, one foreign-born parent 251 100.0% NativeChildren under 6 years - Living with one parent Native parent 417 100.0% NativeForeign-born parent 67 100.0% NativeChildren 6 to 17 years - Living with two parents Both parents native 2,313 100.0% NativeBoth parents foreign-born 601 83.0% Native123 17.0% Foreign-bornOne native, one foreign-born parent 313 100.0% NativeChildren 6 to 17 years - Living with one parent Native parent 735 89.7% Native84 10.3% Foreign-bornForeign-born parent 291 65.5% Native153 34.5% Foreign-born
Grandparents responsible for own grandchildren in Woburn
Grandparents (30 to 59 years) White / Caucasian 9 7.5% Responsible for grandchildren113 92.5% Not responsible for grandchildrenAsian 44 100.0% Not responsible for grandchildrenWhite alone, not Hispanic / Latino 10 7.7% Responsible for grandchildren124 92.3% Not responsible for grandchildren
Grandparents (60 years and over) White / Caucasian 9 2.8% Responsible for grandchildren313 97.2% Not responsible for grandchildrenAsian 52 100.0% Not responsible for grandchildrenWhite alone, not Hispanic / Latino 9 2.8% Responsible for grandchildren310 97.2% Not responsible for grandchildren