Races in Winter Springs, Florida (FL) Detailed Stats
Data:
Races - White alone (%)
Races - White alone (% change since 2000)
Races - Black alone (%)
Races - Black alone (% change since 2000)
Races - American Indian alone (%)
Races - American Indian alone (% change since 2000)
Races - Asian alone (%)
Races - Asian alone (% change since 2000)
Races - Hispanic (%)
Races - Hispanic (% change since 2000)
Races - Native Hawaiian and Other Pacific Islander alone (%)
Races - Native Hawaiian and Other Pacific Islander alone (% change since 2000)
Races - Two or more races(%)
Races - Two or more races(% change since 2000)
Races - Other race alone (%)
Races - Other race alone (% change since 2000)
Racial diversity
Place of birth - Born in state of residence (%)
Place of birth - Born in state of residence (%) - White
Place of birth - Born in state of residence (%) - Black or African American
Place of birth - Born in state of residence (%) - Asian
Place of birth - Born in state of residence (%) - Hispanic or Latino
Place of birth - Born in state of residence (%) - American Indian and Alaska Native
Place of birth - Born in state of residence (%) - Multirace
Place of birth - Born in state of residence (%) - Other Race
Place of birth - Born in other state (%)
Place of birth - Born in other state (%) - White
Place of birth - Born in other state (%) - Black or African American
Place of birth - Born in other state (%) - Asian
Place of birth - Born in other state (%) - Hispanic or Latino
Place of birth - Born in other state (%) - American Indian and Alaska Native
Place of birth - Born in other state (%) - Multirace
Place of birth - Born in other state (%) - Other Race
Place of birth - Native, outside of US (%)
Place of birth - Native, outside of US (%) - White
Place of birth - Native, outside of US (%) - Black or African American
Place of birth - Native, outside of US (%) - Asian
Place of birth - Native, outside of US (%) - Hispanic or Latino
Place of birth - Native, outside of US (%) - American Indian and Alaska Native
Place of birth - Native, outside of US (%) - Multirace
Place of birth - Native, outside of US (%) - Other Race
Place of birth - Foreign born (%)
Place of birth - Foreign born (%) - White
Place of birth - Foreign born (%) - Black or African American
Place of birth - Foreign born (%) - Asian
Place of birth - Foreign born (%) - Hispanic or Latino
Place of birth - Foreign born (%) - American Indian and Alaska Native
Place of birth - Foreign born (%) - Multirace
Place of birth - Foreign born (%) - Other Race
Residents speaking English at home (%)
Residents speaking English at home - Born in the United States (%)
Residents speaking English at home - Native, born elsewhere (%)
Residents speaking English at home - Foreign born (%)
Residents speaking Spanish at home (%)
Residents speaking Spanish at home - Born in the United States (%)
Residents speaking Spanish at home - Native, born elsewhere (%)
Residents speaking Spanish at home - Foreign born (%)
Residents speaking other language at home (%)
Residents speaking other language at home - Born in the United States (%)
Residents speaking other language at home - Native, born elsewhere (%)
Residents speaking other language at home - Foreign born (%)
Marital status - Never married (%)
Marital status - Now married (%)
Marital status - Separated (%)
Marital status - Widowed (%)
Marital status - Divorced (%)
Ancestries Reported - Arab (%)
Ancestries Reported - Czech (%)
Ancestries Reported - Danish (%)
Ancestries Reported - Dutch (%)
Ancestries Reported - English (%)
Ancestries Reported - French (%)
Ancestries Reported - French Canadian (%)
Ancestries Reported - German (%)
Ancestries Reported - Greek (%)
Ancestries Reported - Hungarian (%)
Ancestries Reported - Irish (%)
Ancestries Reported - Italian (%)
Ancestries Reported - Lithuanian (%)
Ancestries Reported - Norwegian (%)
Ancestries Reported - Polish (%)
Ancestries Reported - Portuguese (%)
Ancestries Reported - Russian (%)
Ancestries Reported - Scotch-Irish (%)
Ancestries Reported - Scottish (%)
Ancestries Reported - Slovak (%)
Ancestries Reported - Subsaharan African (%)
Ancestries Reported - Swedish (%)
Ancestries Reported - Swiss (%)
Ancestries Reported - Ukrainian (%)
Ancestries Reported - United States (%)
Ancestries Reported - Welsh (%)
Ancestries Reported - West Indian (%)
Ancestries Reported - Other (%)
Geographical mobility - Same house 1 year ago (%)
Geographical mobility - Same house 1 year ago (%) - White
Geographical mobility - Same house 1 year ago (%) - Black or African American
Geographical mobility - Same house 1 year ago (%) - Asian
Geographical mobility - Same house 1 year ago (%) - Hispanic or Latino
Geographical mobility - Same house 1 year ago (%) - American Indian and Alaska Native
Geographical mobility - Same house 1 year ago (%) - Multirace
Geographical mobility - Same house 1 year ago (%) - Other Race
Geographical mobility - Moved within same county (%)
Geographical mobility - Moved within same county (%) - White
Geographical mobility - Moved within same county (%) - Black or African American
Geographical mobility - Moved within same county (%) - Asian
Geographical mobility - Moved within same county (%) - Hispanic or Latino
Geographical mobility - Moved within same county (%) - American Indian and Alaska Native
Geographical mobility - Moved within same county (%) - Multirace
Geographical mobility - Moved within same county (%) - Other Race
Geographical mobility - Moved from different county within same state (%)
Geographical mobility - Moved from different county within same state (%) - White
Geographical mobility - Moved from different county within same state (%) - Black or African American
Geographical mobility - Moved from different county within same state (%) - Asian
Geographical mobility - Moved from different county within same state (%) - Hispanic or Latino
Geographical mobility - Moved from different county within same state (%) - American Indian and Alaska Native
Geographical mobility - Moved from different county within same state (%) - Multirace
Geographical mobility - Moved from different county within same state (%) - Other Race
Geographical mobility - Moved from different state (%)
Geographical mobility - Moved from different state (%) - White
Geographical mobility - Moved from different state (%) - Black or African American
Geographical mobility - Moved from different state (%) - Asian
Geographical mobility - Moved from different state (%) - Hispanic or Latino
Geographical mobility - Moved from different state (%) - American Indian and Alaska Native
Geographical mobility - Moved from different state (%) - Multirace
Geographical mobility - Moved from different state (%) - Other Race
Geographical mobility - Moved from abroad (%)
Geographical mobility - Moved from abroad (%) - White
Geographical mobility - Moved from abroad (%) - Black or African American
Geographical mobility - Moved from abroad (%) - Asian
Geographical mobility - Moved from abroad (%) - Hispanic or Latino
Geographical mobility - Moved from abroad (%) - American Indian and Alaska Native
Geographical mobility - Moved from abroad (%) - Multirace
Geographical mobility - Moved from abroad (%) - Other Race
Place of birth for the foreign-born population - Ireland (%)
Place of birth for the foreign-born population - Denmark (%)
Place of birth for the foreign-born population - Norway (%)
Place of birth for the foreign-born population - Sweden (%)
Place of birth for the foreign-born population - United Kingdom (%)
Place of birth for the foreign-born population - England (%)
Place of birth for the foreign-born population - Scotland (%)
Place of birth for the foreign-born population - Other Northern Europe (%)
Place of birth for the foreign-born population - Austria (%)
Place of birth for the foreign-born population - Belgium (%)
Place of birth for the foreign-born population - France (%)
Place of birth for the foreign-born population - Germany (%)
Place of birth for the foreign-born population - Netherlands (%)
Place of birth for the foreign-born population - Switzerland (%)
Place of birth for the foreign-born population - Other Western Europe (%)
Place of birth for the foreign-born population - Greece (%)
Place of birth for the foreign-born population - Italy (%)
Place of birth for the foreign-born population - Portugal (%)
Place of birth for the foreign-born population - Spain (%)
Place of birth for the foreign-born population - Other Southern Europe (%)
Place of birth for the foreign-born population - Albania (%)
Place of birth for the foreign-born population - Belarus (%)
Place of birth for the foreign-born population - Bosnia and Herzegovina (%)
Place of birth for the foreign-born population - Bulgaria (%)
Place of birth for the foreign-born population - Croatia (%)
Place of birth for the foreign-born population - Czechoslovakia (%)
Place of birth for the foreign-born population - Hungary (%)
Place of birth for the foreign-born population - Latvia (%)
Place of birth for the foreign-born population - Lithuania (%)
Place of birth for the foreign-born population - North Macedonia (Macedonia) (%)
Place of birth for the foreign-born population - Moldova (%)
Place of birth for the foreign-born population - Poland (%)
Place of birth for the foreign-born population - Romania (%)
Place of birth for the foreign-born population - Russia (%)
Place of birth for the foreign-born population - Serbia (%)
Place of birth for the foreign-born population - Ukraine (%)
Place of birth for the foreign-born population - Other Eastern Europe (%)
Place of birth for the foreign-born population - China (%)
Place of birth for the foreign-born population - Hong Kong (%)
Place of birth for the foreign-born population - Taiwan (%)
Place of birth for the foreign-born population - Japan (%)
Place of birth for the foreign-born population - Korea (%)
Place of birth for the foreign-born population - Other Eastern Asia (%)
Place of birth for the foreign-born population - Afghanistan (%)
Place of birth for the foreign-born population - Bangladesh (%)
Place of birth for the foreign-born population - India (%)
Place of birth for the foreign-born population - Iran (%)
Place of birth for the foreign-born population - Kazakhstan (%)
Place of birth for the foreign-born population - Nepal (%)
Place of birth for the foreign-born population - Pakistan (%)
Place of birth for the foreign-born population - Sri Lanka (%)
Place of birth for the foreign-born population - Uzbekistan (%)
Place of birth for the foreign-born population - Other South Central Asia (%)
Place of birth for the foreign-born population - Burma (%)
Place of birth for the foreign-born population - Cambodia (%)
Place of birth for the foreign-born population - Indonesia (%)
Place of birth for the foreign-born population - Laos (%)
Place of birth for the foreign-born population - Malaysia (%)
Place of birth for the foreign-born population - Philippines (%)
Place of birth for the foreign-born population - Singapore (%)
Place of birth for the foreign-born population - Thailand (%)
Place of birth for the foreign-born population - Vietnam (%)
Place of birth for the foreign-born population - Other South Eastern Asia (%)
Place of birth for the foreign-born population - Armenia (%)
Place of birth for the foreign-born population - Iraq (%)
Place of birth for the foreign-born population - Israel (%)
Place of birth for the foreign-born population - Jordan (%)
Place of birth for the foreign-born population - Kuwait (%)
Place of birth for the foreign-born population - Lebanon (%)
Place of birth for the foreign-born population - Saudi Arabia (%)
Place of birth for the foreign-born population - Syria (%)
Place of birth for the foreign-born population - Turkey (%)
Place of birth for the foreign-born population - Yemen (%)
Place of birth for the foreign-born population - Other Western Asia (%)
Place of birth for the foreign-born population - Eritrea (%)
Place of birth for the foreign-born population - Ethiopia (%)
Place of birth for the foreign-born population - Kenya (%)
Place of birth for the foreign-born population - Somalia (%)
Place of birth for the foreign-born population - Uganda (%)
Place of birth for the foreign-born population - Zimbabwe (%)
Place of birth for the foreign-born population - Other Eastern Africa (%)
Place of birth for the foreign-born population - Cameroon (%)
Place of birth for the foreign-born population - Congo (%)
Place of birth for the foreign-born population - Democratic Republic of Congo (Zaire) (%)
Place of birth for the foreign-born population - Other Middle Africa (%)
Place of birth for the foreign-born population - Egypt (%)
Place of birth for the foreign-born population - Morocco (%)
Place of birth for the foreign-born population - Sudan (%)
Place of birth for the foreign-born population - Other Northern Africa (%)
Place of birth for the foreign-born population - South Africa (%)
Place of birth for the foreign-born population - Other Southern Africa (%)
Place of birth for the foreign-born population - Cabo Verde (%)
Place of birth for the foreign-born population - Ghana (%)
Place of birth for the foreign-born population - Liberia (%)
Place of birth for the foreign-born population - Nigeria (%)
Place of birth for the foreign-born population - Senegal (%)
Place of birth for the foreign-born population - Sierra Leone (%)
Place of birth for the foreign-born population - Other Western Africa (%)
Place of birth for the foreign-born population - Australia (%)
Place of birth for the foreign-born population - New Zealand (%)
Place of birth for the foreign-born population - Fiji (%)
Place of birth for the foreign-born population - Micronesia (%)
Place of birth for the foreign-born population - Bahamas (%)
Place of birth for the foreign-born population - Barbados (%)
Place of birth for the foreign-born population - Cuba (%)
Place of birth for the foreign-born population - Dominica (%)
Place of birth for the foreign-born population - Dominican Republic (%)
Place of birth for the foreign-born population - Grenada (%)
Place of birth for the foreign-born population - Haiti (%)
Place of birth for the foreign-born population - Jamaica (%)
Place of birth for the foreign-born population - St. Vincent and the Grenadines (%)
Place of birth for the foreign-born population - Trinidad and Tobago (%)
Place of birth for the foreign-born population - West Indies (%)
Place of birth for the foreign-born population - Other Caribbean (%)
Place of birth for the foreign-born population - Belize (%)
Place of birth for the foreign-born population - Costa Rica (%)
Place of birth for the foreign-born population - El Salvador (%)
Place of birth for the foreign-born population - Guatemala (%)
Place of birth for the foreign-born population - Honduras (%)
Place of birth for the foreign-born population - Mexico (%)
Place of birth for the foreign-born population - Nicaragua (%)
Place of birth for the foreign-born population - Panama (%)
Place of birth for the foreign-born population - Other Central America (%)
Place of birth for the foreign-born population - Argentina (%)
Place of birth for the foreign-born population - Bolivia (%)
Place of birth for the foreign-born population - Brazil (%)
Place of birth for the foreign-born population - Chile (%)
Place of birth for the foreign-born population - Colombia (%)
Place of birth for the foreign-born population - Ecuador (%)
Place of birth for the foreign-born population - Guyana (%)
Place of birth for the foreign-born population - Peru (%)
Place of birth for the foreign-born population - Uruguay (%)
Place of birth for the foreign-born population - Venezuela (%)
Place of birth for the foreign-born population - Other South America (%)
Place of birth for the foreign-born population - Canada (%)
Place of birth for the foreign-born population - Other Northern America (%)
Place of birth for the foreign-born population - Other (%)
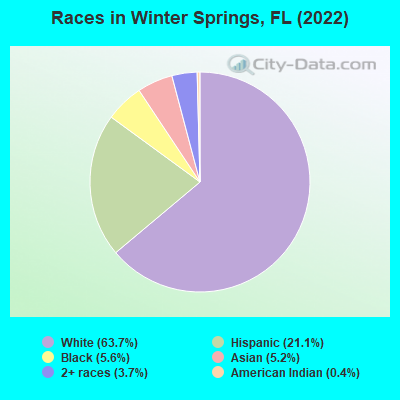
According to 2022 data, the most numerous races in Winter Springs, FL are White alone (24,711 residents), Hispanic (8,189 residents), and Black alone (2,191 residents). 78.2% of Winter Springs residents speak English at home. 11.5% of Winter Springs, FL residents are foreign-born (4.2% born in Latin America, 3.8% born in Asia, 2.0% born in Europe), which is 82.4% less than the foreign-born rate of 21.0% across the entire state of Florida.
Race distribution in Winter Springs
2000 2022
10,458,509 65.4% White alone 2,682,715 16.8% Hispanic 2,264,268 14.2% Black alone 261,693 1.6% Asian alone 236,954 1.5% Two or more races 42,358 0.3% American Indian alone 28,994 0.2% Other race alone 6,887 0.04% Native Hawaiian and Other
11,309,403 50.8% White alone 6,025,039 27.1% Hispanic 3,241,015 14.6% Black alone 861,630 3.9% Two or more races 623,692 2.8% Asian alone 152,054 0.7% Other race alone 22,504 0.1% American Indian alone 9,486 0.04% Native Hawaiian and Other
Income and house value in Winter Springs Median household income in 2022 $84,745 White non-Hispanic householders$85,094 Black householders$53,874 Asian householders$123,831 Some other race householders$82,967 Two or more races householders$96,321 Hispanic or Latino race householdersMedian 2022 house value $396,189 White Non-Hispanic householders$341,512 Black or African American householders$263,827 American Indian or Alaska Native householders $455,648 Asian householders$368,402 Some other race householders$290,718 Two or more races householders$339,121 Hispanic or Latino householders
Median age by race in Winter Springs
48.2 Median age for White residents46.4 51.4 32.1 Median age for Black or African American residents33.0 30.9 10.0 Median age for American Indian / Alaska Native residents-541,955,349.7 9.2 45.5 Median age for Asian residents45.6 44.6 -679,849,340.2 Median age for Native Hawaiian / Pacific Islander residents-858,307,848.3 -443,298,968.6 35.3 Median age for Other race residents35.1 34.8 32.8 Median age for Two or more races residents29.6 35.0 48.9 Median age for White alone residents47.5 51.7 33.3 Median age for Hispanic or Latino residents29.9 36.1
Owner/renter occupied households by race in Winter Springs
House owners and renters - White residents 9,579 78.7% Owner occupied2,588 21.3% Renter occupiedHouse owners and renters - Black or African American residents 379 38.4% Owner occupied609 61.6% Renter occupiedHouse owners and renters - American Indian / Alaska Native residents 51 100.0% Renter occupiedHouse owners and renters - Asian residents 451 60.7% Owner occupied292 39.3% Renter occupiedHouse owners and renters - Other race residents 232 44.9% Owner occupied284 55.1% Renter occupiedHouse owners and renters - Two or more races residents 1,053 68.5% Owner occupied484 31.5% Renter occupiedHouse owners and renters - White alone residents 8,711 77.8% Owner occupied2,483 22.2% Renter occupiedHouse owners and renters - Hispanic or Latino residents 2,192 67.9% Owner occupied1,034 32.1% Renter occupied
Language usage in Winter Springs
English speakers - Total 78.2% of residents of Winter Springs speak English at home.
12.2% of residents speak Spanish at home 3,400 74.3% Speak English very well1,173 25.7% Speak English less than very well9.8% of residents speak other language at home 2,305 62.9% Speak English very well1,360 37.1% Speak English less than very well
English speakers - Born in the United States 91.3% of residents of Winter Springs speak English at home.
5.8% of residents speak Spanish at home 960 88.9% Speak English very well120 11.1% Speak English less than very well3.3% of residents speak other language at home 425 69.8% Speak English very well184 30.2% Speak English less than very well
English speakers - Native, born elsewhere 37.8% of residents of Winter Springs speak English at home.
59.5% of residents speak Spanish at home 1,016 70.6% Speak English very well424 29.4% Speak English less than very well1.2% of residents speak other language at home 29 100.0% Speak English very well
English speakers - Foreign-born 20.7% of residents of Winter Springs speak English at home.
25.1% of residents speak Spanish at home 774 67.2% Speak English very well377 32.8% Speak English less than very well56.9% of residents speak other language at home 1,466 56.2% Speak English very well1,144 43.8% Speak English less than very well
White (Caucasian) - Speak only English Native:
94.5% (22,971)Foreign-born:
30.9% (368)
White (Caucasian) - Speak another language Native:
5.3% (1,279)Foreign-born:
67.8% (807)
Black or African American - Speak only English Native:
92.9% (1,725)Foreign-born:
32.5% (151)
Black or African American - Speak another language Native:
7.0% (131)Foreign-born:
75.5% (350)
Asian - Speak only English Native:
71.4% (533)Foreign-born:
12.8% (177)
Asian - Speak another language Native:
27.4% (205)Foreign-born:
88.3% (1,226)
Other race - Speak only English Native:
26.8% (362)Foreign-born:
24.2% (40)
Other race - Speak another language Native:
70.2% (949)Foreign-born:
95.1% (158)
Two or more races - Speak only English Native:
66.9% (2,535)Foreign-born:
11.3% (166)
Two or more races - Speak another language Native:
32.7% (1,240)Foreign-born:
87.6% (1,294)
White alone - Speak only English Native:
96.7% (21,881)Foreign-born:
29.3% (382)
White alone - Speak another language Native:
3.3% (747)Foreign-born:
71.2% (929)
Hispanic or Latino - Speak only English Native:
53.6% (3,436)Foreign-born:
6.6% (79)
Hispanic or Latino - Speak another language Native:
47.2% (3,024)Foreign-born:
92.9% (1,115)
Foreign-born residents in Winter Springs 4,469 residents are foreign born (4.2% Latin America , 3.8% Asia , 2.0% Europe ).
This city:
11.5%Florida:
21.1%
Marital status for residents in Winter Springs Marital status - White (Caucasian) population 15 years and over
Males 29.6% Never married55.4% Now married0.7% Separated2.0% Widowed12.4% DivorcedFemales 20.6% Never married51.5% Now married1.5% Separated9.8% Widowed16.6% DivorcedWomen who gave birth in the past 12 months Now married:
68.6% (98)Unmarried:
31.4% (45)
Women who did not give birth in the past 12 months Now married:
43.4% (2,000)Unmarried:
56.6% (2,605)
Marital status - Black or African American population 15 years and over
Males 36.4% Never married53.3% Now married0.0% Separated0.0% Widowed10.3% DivorcedFemales 34.5% Never married24.8% Now married3.5% Separated16.3% Widowed21.0% DivorcedWomen who did not give birth in the past 12 months Now married:
26.2% (135)Unmarried:
73.8% (381)
Marital status - American Indian / Alaska Native population 15 years and over
Males 0.0% Never married100.0% Now married0.0% Separated0.0% Widowed0.0% DivorcedFemales 0.0% Never married100.0% Now married0.0% Separated0.0% Widowed0.0% DivorcedMarital status - Asian population 15 years and over
Males 34.4% Never married58.7% Now married0.0% Separated0.0% Widowed6.8% DivorcedFemales 9.1% Never married72.4% Now married0.0% Separated5.6% Widowed12.9% DivorcedWomen who gave birth in the past 12 months Now married:
93.5% (32)Unmarried:
6.5% (2)
Women who did not give birth in the past 12 months Now married:
65.7% (249)Unmarried:
34.3% (130)
Marital status - Other race population 15 years and over
Males 32.8% Never married45.6% Now married0.0% Separated3.6% Widowed18.0% DivorcedFemales 23.3% Never married49.9% Now married3.5% Separated6.3% Widowed17.0% DivorcedWomen who gave birth in the past 12 months Now married:
0.0% (0)Unmarried:
100.0% (16)
Women who did not give birth in the past 12 months Now married:
67.9% (253)Unmarried:
32.1% (120)
Marital status - Two or more races population 15 years and over
Males 31.8% Never married61.4% Now married1.0% Separated0.0% Widowed5.8% DivorcedFemales 23.8% Never married60.0% Now married0.0% Separated3.2% Widowed13.0% DivorcedWomen who gave birth in the past 12 months Now married:
100.0% (33)Unmarried:
0.0% (0)
Women who did not give birth in the past 12 months Now married:
56.3% (641)Unmarried:
43.7% (498)
Marital status - White alone, not Hispanic / Latino population 15 years and over
Males 24.9% Never married60.3% Now married0.3% Separated1.6% Widowed12.9% DivorcedFemales 19.7% Never married53.4% Now married1.2% Separated9.5% Widowed16.2% DivorcedWomen who gave birth in the past 12 months Now married:
64.3% (87)Unmarried:
35.7% (49)
Women who did not give birth in the past 12 months Now married:
46.3% (1,967)Unmarried:
53.7% (2,277)
Marital status - Hispanic or Latino population 15 years and over
Males 46.6% Never married38.2% Now married1.5% Separated3.2% Widowed10.5% DivorcedFemales 25.1% Never married46.5% Now married2.9% Separated7.8% Widowed17.8% DivorcedWomen who gave birth in the past 12 months Now married:
66.7% (41)Unmarried:
33.3% (21)
Women who did not give birth in the past 12 months Now married:
45.9% (826)Unmarried:
54.1% (974)
Ancestries in Winter Springs
1,779 9.4% American1,613 8.5% English1,102 5.8% German1,081 5.7% Irish1,022 5.4% Italian584 3.1% European375 2.0% Polish339 1.8% Scottish328 1.7% French278 1.5% Swedish269 1.4% Jamaican243 1.3% Scotch-Irish219 1.2% Egyptian205 1.1% Haitian204 1.1% British183 1.0% Russian147 0.8% Lebanese143 0.8% Dutch119 0.6% Eastern European94 0.5% French Canadian88 0.5% African81 0.4% Canadian80 0.4% Barbadian62 0.3% Greek61 0.3% Brazilian59 0.3% Iranian54 0.3% Hungarian40 0.2% Slovene34 0.2% Norwegian31 0.2% Celtic27 0.1% Czechoslovakian25 0.1% Lithuanian25 0.1% Arab24 0.1% Bulgarian20 0.1% Slavic19 0.1% Finnish17 0.09% Slovak16 0.08% Portuguese16 0.08% Cajun15 0.08% Palestinian15 0.08% Guyanese13 0.07% Austrian13 0.07% Welsh10 0.05% Scandinavian8 0.04% Pennsylvania German
Geographical mobility in Winter Springs Same house 1 year ago 23,590 90.6% White (Caucasian)2,337 93.0% Black or African American217 100.0% American Indian / Alaska Native1,986 90.9% Asian1,016 69.1% Other race5,065 93.9% Two or more races22,285 90.6% White alone, not Hispanic / Latino6,898 85.7% Hispanic or LatinoMoved within same county 922 3.5% White / Caucasian23 0.9% Black or African American32 2.2% Other race115 2.1% Two or more races928 3.8% White alone, not Hispanic / Latino171 2.1% Hispanic or LatinoMoved within same state 883 3.4% White / Caucasian69 2.7% Black or African American75 3.4% Asian241 16.4% Other race112 2.1% Two or more races680 2.8% White alone, not Hispanic / Latino653 8.1% Hispanic or LatinoMoved from different state 545 2.1% White / Caucasian141 5.6% Black or African American50 2.3% Asian66 4.5% Other race23 0.4% Two or more races584 2.4% White alone, not Hispanic / Latino52 0.6% Hispanic or LatinoMoved from abroad 137 0.5% White269 18.3% Other race120 0.5% White alone, not Hispanic / Latino125 1.5% Hispanic or Latino
Children Nativity (place of birth) in Winter Springs
Children under 6 years - Living with two parents Both parents native 755 100.0% NativeBoth parents foreign-born 175 100.0% NativeOne native, one foreign-born parent 280 100.0% NativeChildren under 6 years - Living with one parent Native parent 465 91.1% Native45 8.9% Foreign-bornForeign-born parent 43 100.0% NativeChildren 6 to 17 years - Living with two parents Both parents native 2,477 100.0% NativeBoth parents foreign-born 516 89.9% Native58 10.1% Foreign-bornOne native, one foreign-born parent 324 100.0% NativeChildren 6 to 17 years - Living with one parent Native parent 1,117 100.0% NativeForeign-born parent 250 61.3% Native158 38.7% Foreign-born
Grandparents responsible for own grandchildren in Winter Springs
Grandparents (30 to 59 years) White / Caucasian 27 40.1% Responsible for grandchildren40 59.9% Not responsible for grandchildrenBlack or African American 21 33.8% Responsible for grandchildren41 66.2% Not responsible for grandchildrenAsian 6 100.0% Responsible for grandchildrenTwo or more races 78 100.0% Not responsible for grandchildrenWhite alone, not Hispanic / Latino 33 40.3% Responsible for grandchildren49 59.7% Not responsible for grandchildrenHispanic or Latino 45 100.0% Not responsible for grandchildrenGrandparents (60 years and over) White / Caucasian 43 10.8% Responsible for grandchildren351 89.2% Not responsible for grandchildrenBlack or African American 48 74.5% Responsible for grandchildren16 25.5% Not responsible for grandchildrenAsian 28 100.0% Responsible for grandchildrenWhite alone, not Hispanic / Latino 46 11.0% Responsible for grandchildren368 89.0% Not responsible for grandchildrenHispanic or Latino 42 100.0% Not responsible for grandchildren