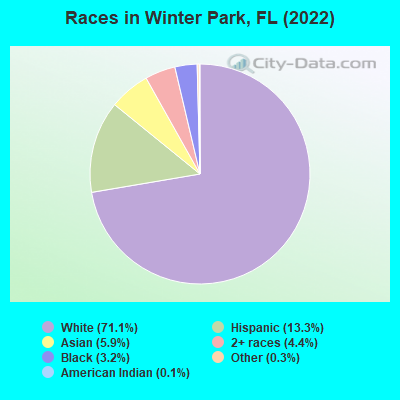
Races in Winter Park, Florida (FL) Detailed Stats
Data:
Races - White alone (%)
Races - White alone (% change since 2000)
Races - Black alone (%)
Races - Black alone (% change since 2000)
Races - American Indian alone (%)
Races - American Indian alone (% change since 2000)
Races - Asian alone (%)
Races - Asian alone (% change since 2000)
Races - Hispanic (%)
Races - Hispanic (% change since 2000)
Races - Native Hawaiian and Other Pacific Islander alone (%)
Races - Native Hawaiian and Other Pacific Islander alone (% change since 2000)
Races - Two or more races(%)
Races - Two or more races(% change since 2000)
Races - Other race alone (%)
Races - Other race alone (% change since 2000)
Racial diversity
Place of birth - Born in state of residence (%)
Place of birth - Born in state of residence (%) - White
Place of birth - Born in state of residence (%) - Black or African American
Place of birth - Born in state of residence (%) - Asian
Place of birth - Born in state of residence (%) - Hispanic or Latino
Place of birth - Born in state of residence (%) - American Indian and Alaska Native
Place of birth - Born in state of residence (%) - Multirace
Place of birth - Born in state of residence (%) - Other Race
Place of birth - Born in other state (%)
Place of birth - Born in other state (%) - White
Place of birth - Born in other state (%) - Black or African American
Place of birth - Born in other state (%) - Asian
Place of birth - Born in other state (%) - Hispanic or Latino
Place of birth - Born in other state (%) - American Indian and Alaska Native
Place of birth - Born in other state (%) - Multirace
Place of birth - Born in other state (%) - Other Race
Place of birth - Native, outside of US (%)
Place of birth - Native, outside of US (%) - White
Place of birth - Native, outside of US (%) - Black or African American
Place of birth - Native, outside of US (%) - Asian
Place of birth - Native, outside of US (%) - Hispanic or Latino
Place of birth - Native, outside of US (%) - American Indian and Alaska Native
Place of birth - Native, outside of US (%) - Multirace
Place of birth - Native, outside of US (%) - Other Race
Place of birth - Foreign born (%)
Place of birth - Foreign born (%) - White
Place of birth - Foreign born (%) - Black or African American
Place of birth - Foreign born (%) - Asian
Place of birth - Foreign born (%) - Hispanic or Latino
Place of birth - Foreign born (%) - American Indian and Alaska Native
Place of birth - Foreign born (%) - Multirace
Place of birth - Foreign born (%) - Other Race
Residents speaking English at home (%)
Residents speaking English at home - Born in the United States (%)
Residents speaking English at home - Native, born elsewhere (%)
Residents speaking English at home - Foreign born (%)
Residents speaking Spanish at home (%)
Residents speaking Spanish at home - Born in the United States (%)
Residents speaking Spanish at home - Native, born elsewhere (%)
Residents speaking Spanish at home - Foreign born (%)
Residents speaking other language at home (%)
Residents speaking other language at home - Born in the United States (%)
Residents speaking other language at home - Native, born elsewhere (%)
Residents speaking other language at home - Foreign born (%)
Marital status - Never married (%)
Marital status - Now married (%)
Marital status - Separated (%)
Marital status - Widowed (%)
Marital status - Divorced (%)
Ancestries Reported - Arab (%)
Ancestries Reported - Czech (%)
Ancestries Reported - Danish (%)
Ancestries Reported - Dutch (%)
Ancestries Reported - English (%)
Ancestries Reported - French (%)
Ancestries Reported - French Canadian (%)
Ancestries Reported - German (%)
Ancestries Reported - Greek (%)
Ancestries Reported - Hungarian (%)
Ancestries Reported - Irish (%)
Ancestries Reported - Italian (%)
Ancestries Reported - Lithuanian (%)
Ancestries Reported - Norwegian (%)
Ancestries Reported - Polish (%)
Ancestries Reported - Portuguese (%)
Ancestries Reported - Russian (%)
Ancestries Reported - Scotch-Irish (%)
Ancestries Reported - Scottish (%)
Ancestries Reported - Slovak (%)
Ancestries Reported - Subsaharan African (%)
Ancestries Reported - Swedish (%)
Ancestries Reported - Swiss (%)
Ancestries Reported - Ukrainian (%)
Ancestries Reported - United States (%)
Ancestries Reported - Welsh (%)
Ancestries Reported - West Indian (%)
Ancestries Reported - Other (%)
Geographical mobility - Same house 1 year ago (%)
Geographical mobility - Same house 1 year ago (%) - White
Geographical mobility - Same house 1 year ago (%) - Black or African American
Geographical mobility - Same house 1 year ago (%) - Asian
Geographical mobility - Same house 1 year ago (%) - Hispanic or Latino
Geographical mobility - Same house 1 year ago (%) - American Indian and Alaska Native
Geographical mobility - Same house 1 year ago (%) - Multirace
Geographical mobility - Same house 1 year ago (%) - Other Race
Geographical mobility - Moved within same county (%)
Geographical mobility - Moved within same county (%) - White
Geographical mobility - Moved within same county (%) - Black or African American
Geographical mobility - Moved within same county (%) - Asian
Geographical mobility - Moved within same county (%) - Hispanic or Latino
Geographical mobility - Moved within same county (%) - American Indian and Alaska Native
Geographical mobility - Moved within same county (%) - Multirace
Geographical mobility - Moved within same county (%) - Other Race
Geographical mobility - Moved from different county within same state (%)
Geographical mobility - Moved from different county within same state (%) - White
Geographical mobility - Moved from different county within same state (%) - Black or African American
Geographical mobility - Moved from different county within same state (%) - Asian
Geographical mobility - Moved from different county within same state (%) - Hispanic or Latino
Geographical mobility - Moved from different county within same state (%) - American Indian and Alaska Native
Geographical mobility - Moved from different county within same state (%) - Multirace
Geographical mobility - Moved from different county within same state (%) - Other Race
Geographical mobility - Moved from different state (%)
Geographical mobility - Moved from different state (%) - White
Geographical mobility - Moved from different state (%) - Black or African American
Geographical mobility - Moved from different state (%) - Asian
Geographical mobility - Moved from different state (%) - Hispanic or Latino
Geographical mobility - Moved from different state (%) - American Indian and Alaska Native
Geographical mobility - Moved from different state (%) - Multirace
Geographical mobility - Moved from different state (%) - Other Race
Geographical mobility - Moved from abroad (%)
Geographical mobility - Moved from abroad (%) - White
Geographical mobility - Moved from abroad (%) - Black or African American
Geographical mobility - Moved from abroad (%) - Asian
Geographical mobility - Moved from abroad (%) - Hispanic or Latino
Geographical mobility - Moved from abroad (%) - American Indian and Alaska Native
Geographical mobility - Moved from abroad (%) - Multirace
Geographical mobility - Moved from abroad (%) - Other Race
Place of birth for the foreign-born population - Ireland (%)
Place of birth for the foreign-born population - Denmark (%)
Place of birth for the foreign-born population - Norway (%)
Place of birth for the foreign-born population - Sweden (%)
Place of birth for the foreign-born population - United Kingdom (%)
Place of birth for the foreign-born population - England (%)
Place of birth for the foreign-born population - Scotland (%)
Place of birth for the foreign-born population - Other Northern Europe (%)
Place of birth for the foreign-born population - Austria (%)
Place of birth for the foreign-born population - Belgium (%)
Place of birth for the foreign-born population - France (%)
Place of birth for the foreign-born population - Germany (%)
Place of birth for the foreign-born population - Netherlands (%)
Place of birth for the foreign-born population - Switzerland (%)
Place of birth for the foreign-born population - Other Western Europe (%)
Place of birth for the foreign-born population - Greece (%)
Place of birth for the foreign-born population - Italy (%)
Place of birth for the foreign-born population - Portugal (%)
Place of birth for the foreign-born population - Spain (%)
Place of birth for the foreign-born population - Other Southern Europe (%)
Place of birth for the foreign-born population - Albania (%)
Place of birth for the foreign-born population - Belarus (%)
Place of birth for the foreign-born population - Bosnia and Herzegovina (%)
Place of birth for the foreign-born population - Bulgaria (%)
Place of birth for the foreign-born population - Croatia (%)
Place of birth for the foreign-born population - Czechoslovakia (%)
Place of birth for the foreign-born population - Hungary (%)
Place of birth for the foreign-born population - Latvia (%)
Place of birth for the foreign-born population - Lithuania (%)
Place of birth for the foreign-born population - North Macedonia (Macedonia) (%)
Place of birth for the foreign-born population - Moldova (%)
Place of birth for the foreign-born population - Poland (%)
Place of birth for the foreign-born population - Romania (%)
Place of birth for the foreign-born population - Russia (%)
Place of birth for the foreign-born population - Serbia (%)
Place of birth for the foreign-born population - Ukraine (%)
Place of birth for the foreign-born population - Other Eastern Europe (%)
Place of birth for the foreign-born population - China (%)
Place of birth for the foreign-born population - Hong Kong (%)
Place of birth for the foreign-born population - Taiwan (%)
Place of birth for the foreign-born population - Japan (%)
Place of birth for the foreign-born population - Korea (%)
Place of birth for the foreign-born population - Other Eastern Asia (%)
Place of birth for the foreign-born population - Afghanistan (%)
Place of birth for the foreign-born population - Bangladesh (%)
Place of birth for the foreign-born population - India (%)
Place of birth for the foreign-born population - Iran (%)
Place of birth for the foreign-born population - Kazakhstan (%)
Place of birth for the foreign-born population - Nepal (%)
Place of birth for the foreign-born population - Pakistan (%)
Place of birth for the foreign-born population - Sri Lanka (%)
Place of birth for the foreign-born population - Uzbekistan (%)
Place of birth for the foreign-born population - Other South Central Asia (%)
Place of birth for the foreign-born population - Burma (%)
Place of birth for the foreign-born population - Cambodia (%)
Place of birth for the foreign-born population - Indonesia (%)
Place of birth for the foreign-born population - Laos (%)
Place of birth for the foreign-born population - Malaysia (%)
Place of birth for the foreign-born population - Philippines (%)
Place of birth for the foreign-born population - Singapore (%)
Place of birth for the foreign-born population - Thailand (%)
Place of birth for the foreign-born population - Vietnam (%)
Place of birth for the foreign-born population - Other South Eastern Asia (%)
Place of birth for the foreign-born population - Armenia (%)
Place of birth for the foreign-born population - Iraq (%)
Place of birth for the foreign-born population - Israel (%)
Place of birth for the foreign-born population - Jordan (%)
Place of birth for the foreign-born population - Kuwait (%)
Place of birth for the foreign-born population - Lebanon (%)
Place of birth for the foreign-born population - Saudi Arabia (%)
Place of birth for the foreign-born population - Syria (%)
Place of birth for the foreign-born population - Turkey (%)
Place of birth for the foreign-born population - Yemen (%)
Place of birth for the foreign-born population - Other Western Asia (%)
Place of birth for the foreign-born population - Eritrea (%)
Place of birth for the foreign-born population - Ethiopia (%)
Place of birth for the foreign-born population - Kenya (%)
Place of birth for the foreign-born population - Somalia (%)
Place of birth for the foreign-born population - Uganda (%)
Place of birth for the foreign-born population - Zimbabwe (%)
Place of birth for the foreign-born population - Other Eastern Africa (%)
Place of birth for the foreign-born population - Cameroon (%)
Place of birth for the foreign-born population - Congo (%)
Place of birth for the foreign-born population - Democratic Republic of Congo (Zaire) (%)
Place of birth for the foreign-born population - Other Middle Africa (%)
Place of birth for the foreign-born population - Egypt (%)
Place of birth for the foreign-born population - Morocco (%)
Place of birth for the foreign-born population - Sudan (%)
Place of birth for the foreign-born population - Other Northern Africa (%)
Place of birth for the foreign-born population - South Africa (%)
Place of birth for the foreign-born population - Other Southern Africa (%)
Place of birth for the foreign-born population - Cabo Verde (%)
Place of birth for the foreign-born population - Ghana (%)
Place of birth for the foreign-born population - Liberia (%)
Place of birth for the foreign-born population - Nigeria (%)
Place of birth for the foreign-born population - Senegal (%)
Place of birth for the foreign-born population - Sierra Leone (%)
Place of birth for the foreign-born population - Other Western Africa (%)
Place of birth for the foreign-born population - Australia (%)
Place of birth for the foreign-born population - New Zealand (%)
Place of birth for the foreign-born population - Fiji (%)
Place of birth for the foreign-born population - Micronesia (%)
Place of birth for the foreign-born population - Bahamas (%)
Place of birth for the foreign-born population - Barbados (%)
Place of birth for the foreign-born population - Cuba (%)
Place of birth for the foreign-born population - Dominica (%)
Place of birth for the foreign-born population - Dominican Republic (%)
Place of birth for the foreign-born population - Grenada (%)
Place of birth for the foreign-born population - Haiti (%)
Place of birth for the foreign-born population - Jamaica (%)
Place of birth for the foreign-born population - St. Vincent and the Grenadines (%)
Place of birth for the foreign-born population - Trinidad and Tobago (%)
Place of birth for the foreign-born population - West Indies (%)
Place of birth for the foreign-born population - Other Caribbean (%)
Place of birth for the foreign-born population - Belize (%)
Place of birth for the foreign-born population - Costa Rica (%)
Place of birth for the foreign-born population - El Salvador (%)
Place of birth for the foreign-born population - Guatemala (%)
Place of birth for the foreign-born population - Honduras (%)
Place of birth for the foreign-born population - Mexico (%)
Place of birth for the foreign-born population - Nicaragua (%)
Place of birth for the foreign-born population - Panama (%)
Place of birth for the foreign-born population - Other Central America (%)
Place of birth for the foreign-born population - Argentina (%)
Place of birth for the foreign-born population - Bolivia (%)
Place of birth for the foreign-born population - Brazil (%)
Place of birth for the foreign-born population - Chile (%)
Place of birth for the foreign-born population - Colombia (%)
Place of birth for the foreign-born population - Ecuador (%)
Place of birth for the foreign-born population - Guyana (%)
Place of birth for the foreign-born population - Peru (%)
Place of birth for the foreign-born population - Uruguay (%)
Place of birth for the foreign-born population - Venezuela (%)
Place of birth for the foreign-born population - Other South America (%)
Place of birth for the foreign-born population - Canada (%)
Place of birth for the foreign-born population - Other Northern America (%)
Place of birth for the foreign-born population - Other (%)
According to 2022 data, the most numerous races in Winter Park, FL are White alone (21,710 residents), Hispanic (4,047 residents), and Black alone (991 residents). 82.8% of Winter Park residents speak English at home. 12.2% of Winter Park, FL residents are foreign-born (3.7% born in Latin America, 3.2% born in Europe, 3.0% born in Asia, 1.2% born in Africa), which is 72.6% less than the foreign-born rate of 21.0% across the entire state of Florida.
Race distribution in Winter Park
2000 2022
10,458,509 65.4% White alone 2,682,715 16.8% Hispanic 2,264,268 14.2% Black alone 261,693 1.6% Asian alone 236,954 1.5% Two or more races 42,358 0.3% American Indian alone 28,994 0.2% Other race alone 6,887 0.04% Native Hawaiian and Other
11,309,403 50.8% White alone 6,025,039 27.1% Hispanic 3,241,015 14.6% Black alone 861,630 3.9% Two or more races 623,692 2.8% Asian alone 152,054 0.7% Other race alone 22,504 0.1% American Indian alone 9,486 0.04% Native Hawaiian and Other
Income and house value in Winter Park Median household income in 2022 $106,759 White non-Hispanic householders$54,732 Black householders$99,808 Asian householders$91,608 Two or more races householders$87,788 Hispanic or Latino race householdersMedian 2022 house value $807,622 White Non-Hispanic householders$245,987 Black or African American householders$351,928 American Indian or Alaska Native householders $567,077 Asian householders$427,756 Some other race householders$344,672 Two or more races householders$522,813 Hispanic or Latino householders
Median age by race in Winter Park
47.7 Median age for White residents47.0 48.2 53.2 Median age for Black or African American residents46.6 58.0 49.7 Median age for American Indian / Alaska Native residents-735,632,183.2 -529,680,364.8 37.1 Median age for Asian residents42.4 35.6 -679,790,025.6 Median age for Native Hawaiian / Pacific Islander residents-1,327,635,326.3 -611,111,110.5 42.2 Median age for Other race residents39.4 42.3 36.4 Median age for Two or more races residents25.6 46.4 47.9 Median age for White alone residents46.3 49.5 39.9 Median age for Hispanic or Latino residents27.5 43.8
Owner/renter occupied households by race in Winter Park
House owners and renters - White residents 6,696 69.2% Owner occupied2,977 30.8% Renter occupiedHouse owners and renters - Black or African American residents 323 53.2% Owner occupied284 46.8% Renter occupiedHouse owners and renters - American Indian / Alaska Native residents 56 100.0% Renter occupiedHouse owners and renters - Asian residents 327 65.6% Owner occupied172 34.4% Renter occupiedHouse owners and renters - Other race residents 72 34.3% Owner occupied137 65.7% Renter occupiedHouse owners and renters - Two or more races residents 948 57.2% Owner occupied710 42.8% Renter occupiedHouse owners and renters - White alone residents 7,097 68.9% Owner occupied3,206 31.1% Renter occupiedHouse owners and renters - Hispanic or Latino residents 875 55.5% Owner occupied701 44.5% Renter occupied
Language usage in Winter Park
English speakers - Total 82.8% of residents of Winter Park speak English at home.
8.7% of residents speak Spanish at home 1,997 77.9% Speak English very well566 22.1% Speak English less than very well8.6% of residents speak other language at home 1,977 78.3% Speak English very well547 21.7% Speak English less than very well
English speakers - Born in the United States 94.5% of residents of Winter Park speak English at home.
3.7% of residents speak Spanish at home 361 70.2% Speak English very well153 29.8% Speak English less than very well1.8% of residents speak other language at home 241 100.0% Speak English very well
English speakers - Native, born elsewhere 34.8% of residents of Winter Park speak English at home.
64.8% of residents speak Spanish at home 471 77.0% Speak English very well141 23.0% Speak English less than very well2.1% of residents speak other language at home 20 100.0% Speak English very well
English speakers - Foreign-born 25.5% of residents of Winter Park speak English at home.
20.9% of residents speak Spanish at home 577 73.4% Speak English very well209 26.6% Speak English less than very well53.1% of residents speak other language at home 1,452 72.8% Speak English very well542 27.2% Speak English less than very well
White (Caucasian) - Speak only English Native:
100.0% (18,513)Foreign-born:
39.6% (393)
White (Caucasian) - Speak another language Native:
2.9% (540)Foreign-born:
64.4% (639)
Black or African American - Speak only English Native:
91.8% (971)Foreign-born:
97.0% (57)
Black or African American - Speak another language Native:
7.7% (82)Foreign-born:
10.0% (6)
Asian - Speak only English Native:
82.8% (629)Foreign-born:
20.8% (217)
Asian - Speak another language Native:
20.6% (156)Foreign-born:
78.8% (823)
Other race - Speak only English Native:
53.4% (217)Foreign-born:
6.1% (9)
Other race - Speak another language Native:
49.5% (201)Foreign-born:
94.5% (143)
Two or more races - Speak only English Native:
56.2% (1,422)Foreign-born:
13.1% (138)
Two or more races - Speak another language Native:
43.2% (1,095)Foreign-born:
86.8% (918)
White alone - Speak only English Native:
98.5% (19,283)Foreign-born:
31.7% (460)
White alone - Speak another language Native:
1.7% (332)Foreign-born:
66.1% (959)
Hispanic or Latino - Speak only English Native:
46.9% (1,356)Foreign-born:
4.2% (34)
Hispanic or Latino - Speak another language Native:
55.1% (1,593)Foreign-born:
95.9% (779)
Foreign-born residents in Winter Park 3,713 residents are foreign born (3.7% Latin America , 3.2% Europe , 3.0% Asia , 1.2% Africa ).
This city:
12.2%Florida:
21.1%
Marital status for residents in Winter Park Marital status - White (Caucasian) population 15 years and over
Males 34.3% Never married53.1% Now married0.7% Separated2.9% Widowed9.0% DivorcedFemales 31.2% Never married42.6% Now married1.0% Separated11.0% Widowed14.1% DivorcedWomen who gave birth in the past 12 months Now married:
86.9% (139)Unmarried:
13.1% (21)
Women who did not give birth in the past 12 months Now married:
37.2% (1,542)Unmarried:
62.8% (2,607)
Marital status - Black or African American population 15 years and over
Males 54.7% Never married25.5% Now married0.0% Separated5.7% Widowed14.0% DivorcedFemales 35.8% Never married16.3% Now married0.0% Separated16.8% Widowed31.0% DivorcedWomen who did not give birth in the past 12 months Now married:
13.0% (33)Unmarried:
87.0% (220)
Marital status - American Indian / Alaska Native population 15 years and over
Males 0.0% Never married0.0% Now married0.0% Separated0.0% Widowed100.0% DivorcedFemales 0.0% Never married22.2% Now married0.0% Separated0.0% Widowed77.8% DivorcedMarital status - Asian population 15 years and over
Males 21.4% Never married69.3% Now married0.0% Separated0.0% Widowed9.4% DivorcedFemales 54.2% Never married40.0% Now married0.0% Separated4.2% Widowed1.6% DivorcedWomen who did not give birth in the past 12 months Now married:
30.4% (223)Unmarried:
69.6% (510)
Marital status - Other race population 15 years and over
Males 38.2% Never married39.6% Now married0.0% Separated0.0% Widowed22.2% DivorcedFemales 34.5% Never married26.7% Now married11.2% Separated16.5% Widowed11.2% DivorcedWomen who gave birth in the past 12 months Now married:
100.0% (18)Unmarried:
0.0% (0)
Women who did not give birth in the past 12 months Now married:
58.0% (70)Unmarried:
42.0% (51)
Marital status - Two or more races population 15 years and over
Males 44.3% Never married45.9% Now married4.5% Separated0.7% Widowed4.7% DivorcedFemales 36.9% Never married31.9% Now married0.6% Separated16.5% Widowed14.0% DivorcedWomen who gave birth in the past 12 months Now married:
42.5% (82)Unmarried:
57.5% (110)
Women who did not give birth in the past 12 months Now married:
21.4% (158)Unmarried:
78.6% (580)
Marital status - White alone, not Hispanic / Latino population 15 years and over
Males 32.9% Never married54.5% Now married0.7% Separated3.1% Widowed8.8% DivorcedFemales 31.0% Never married43.0% Now married0.9% Separated11.1% Widowed13.9% DivorcedWomen who gave birth in the past 12 months Now married:
86.3% (158)Unmarried:
13.7% (25)
Women who did not give birth in the past 12 months Now married:
36.9% (1,706)Unmarried:
63.1% (2,916)
Marital status - Hispanic or Latino population 15 years and over
Males 51.6% Never married38.0% Now married2.0% Separated0.4% Widowed7.9% DivorcedFemales 38.9% Never married29.0% Now married2.7% Separated16.7% Widowed12.7% DivorcedWomen who gave birth in the past 12 months Now married:
57.4% (79)Unmarried:
42.6% (59)
Women who did not give birth in the past 12 months Now married:
28.3% (251)Unmarried:
71.7% (637)
Ancestries in Winter Park
2,363 14.8% American1,526 9.6% English1,169 7.3% German1,156 7.2% Italian1,103 6.9% Irish691 4.3% European446 2.8% Scottish244 1.5% Brazilian231 1.4% Polish178 1.1% Lebanese165 1.0% Norwegian162 1.0% Eastern European146 0.9% Scotch-Irish128 0.8% Lithuanian110 0.7% French108 0.7% Russian107 0.7% Swedish106 0.7% Egyptian102 0.6% Greek97 0.6% Northern European75 0.5% British63 0.4% Iranian57 0.4% Canadian47 0.3% Dutch47 0.3% African41 0.3% Serbian40 0.3% Portuguese40 0.3% Scandinavian40 0.3% Turkish34 0.2% Romanian33 0.2% Danish30 0.2% Slovak28 0.2% Jamaican24 0.2% Albanian21 0.1% Welsh19 0.1% Slavic18 0.1% Armenian16 0.1% Czech15 0.09% French Canadian13 0.08% Ukrainian12 0.08% Austrian11 0.07% Croatian10 0.06% Ghanaian10 0.06% Celtic9 0.06% Trinidadian and Tobagonian8 0.05% Slovene7 0.04% Macedonian6 0.04% Icelander5 0.03% Hungarian4 0.03% Syrian4 0.03% U.S. Virgin Islander2 0.01% Swiss
Geographical mobility in Winter Park Same house 1 year ago 16,166 82.3% White (Caucasian)881 78.2% Black or African American44 68.8% American Indian / Alaska Native1,604 88.0% Asian12 100.0% Native Hawaiian / Pacific Islander498 77.5% Other race3,137 81.6% Two or more races17,925 83.0% White alone, not Hispanic / Latino3,098 78.5% Hispanic or LatinoMoved within same county 1,283 6.5% White / Caucasian150 13.3% Black or African American148 8.1% Asian21 3.3% Other race299 7.8% Two or more races1,423 6.6% White alone, not Hispanic / Latino245 6.2% Hispanic or LatinoMoved within same state 993 5.1% White / Caucasian49 4.3% Black or African American24 1.3% Asian53 8.2% Other race154 4.0% Two or more races894 4.1% White alone, not Hispanic / Latino366 9.3% Hispanic or LatinoMoved from different state 1,045 5.3% White / Caucasian26 2.3% Black or African American17 26.1% American Indian / Alaska Native39 2.2% Asian61 9.5% Other race75 2.0% Two or more races1,067 4.9% White alone, not Hispanic / Latino181 4.6% Hispanic or LatinoMoved from abroad 192 1.0% White11 0.6% Asian25 3.9% Other race169 4.4% Two or more races264 1.2% White alone, not Hispanic / Latino85 2.1% Hispanic or Latino
Children Nativity (place of birth) in Winter Park
Children under 6 years - Living with two parents Both parents native 775 100.0% NativeBoth parents foreign-born 73 66.2% Native38 33.8% Foreign-bornOne native, one foreign-born parent 133 100.0% NativeChildren under 6 years - Living with one parent Native parent 272 100.0% NativeForeign-born parent 10 100.0% NativeChildren 6 to 17 years - Living with two parents Both parents native 2,405 100.0% Native1 0.0% Foreign-bornBoth parents foreign-born 86 44.5% Native108 55.5% Foreign-bornOne native, one foreign-born parent 462 100.0% NativeChildren 6 to 17 years - Living with one parent Native parent 535 100.0% NativeForeign-born parent 57 49.1% Native58 50.9% Foreign-born
Grandparents responsible for own grandchildren in Winter Park
Grandparents (30 to 59 years) White / Caucasian 31 100.0% Responsible for grandchildrenOther race 22 100.0% Not responsible for grandchildrenWhite alone, not Hispanic / Latino 37 100.0% Responsible for grandchildrenHispanic or Latino 21 100.0% Not responsible for grandchildrenGrandparents (60 years and over) White / Caucasian 5 31.3% Responsible for grandchildren11 68.7% Not responsible for grandchildrenOther race 32 100.0% Not responsible for grandchildrenWhite alone, not Hispanic / Latino 7 32.7% Responsible for grandchildren15 67.3% Not responsible for grandchildrenHispanic or Latino 49 100.0% Not responsible for grandchildren