Races in Winter Garden, Florida (FL) Detailed Stats
Data:
Races - White alone (%)
Races - White alone (% change since 2000)
Races - Black alone (%)
Races - Black alone (% change since 2000)
Races - American Indian alone (%)
Races - American Indian alone (% change since 2000)
Races - Asian alone (%)
Races - Asian alone (% change since 2000)
Races - Hispanic (%)
Races - Hispanic (% change since 2000)
Races - Native Hawaiian and Other Pacific Islander alone (%)
Races - Native Hawaiian and Other Pacific Islander alone (% change since 2000)
Races - Two or more races(%)
Races - Two or more races(% change since 2000)
Races - Other race alone (%)
Races - Other race alone (% change since 2000)
Racial diversity
Place of birth - Born in state of residence (%)
Place of birth - Born in state of residence (%) - White
Place of birth - Born in state of residence (%) - Black or African American
Place of birth - Born in state of residence (%) - Asian
Place of birth - Born in state of residence (%) - Hispanic or Latino
Place of birth - Born in state of residence (%) - American Indian and Alaska Native
Place of birth - Born in state of residence (%) - Multirace
Place of birth - Born in state of residence (%) - Other Race
Place of birth - Born in other state (%)
Place of birth - Born in other state (%) - White
Place of birth - Born in other state (%) - Black or African American
Place of birth - Born in other state (%) - Asian
Place of birth - Born in other state (%) - Hispanic or Latino
Place of birth - Born in other state (%) - American Indian and Alaska Native
Place of birth - Born in other state (%) - Multirace
Place of birth - Born in other state (%) - Other Race
Place of birth - Native, outside of US (%)
Place of birth - Native, outside of US (%) - White
Place of birth - Native, outside of US (%) - Black or African American
Place of birth - Native, outside of US (%) - Asian
Place of birth - Native, outside of US (%) - Hispanic or Latino
Place of birth - Native, outside of US (%) - American Indian and Alaska Native
Place of birth - Native, outside of US (%) - Multirace
Place of birth - Native, outside of US (%) - Other Race
Place of birth - Foreign born (%)
Place of birth - Foreign born (%) - White
Place of birth - Foreign born (%) - Black or African American
Place of birth - Foreign born (%) - Asian
Place of birth - Foreign born (%) - Hispanic or Latino
Place of birth - Foreign born (%) - American Indian and Alaska Native
Place of birth - Foreign born (%) - Multirace
Place of birth - Foreign born (%) - Other Race
Residents speaking English at home (%)
Residents speaking English at home - Born in the United States (%)
Residents speaking English at home - Native, born elsewhere (%)
Residents speaking English at home - Foreign born (%)
Residents speaking Spanish at home (%)
Residents speaking Spanish at home - Born in the United States (%)
Residents speaking Spanish at home - Native, born elsewhere (%)
Residents speaking Spanish at home - Foreign born (%)
Residents speaking other language at home (%)
Residents speaking other language at home - Born in the United States (%)
Residents speaking other language at home - Native, born elsewhere (%)
Residents speaking other language at home - Foreign born (%)
Marital status - Never married (%)
Marital status - Now married (%)
Marital status - Separated (%)
Marital status - Widowed (%)
Marital status - Divorced (%)
Ancestries Reported - Arab (%)
Ancestries Reported - Czech (%)
Ancestries Reported - Danish (%)
Ancestries Reported - Dutch (%)
Ancestries Reported - English (%)
Ancestries Reported - French (%)
Ancestries Reported - French Canadian (%)
Ancestries Reported - German (%)
Ancestries Reported - Greek (%)
Ancestries Reported - Hungarian (%)
Ancestries Reported - Irish (%)
Ancestries Reported - Italian (%)
Ancestries Reported - Lithuanian (%)
Ancestries Reported - Norwegian (%)
Ancestries Reported - Polish (%)
Ancestries Reported - Portuguese (%)
Ancestries Reported - Russian (%)
Ancestries Reported - Scotch-Irish (%)
Ancestries Reported - Scottish (%)
Ancestries Reported - Slovak (%)
Ancestries Reported - Subsaharan African (%)
Ancestries Reported - Swedish (%)
Ancestries Reported - Swiss (%)
Ancestries Reported - Ukrainian (%)
Ancestries Reported - United States (%)
Ancestries Reported - Welsh (%)
Ancestries Reported - West Indian (%)
Ancestries Reported - Other (%)
Geographical mobility - Same house 1 year ago (%)
Geographical mobility - Same house 1 year ago (%) - White
Geographical mobility - Same house 1 year ago (%) - Black or African American
Geographical mobility - Same house 1 year ago (%) - Asian
Geographical mobility - Same house 1 year ago (%) - Hispanic or Latino
Geographical mobility - Same house 1 year ago (%) - American Indian and Alaska Native
Geographical mobility - Same house 1 year ago (%) - Multirace
Geographical mobility - Same house 1 year ago (%) - Other Race
Geographical mobility - Moved within same county (%)
Geographical mobility - Moved within same county (%) - White
Geographical mobility - Moved within same county (%) - Black or African American
Geographical mobility - Moved within same county (%) - Asian
Geographical mobility - Moved within same county (%) - Hispanic or Latino
Geographical mobility - Moved within same county (%) - American Indian and Alaska Native
Geographical mobility - Moved within same county (%) - Multirace
Geographical mobility - Moved within same county (%) - Other Race
Geographical mobility - Moved from different county within same state (%)
Geographical mobility - Moved from different county within same state (%) - White
Geographical mobility - Moved from different county within same state (%) - Black or African American
Geographical mobility - Moved from different county within same state (%) - Asian
Geographical mobility - Moved from different county within same state (%) - Hispanic or Latino
Geographical mobility - Moved from different county within same state (%) - American Indian and Alaska Native
Geographical mobility - Moved from different county within same state (%) - Multirace
Geographical mobility - Moved from different county within same state (%) - Other Race
Geographical mobility - Moved from different state (%)
Geographical mobility - Moved from different state (%) - White
Geographical mobility - Moved from different state (%) - Black or African American
Geographical mobility - Moved from different state (%) - Asian
Geographical mobility - Moved from different state (%) - Hispanic or Latino
Geographical mobility - Moved from different state (%) - American Indian and Alaska Native
Geographical mobility - Moved from different state (%) - Multirace
Geographical mobility - Moved from different state (%) - Other Race
Geographical mobility - Moved from abroad (%)
Geographical mobility - Moved from abroad (%) - White
Geographical mobility - Moved from abroad (%) - Black or African American
Geographical mobility - Moved from abroad (%) - Asian
Geographical mobility - Moved from abroad (%) - Hispanic or Latino
Geographical mobility - Moved from abroad (%) - American Indian and Alaska Native
Geographical mobility - Moved from abroad (%) - Multirace
Geographical mobility - Moved from abroad (%) - Other Race
Place of birth for the foreign-born population - Ireland (%)
Place of birth for the foreign-born population - Denmark (%)
Place of birth for the foreign-born population - Norway (%)
Place of birth for the foreign-born population - Sweden (%)
Place of birth for the foreign-born population - United Kingdom (%)
Place of birth for the foreign-born population - England (%)
Place of birth for the foreign-born population - Scotland (%)
Place of birth for the foreign-born population - Other Northern Europe (%)
Place of birth for the foreign-born population - Austria (%)
Place of birth for the foreign-born population - Belgium (%)
Place of birth for the foreign-born population - France (%)
Place of birth for the foreign-born population - Germany (%)
Place of birth for the foreign-born population - Netherlands (%)
Place of birth for the foreign-born population - Switzerland (%)
Place of birth for the foreign-born population - Other Western Europe (%)
Place of birth for the foreign-born population - Greece (%)
Place of birth for the foreign-born population - Italy (%)
Place of birth for the foreign-born population - Portugal (%)
Place of birth for the foreign-born population - Spain (%)
Place of birth for the foreign-born population - Other Southern Europe (%)
Place of birth for the foreign-born population - Albania (%)
Place of birth for the foreign-born population - Belarus (%)
Place of birth for the foreign-born population - Bosnia and Herzegovina (%)
Place of birth for the foreign-born population - Bulgaria (%)
Place of birth for the foreign-born population - Croatia (%)
Place of birth for the foreign-born population - Czechoslovakia (%)
Place of birth for the foreign-born population - Hungary (%)
Place of birth for the foreign-born population - Latvia (%)
Place of birth for the foreign-born population - Lithuania (%)
Place of birth for the foreign-born population - North Macedonia (Macedonia) (%)
Place of birth for the foreign-born population - Moldova (%)
Place of birth for the foreign-born population - Poland (%)
Place of birth for the foreign-born population - Romania (%)
Place of birth for the foreign-born population - Russia (%)
Place of birth for the foreign-born population - Serbia (%)
Place of birth for the foreign-born population - Ukraine (%)
Place of birth for the foreign-born population - Other Eastern Europe (%)
Place of birth for the foreign-born population - China (%)
Place of birth for the foreign-born population - Hong Kong (%)
Place of birth for the foreign-born population - Taiwan (%)
Place of birth for the foreign-born population - Japan (%)
Place of birth for the foreign-born population - Korea (%)
Place of birth for the foreign-born population - Other Eastern Asia (%)
Place of birth for the foreign-born population - Afghanistan (%)
Place of birth for the foreign-born population - Bangladesh (%)
Place of birth for the foreign-born population - India (%)
Place of birth for the foreign-born population - Iran (%)
Place of birth for the foreign-born population - Kazakhstan (%)
Place of birth for the foreign-born population - Nepal (%)
Place of birth for the foreign-born population - Pakistan (%)
Place of birth for the foreign-born population - Sri Lanka (%)
Place of birth for the foreign-born population - Uzbekistan (%)
Place of birth for the foreign-born population - Other South Central Asia (%)
Place of birth for the foreign-born population - Burma (%)
Place of birth for the foreign-born population - Cambodia (%)
Place of birth for the foreign-born population - Indonesia (%)
Place of birth for the foreign-born population - Laos (%)
Place of birth for the foreign-born population - Malaysia (%)
Place of birth for the foreign-born population - Philippines (%)
Place of birth for the foreign-born population - Singapore (%)
Place of birth for the foreign-born population - Thailand (%)
Place of birth for the foreign-born population - Vietnam (%)
Place of birth for the foreign-born population - Other South Eastern Asia (%)
Place of birth for the foreign-born population - Armenia (%)
Place of birth for the foreign-born population - Iraq (%)
Place of birth for the foreign-born population - Israel (%)
Place of birth for the foreign-born population - Jordan (%)
Place of birth for the foreign-born population - Kuwait (%)
Place of birth for the foreign-born population - Lebanon (%)
Place of birth for the foreign-born population - Saudi Arabia (%)
Place of birth for the foreign-born population - Syria (%)
Place of birth for the foreign-born population - Turkey (%)
Place of birth for the foreign-born population - Yemen (%)
Place of birth for the foreign-born population - Other Western Asia (%)
Place of birth for the foreign-born population - Eritrea (%)
Place of birth for the foreign-born population - Ethiopia (%)
Place of birth for the foreign-born population - Kenya (%)
Place of birth for the foreign-born population - Somalia (%)
Place of birth for the foreign-born population - Uganda (%)
Place of birth for the foreign-born population - Zimbabwe (%)
Place of birth for the foreign-born population - Other Eastern Africa (%)
Place of birth for the foreign-born population - Cameroon (%)
Place of birth for the foreign-born population - Congo (%)
Place of birth for the foreign-born population - Democratic Republic of Congo (Zaire) (%)
Place of birth for the foreign-born population - Other Middle Africa (%)
Place of birth for the foreign-born population - Egypt (%)
Place of birth for the foreign-born population - Morocco (%)
Place of birth for the foreign-born population - Sudan (%)
Place of birth for the foreign-born population - Other Northern Africa (%)
Place of birth for the foreign-born population - South Africa (%)
Place of birth for the foreign-born population - Other Southern Africa (%)
Place of birth for the foreign-born population - Cabo Verde (%)
Place of birth for the foreign-born population - Ghana (%)
Place of birth for the foreign-born population - Liberia (%)
Place of birth for the foreign-born population - Nigeria (%)
Place of birth for the foreign-born population - Senegal (%)
Place of birth for the foreign-born population - Sierra Leone (%)
Place of birth for the foreign-born population - Other Western Africa (%)
Place of birth for the foreign-born population - Australia (%)
Place of birth for the foreign-born population - New Zealand (%)
Place of birth for the foreign-born population - Fiji (%)
Place of birth for the foreign-born population - Micronesia (%)
Place of birth for the foreign-born population - Bahamas (%)
Place of birth for the foreign-born population - Barbados (%)
Place of birth for the foreign-born population - Cuba (%)
Place of birth for the foreign-born population - Dominica (%)
Place of birth for the foreign-born population - Dominican Republic (%)
Place of birth for the foreign-born population - Grenada (%)
Place of birth for the foreign-born population - Haiti (%)
Place of birth for the foreign-born population - Jamaica (%)
Place of birth for the foreign-born population - St. Vincent and the Grenadines (%)
Place of birth for the foreign-born population - Trinidad and Tobago (%)
Place of birth for the foreign-born population - West Indies (%)
Place of birth for the foreign-born population - Other Caribbean (%)
Place of birth for the foreign-born population - Belize (%)
Place of birth for the foreign-born population - Costa Rica (%)
Place of birth for the foreign-born population - El Salvador (%)
Place of birth for the foreign-born population - Guatemala (%)
Place of birth for the foreign-born population - Honduras (%)
Place of birth for the foreign-born population - Mexico (%)
Place of birth for the foreign-born population - Nicaragua (%)
Place of birth for the foreign-born population - Panama (%)
Place of birth for the foreign-born population - Other Central America (%)
Place of birth for the foreign-born population - Argentina (%)
Place of birth for the foreign-born population - Bolivia (%)
Place of birth for the foreign-born population - Brazil (%)
Place of birth for the foreign-born population - Chile (%)
Place of birth for the foreign-born population - Colombia (%)
Place of birth for the foreign-born population - Ecuador (%)
Place of birth for the foreign-born population - Guyana (%)
Place of birth for the foreign-born population - Peru (%)
Place of birth for the foreign-born population - Uruguay (%)
Place of birth for the foreign-born population - Venezuela (%)
Place of birth for the foreign-born population - Other South America (%)
Place of birth for the foreign-born population - Canada (%)
Place of birth for the foreign-born population - Other Northern America (%)
Place of birth for the foreign-born population - Other (%)
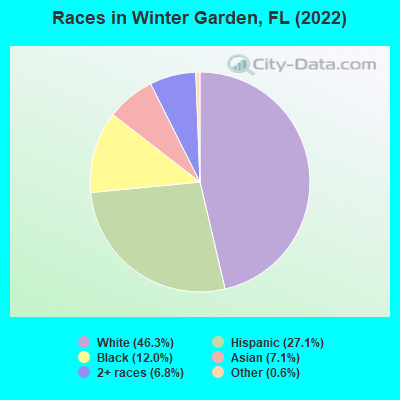
According to 2022 data, the most numerous races in Winter Garden, FL are White alone (21,934 residents), Hispanic (12,835 residents), and Black alone (5,664 residents). 73.1% of Winter Garden residents speak English at home. 22.8% of Winter Garden, FL residents are foreign-born (16.5% born in Latin America, 3.7% born in Asia), which is 7.8% greater than the foreign-born rate of 21.0% across the entire state of Florida.
Race distribution in Winter Garden
2000 2022
10,458,509 65.4% White alone 2,682,715 16.8% Hispanic 2,264,268 14.2% Black alone 261,693 1.6% Asian alone 236,954 1.5% Two or more races 42,358 0.3% American Indian alone 28,994 0.2% Other race alone 6,887 0.04% Native Hawaiian and Other
11,309,403 50.8% White alone 6,025,039 27.1% Hispanic 3,241,015 14.6% Black alone 861,630 3.9% Two or more races 623,692 2.8% Asian alone 152,054 0.7% Other race alone 22,504 0.1% American Indian alone 9,486 0.04% Native Hawaiian and Other
Income and house value in Winter Garden Median household income in 2022 $112,281 White non-Hispanic householders$59,607 Black householders$80,952 Asian householders$92,393 Some other race householders$98,898 Two or more races householders$88,019 Hispanic or Latino race householdersMedian 2022 house value $567,998 White Non-Hispanic householders$321,717 Black or African American householdersover $1,000,000 American Indian or Alaska Native householders $109,273 Asian householders$471,482 Native Hawaiian and other Pacific Islander householders$448,185 Some other race householders$514,193 Two or more races householders$463,162 Hispanic or Latino householders
Median age by race in Winter Garden
41.9 Median age for White residents41.9 41.7 36.7 Median age for Black or African American residents42.0 36.2 -614,300,100.1 Median age for American Indian / Alaska Native residents-735,632,183.2 -529,680,364.8 38.5 Median age for Asian residents28.0 47.8 -679,790,025.6 Median age for Native Hawaiian / Pacific Islander residents-1,327,635,326.3 -611,111,110.5 34.0 Median age for Other race residents32.1 38.3 43.4 Median age for Two or more races residents42.0 45.8 44.4 Median age for White alone residents44.1 44.9 35.6 Median age for Hispanic or Latino residents34.3 38.3
Owner/renter occupied households by race in Winter Garden
House owners and renters - White residents 7,007 77.0% Owner occupied2,095 23.0% Renter occupiedHouse owners and renters - Black or African American residents 1,221 55.5% Owner occupied979 44.5% Renter occupiedHouse owners and renters - American Indian / Alaska Native residents 41 100.0% Renter occupiedHouse owners and renters - Asian residents 1,046 96.5% Owner occupied38 3.5% Renter occupiedHouse owners and renters - Other race residents 232 40.1% Owner occupied346 59.9% Renter occupiedHouse owners and renters - Two or more races residents 1,330 47.9% Owner occupied1,447 52.1% Renter occupiedHouse owners and renters - White alone residents 6,740 78.3% Owner occupied1,867 21.7% Renter occupiedHouse owners and renters - Hispanic or Latino residents 2,065 55.8% Owner occupied1,634 44.2% Renter occupied
Language usage in Winter Garden
English speakers - Total 73.1% of residents of Winter Garden speak English at home.
17.1% of residents speak Spanish at home 4,115 53.7% Speak English very well3,549 46.3% Speak English less than very well9.7% of residents speak other language at home 2,421 55.7% Speak English very well1,924 44.3% Speak English less than very well
English speakers - Born in the United States 93.3% of residents of Winter Garden speak English at home.
6.0% of residents speak Spanish at home 995 96.4% Speak English very well37 3.6% Speak English less than very well0.6% of residents speak other language at home 88 79.3% Speak English very well23 20.7% Speak English less than very well
English speakers - Native, born elsewhere 28.9% of residents of Winter Garden speak English at home.
76.2% of residents speak Spanish at home 1,061 89.8% Speak English very well120 10.2% Speak English less than very well
English speakers - Foreign-born 22.4% of residents of Winter Garden speak English at home.
44.4% of residents speak Spanish at home 1,213 25.1% Speak English very well3,612 74.9% Speak English less than very well33.4% of residents speak other language at home 1,719 47.4% Speak English very well1,910 52.6% Speak English less than very well
White (Caucasian) - Speak only English Native:
98.4% (20,281)Foreign-born:
30.4% (617)
White (Caucasian) - Speak another language Native:
5.8% (1,203)Foreign-born:
71.8% (1,455)
Black or African American - Speak only English Native:
96.6% (4,558)Foreign-born:
75.8% (847)
Black or African American - Speak another language Native:
2.3% (107)Foreign-born:
28.3% (316)
Asian - Speak only English Native:
100.0% (1,326)Foreign-born:
20.9% (427)
Asian - Speak another language Native:
2.7% (36)Foreign-born:
78.7% (1,609)
Other race - Speak only English Native:
59.2% (369)Foreign-born:
8.0% (70)
Other race - Speak another language Native:
44.5% (277)Foreign-born:
91.7% (796)
Two or more races - Speak only English Native:
70.8% (3,549)Foreign-born:
6.0% (291)
Two or more races - Speak another language Native:
27.7% (1,388)Foreign-born:
94.1% (4,541)
White alone - Speak only English Native:
96.9% (19,156)Foreign-born:
50.9% (718)
White alone - Speak another language Native:
3.2% (624)Foreign-born:
41.1% (580)
Hispanic or Latino - Speak only English Native:
62.7% (4,269)Foreign-born:
6.3% (325)
Hispanic or Latino - Speak another language Native:
42.3% (2,878)Foreign-born:
93.6% (4,845)
Foreign-born residents in Winter Garden 10,782 residents are foreign born (16.5% Latin America , 3.7% Asia ).
This city:
22.8%Florida:
21.1%
Marital status for residents in Winter Garden Marital status - White (Caucasian) population 15 years and over
Males 27.2% Never married60.4% Now married1.7% Separated2.5% Widowed8.2% DivorcedFemales 24.0% Never married56.4% Now married0.4% Separated7.4% Widowed11.8% DivorcedWomen who gave birth in the past 12 months Now married:
96.9% (178)Unmarried:
3.1% (6)
Women who did not give birth in the past 12 months Now married:
54.0% (2,893)Unmarried:
46.0% (2,469)
Marital status - Black or African American population 15 years and over
Males 44.6% Never married37.1% Now married0.1% Separated4.1% Widowed14.2% DivorcedFemales 45.5% Never married27.2% Now married3.0% Separated7.3% Widowed17.1% DivorcedWomen who gave birth in the past 12 months Now married:
26.1% (18)Unmarried:
73.9% (51)
Women who did not give birth in the past 12 months Now married:
25.3% (425)Unmarried:
74.7% (1,258)
Marital status - Asian population 15 years and over
Males 47.8% Never married36.9% Now married0.0% Separated0.0% Widowed15.3% DivorcedFemales 23.7% Never married47.3% Now married3.6% Separated4.2% Widowed21.2% DivorcedWomen who did not give birth in the past 12 months Now married:
43.3% (345)Unmarried:
56.7% (451)
Marital status - Other race population 15 years and over
Males 32.6% Never married47.8% Now married17.6% Separated0.0% Widowed2.0% DivorcedFemales 43.7% Never married46.6% Now married0.0% Separated8.3% Widowed1.4% DivorcedWomen who did not give birth in the past 12 months Now married:
46.8% (270)Unmarried:
53.2% (308)
Marital status - Two or more races population 15 years and over
Males 26.5% Never married68.8% Now married1.4% Separated0.0% Widowed3.3% DivorcedFemales 19.8% Never married65.5% Now married3.2% Separated6.3% Widowed5.2% DivorcedWomen who gave birth in the past 12 months Now married:
32.2% (42)Unmarried:
67.8% (87)
Women who did not give birth in the past 12 months Now married:
77.0% (1,833)Unmarried:
23.0% (547)
Marital status - White alone, not Hispanic / Latino population 15 years and over
Males 25.6% Never married64.2% Now married0.6% Separated1.8% Widowed7.9% DivorcedFemales 22.2% Never married56.5% Now married0.4% Separated8.0% Widowed12.9% DivorcedWomen who gave birth in the past 12 months Now married:
100.0% (174)Unmarried:
0.0% (0)
Women who did not give birth in the past 12 months Now married:
53.3% (2,575)Unmarried:
46.7% (2,260)
Marital status - Hispanic or Latino population 15 years and over
Males 30.6% Never married55.1% Now married5.0% Separated2.5% Widowed6.8% DivorcedFemales 31.7% Never married55.1% Now married0.6% Separated7.2% Widowed5.4% DivorcedWomen who gave birth in the past 12 months Now married:
50.4% (70)Unmarried:
49.6% (69)
Women who did not give birth in the past 12 months Now married:
59.1% (1,896)Unmarried:
40.9% (1,313)
Ancestries in Winter Garden
7,454 24.8% American1,417 4.7% English1,030 3.4% German816 2.7% Irish770 2.6% European691 2.3% African622 2.1% Italian479 1.6% Eastern European401 1.3% Brazilian333 1.1% Jamaican329 1.1% British227 0.8% Swiss223 0.7% Scottish192 0.6% Polish187 0.6% Guyanese177 0.6% Haitian137 0.5% Russian115 0.4% Norwegian111 0.4% West Indian102 0.3% Turkish81 0.3% Swedish61 0.2% Scotch-Irish55 0.2% Albanian55 0.2% Hungarian54 0.2% Slovak49 0.2% Dutch42 0.1% Yugoslavian35 0.1% Barbadian34 0.1% Bahamian33 0.1% Palestinian33 0.1% Belgian33 0.1% Ukrainian30 0.10% Czechoslovakian28 0.09% Scandinavian25 0.08% U.S. Virgin Islander23 0.08% Canadian22 0.07% Greek19 0.06% Portuguese16 0.05% Afghan15 0.05% Israeli14 0.05% Nigerian13 0.04% French Canadian13 0.04% Liberian10 0.03% Welsh
Geographical mobility in Winter Garden Same house 1 year ago 21,235 90.1% White (Caucasian)5,944 92.8% Black or African American44 100.0% American Indian / Alaska Native2,804 81.0% Asian1,380 85.0% Other race9,769 96.0% Two or more races20,130 91.9% White alone, not Hispanic / Latino11,008 86.8% Hispanic or LatinoMoved within same county 1,193 5.1% White / Caucasian461 7.2% Black or African American275 8.0% Asian63 3.9% Other race181 1.8% Two or more races872 4.0% White alone, not Hispanic / Latino877 6.9% Hispanic or LatinoMoved within same state 586 2.5% White / Caucasian64 1.0% Black or African American29 0.3% Two or more races355 1.6% White alone, not Hispanic / Latino328 2.6% Hispanic or LatinoMoved from different state 574 2.4% White / Caucasian20 0.3% Black or African American424 12.2% Asian166 10.3% Other race61 0.6% Two or more races615 2.8% White alone, not Hispanic / Latino185 1.5% Hispanic or LatinoMoved from abroad 45 2.8% Other race321 3.2% Two or more races224 1.8% Hispanic or Latino
Children Nativity (place of birth) in Winter Garden
Children under 6 years - Living with two parents Both parents native 2,235 100.0% NativeBoth parents foreign-born 825 100.0% NativeOne native, one foreign-born parent 191 100.0% NativeChildren under 6 years - Living with one parent Native parent 251 90.2% Native27 9.8% Foreign-bornForeign-born parent 34 30.8% Native76 69.2% Foreign-bornChildren 6 to 17 years - Living with two parents Both parents native 3,961 99.2% Native30 0.8% Foreign-bornBoth parents foreign-born 431 55.9% Native340 44.1% Foreign-bornOne native, one foreign-born parent 517 100.0% NativeChildren 6 to 17 years - Living with one parent Native parent 1,585 100.0% NativeForeign-born parent 877 56.3% Native680 43.7% Foreign-born
Place of birth for residents in Winter Garden 8,162 Americas8,098 Latin America4,902 South America2,135 Central America1,812 Asia1,060 Caribbean760 South Eastern Asia566 Eastern Asia550 China525 Europe392 South Central Asia282 Africa222 Eastern Europe164 Western Africa163 Western Europe117 Eastern Africa110 Northern Europe92 Western Asia64 Northern America29 Southern Europe1,344 Mexico1,241 Colombia1,112 Guyana1,065 Brazil706 Vietnam680 Jamaica680 Venezuela360 India328 Ecuador287 Guatemala280 China224 Hong Kong207 Argentina188 Peru179 El Salvador156 Panama142 Liberia133 Russia122 Honduras107 Cuba87 Austria82 United Kingdom71 Ethiopia66 Haiti64 Canada64 Germany53 Philippines51 Turkey48 Dominica46 Dominican Republic46 Albania46 Taiwan45 Costa Rica34 Uganda33 Ukraine31 Barbados29 Italy29 Bolivia27 Armenia25 Trinidad and Tobago22 Nigeria16 Afghanistan15 Korea15 Sri Lanka13 Iraq11 England10 Norway8 Poland7 Chile6 Belgium6 Scotland5 France
Grandparents responsible for own grandchildren in Winter Garden
Grandparents (30 to 59 years) White / Caucasian 18 62.7% Responsible for grandchildren11 37.3% Not responsible for grandchildrenBlack or African American 18 100.0% Not responsible for grandchildrenOther race 111 100.0% Responsible for grandchildrenTwo or more races 59 29.9% Responsible for grandchildren140 70.1% Not responsible for grandchildrenWhite alone, not Hispanic / Latino 21 57.8% Responsible for grandchildren15 42.2% Not responsible for grandchildrenHispanic or Latino 112 88.7% Responsible for grandchildren14 11.3% Not responsible for grandchildrenGrandparents (60 years and over) White / Caucasian 78 33.9% Responsible for grandchildren151 66.1% Not responsible for grandchildrenBlack or African American 85 100.0% Not responsible for grandchildrenTwo or more races 63 100.0% Not responsible for grandchildrenWhite alone, not Hispanic / Latino 113 40.7% Responsible for grandchildren164 59.3% Not responsible for grandchildrenHispanic or Latino 50 100.0% Not responsible for grandchildren