Races in Winnemucca, Nevada (NV) Detailed Stats
Ancestries, Foreign-born residents, place of birth
Settings
X


Recent posts about races in Winnemucca, Nevada on our local forum with over 2,400,000 registered users:
 | Looking for info regarding the Winnemucca rental market (0 replies) |
| Need Insight Into the Outskirts - Winnemucca, Yerington etc (5 replies) |
| Moved to Las Vegas from rural Nevada 6 months ago- here’s a review! (8 replies) |
| Moving to Dayton Nevada (20 replies) |
| want info about rural areas north, south and east of reno (14 replies) |
| Headin' for Winnemucca (72 replies) |
Latest news about races in Winnemucca, NV collected exclusively by city-data.com from local newspapers, TV, and radio stations
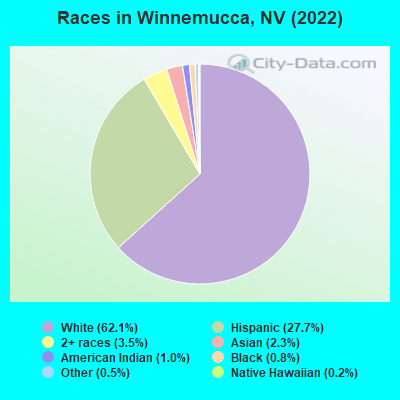
According to 2022 data, the most numerous races in Winnemucca, NV are White alone (5,309 residents), Hispanic (2,366 residents), and Black alone (70 residents). 85.7% of Winnemucca residents speak English at home. 10.6% of Winnemucca, NV residents are foreign-born (7.4% born in Latin America, 1.9% born in Asia), which is 70.1% less than the foreign-born rate of 18.0% across the entire state of Nevada.
Race distribution in Winnemucca
2000
2022

- 5,30373.9%White alone
- 1,48820.7%Hispanic
- 1522.1%Two or more races
- 1331.9%American Indian alone
- 620.9%Asian alone
- 220.3%Black alone
- 120.2%Other race alone
- 20.03%Native Hawaiian and Other
Pacific Islander alone

-
- 5,30962.1%White alone
- 2,36627.7%Hispanic
- 3033.5%Two or more races
- 2002.3%Asian alone
- 881.0%American Indian alone
- 700.8%Black alone
- 390.5%Other race alone
- 200.2%Native Hawaiian and Other
Pacific Islander alone
2000
2022
-
- 1,303,00165.2%White alone
- 393,97019.7%Hispanic
- 131,5096.6%Black alone
- 88,5934.4%Asian alone
- 49,2312.5%Two or more races
- 21,3971.1%American Indian alone
- 7,7690.4%Native Hawaiian and Other
Pacific Islander alone - 2,7870.1%Other race alone

-
- 1,410,14544.4%White alone
- 961,35730.3%Hispanic
- 286,4719.0%Black alone
- 281,1498.8%Asian alone
- 182,1515.7%Two or more races
- 20,1020.6%Native Hawaiian and Other
Pacific Islander alone - 18,7810.6%Other race alone
- 17,6160.6%American Indian alone

Income and house value in Winnemucca
- Median household income in 2022
- $77,157White non-Hispanic householders
- $83,677Hispanic or Latino race householders
- Median 2022 house value
- $415,427White Non-Hispanic householders
- $146,048Black or African American householders
- $107,426American Indian or Alaska Native householders
- $312,543Some other race householders
- $509,871Two or more races householders
- $307,675Hispanic or Latino householders
Household income for White non-Hispanic householders

Household income for Black householders

Household income for American Indian and Alaska Native householders

Household income for Asian householders

Household income for Some other race householders

Household income for Two or more races householders

Household income for Hispanic or Latino race householders

Median age by race in Winnemucca
- 35.0Median age for White residents
- 35.1Males
- 35.0Females
- 84.3Median age for Black or African American residents
- 84.7Males
- -676,356,588.5Females
- 32.1Median age for American Indian / Alaska Native residents
- 31.4Males
- 42.1Females
- 36.1Median age for Asian residents
- 25.3Males
- 36.4Females
- -690,618,761.8Median age for Native Hawaiian / Pacific Islander residents
- -648,090,814.6Males
- -725,146,198.1Females
- 33.9Median age for Other race residents
- 38.1Males
- 30.2Females
- 41.3Median age for Two or more races residents
- 37.9Males
- 49.8Females
- 37.0Median age for White alone residents
- 36.1Males
- 39.5Females
- 31.1Median age for Hispanic or Latino residents
- 32.8Males
- 29.6Females
Owner/renter occupied households by race in Winnemucca
- House owners and renters - White residents
- 1,61063.8%Owner occupied
- 91336.2%Renter occupied
- House owners and renters - Black or African American residents
- 61100.0%Renter occupied
- House owners and renters - American Indian / Alaska Native residents
- 2341.1%Owner occupied
- 3358.9%Renter occupied
- House owners and renters - Asian residents
- 55100.0%Owner occupied
- House owners and renters - Other race residents
- 18045.2%Owner occupied
- 21954.8%Renter occupied
- House owners and renters - Two or more races residents
- 28245.4%Owner occupied
- 34054.6%Renter occupied
- House owners and renters - White alone residents
- 1,54861.2%Owner occupied
- 98038.8%Renter occupied
- House owners and renters - Hispanic or Latino residents
- 51159.3%Owner occupied
- 35140.7%Renter occupied
Language usage in Winnemucca
- English speakers - Total
- 85.7% of residents of Winnemucca speak English at home.
- 12.1% of residents speak Spanish at home
- 51252.5%Speak English very well
- 46447.5%Speak English less than very well
- 2.1% of residents speak other language at home
- 9858.7%Speak English very well
- 6941.3%Speak English less than very well
- English speakers - Born in the United States
- 94.0% of residents of Winnemucca speak English at home.
- 5.8% of residents speak Spanish at home
- 23899.6%Speak English very well
- 10.4%Speak English less than very well
- 0.1% of residents speak other language at home
- 6100.0%Speak English very well
- English speakers - Native, born elsewhere
- 66.7% of residents of Winnemucca speak English at home.
- 33.3% of residents speak Spanish at home
- 7100.0%Speak English less than very well
- English speakers - Foreign-born
- 14.7% of residents of Winnemucca speak English at home.
- 68.0% of residents speak Spanish at home
- 18129.4%Speak English very well
- 43470.6%Speak English less than very well
- 17.2% of residents speak other language at home
- 8856.4%Speak English very well
- 6843.6%Speak English less than very well
White (Caucasian) - Speak only English
| Native: | 100.0% (5,248) |
| Foreign-born: | 48.7% (64) |
White (Caucasian) - Speak another language
| Native: | 1.7% (90) |
| Foreign-born: | 56.6% (75) |
Black or African American - Speak only English
| Native: | 100.0% (52) |
| Foreign-born: | 97.6% (16) |
Other race - Speak only English
| Native: | 64.2% (386) |
| Foreign-born: | 19.2% (42) |
Other race - Speak another language
| Native: | 34.6% (208) |
| Foreign-born: | 80.8% (179) |
Two or more races - Speak another language
| Native: | 5.2% (42) |
| Foreign-born: | 100.0% (476) |
White alone - Speak only English
| Native: | 99.0% (4,903) |
| Foreign-born: | 98.2% (71) |
Hispanic or Latino - Speak only English
| Native: | 80.5% (1,241) |
| Foreign-born: | 5.8% (38) |
Hispanic or Latino - Speak another language
| Native: | 20.3% (313) |
| Foreign-born: | 94.2% (618) |
Foreign-born residents in Winnemucca
905 residents are foreign born (7.4% Latin America, 1.9% Asia).
| This city: | 10.6% |
| Nevada: | 19.1% |


Marital status for residents in Winnemucca
Marital status - White (Caucasian) population 15 years and over
- Males
- 27.4%Never married
- 61.9%Now married
- 0.1%Separated
- 1.0%Widowed
- 9.7%Divorced
- Females
- 19.9%Never married
- 58.1%Now married
- 0.0%Separated
- 7.7%Widowed
- 14.4%Divorced
Women who gave birth in the past 12 months
| Now married: | 100.0% (89) |
| Unmarried: | 0.0% (0) |
Women who did not give birth in the past 12 months
| Now married: | 51.8% (544) |
| Unmarried: | 48.2% (505) |
Marital status - Black or African American population 15 years and over
- Males
- 95.7%Never married
- 4.3%Now married
- 0.0%Separated
- 0.0%Widowed
- 0.0%Divorced
- Females
- 90.9%Never married
- 9.1%Now married
- 0.0%Separated
- 0.0%Widowed
- 0.0%Divorced
Women who did not give birth in the past 12 months
| Now married: | 0.0% (0) |
| Unmarried: | 100.0% (21) |
Marital status - American Indian / Alaska Native population 15 years and over
- Males
- 8.9%Never married
- 41.1%Now married
- 0.0%Separated
- 0.0%Widowed
- 50.0%Divorced
- Females
- 51.2%Never married
- 34.1%Now married
- 0.0%Separated
- 0.0%Widowed
- 14.6%Divorced
Women who did not give birth in the past 12 months
| Now married: | 45.2% (17) |
| Unmarried: | 54.8% (20) |
Marital status - Asian population 15 years and over
- Males
- 56.4%Never married
- 43.6%Now married
- 0.0%Separated
- 0.0%Widowed
- 0.0%Divorced
- Females
- 0.0%Never married
- 100.0%Now married
- 0.0%Separated
- 0.0%Widowed
- 0.0%Divorced
Women who did not give birth in the past 12 months
| Now married: | 100.0% (52) |
| Unmarried: | 0.0% (0) |
Marital status - Other race population 15 years and over
- Males
- 24.4%Never married
- 52.1%Now married
- 0.0%Separated
- 1.6%Widowed
- 21.9%Divorced
- Females
- 7.8%Never married
- 79.3%Now married
- 0.0%Separated
- 0.0%Widowed
- 13.0%Divorced
Women who gave birth in the past 12 months
| Now married: | 100.0% (42) |
| Unmarried: | 0.0% (0) |
Women who did not give birth in the past 12 months
| Now married: | 83.7% (83) |
| Unmarried: | 16.3% (16) |
Marital status - Two or more races population 15 years and over
- Males
- 39.3%Never married
- 48.2%Now married
- 7.2%Separated
- 0.0%Widowed
- 5.3%Divorced
- Females
- 62.5%Never married
- 27.6%Now married
- 0.0%Separated
- 2.1%Widowed
- 7.8%Divorced
Women who did not give birth in the past 12 months
| Now married: | 24.2% (85) |
| Unmarried: | 75.8% (268) |
Marital status - White alone, not Hispanic / Latino population 15 years and over
- Males
- 26.6%Never married
- 61.7%Now married
- 0.1%Separated
- 1.1%Widowed
- 10.4%Divorced
- Females
- 19.5%Never married
- 56.8%Now married
- 0.0%Separated
- 7.7%Widowed
- 16.0%Divorced
Women who gave birth in the past 12 months
| Now married: | 100.0% (81) |
| Unmarried: | 0.0% (0) |
Women who did not give birth in the past 12 months
| Now married: | 51.4% (535) |
| Unmarried: | 48.6% (506) |
Marital status - Hispanic or Latino population 15 years and over
- Males
- 33.1%Never married
- 52.4%Now married
- 2.8%Separated
- 0.8%Widowed
- 10.9%Divorced
- Females
- 29.2%Never married
- 59.4%Now married
- 0.0%Separated
- 2.5%Widowed
- 8.9%Divorced
Women who gave birth in the past 12 months
| Now married: | 100.0% (60) |
| Unmarried: | 0.0% (0) |
Women who did not give birth in the past 12 months
| Now married: | 56.4% (189) |
| Unmarried: | 43.6% (146) |
Ancestries in Winnemucca

- 74417.6%German
- 51612.2%English
- 3347.9%American
- 2846.7%Scottish
- 2044.8%Irish
- 1924.6%European
- 1002.4%Norwegian
- 982.3%Basque
- 952.3%Italian
- 340.8%French Canadian
- 300.7%Ghanaian
- 160.4%Polish
- 150.4%Danish
- 140.3%Hungarian
- 90.2%British
- 90.2%Canadian
- 80.2%Scandinavian
- 70.2%Dutch
- 40.09%Egyptian

Geographical mobility in Winnemucca

- Same house 1 year ago
- 4,77686.3%White (Caucasian)
- 6592.1%Black or African American
- 164100.0%American Indian / Alaska Native
- 208100.0%Asian
- 1747.0%Native Hawaiian / Pacific Islander
- 62272.5%Other race
- 1,21995.8%Two or more races
- 4,39084.1%White alone, not Hispanic / Latino
- 2,10089.8%Hispanic or Latino

-
- Moved within same county
- 3857.0%White / Caucasian
- 1335.6%Native Hawaiian / Pacific Islander
- 273.2%Other race
- 4298.2%White alone, not Hispanic / Latino
- 291.3%Hispanic or Latino

-
- Moved within same state
- 1582.8%White / Caucasian
- 79.7%Black or African American
- 1633.1%White alone, not Hispanic / Latino

-
- Moved from different state
- 2234.0%White / Caucasian
- 13015.1%Other race
- 383.0%Two or more races
- 2224.3%White alone, not Hispanic / Latino
- 1958.3%Hispanic or Latino

-
- Moved from abroad
- 120.2%White
- 453.5%Two or more races
- 150.3%White alone, not Hispanic / Latino
- 130.6%Hispanic or Latino

Children Nativity (place of birth) in Winnemucca
Place of birth for residents in Winnemucca
![Place of birth for the foreign-born population - Regions]()
- 684Americas
- 630Latin America
- 630Central America
- 158Asia
- 158South Eastern Asia
- 54Northern America
- 38Africa
- 23Europe
- 20Western Africa
- 19Southern Europe
- 13Southern Africa
- 5Northern Africa
- 4Western Europe

![Place of birth for the foreign-born population - Countries]()
- 630Mexico
- 158Philippines
- 54Canada
- 20Ghana
- 19Spain
- 13South Africa
- 5Egypt
- 4Germany

Grandparents responsible for own grandchildren in Winnemucca
Zip codes: 89445.