Races in Winchester, Virginia (VA) Detailed Stats
Data:
Races - White alone (%)
Races - White alone (% change since 2000)
Races - Black alone (%)
Races - Black alone (% change since 2000)
Races - American Indian alone (%)
Races - American Indian alone (% change since 2000)
Races - Asian alone (%)
Races - Asian alone (% change since 2000)
Races - Hispanic (%)
Races - Hispanic (% change since 2000)
Races - Native Hawaiian and Other Pacific Islander alone (%)
Races - Native Hawaiian and Other Pacific Islander alone (% change since 2000)
Races - Two or more races(%)
Races - Two or more races(% change since 2000)
Races - Other race alone (%)
Races - Other race alone (% change since 2000)
Racial diversity
Place of birth - Born in state of residence (%)
Place of birth - Born in state of residence (%) - White
Place of birth - Born in state of residence (%) - Black or African American
Place of birth - Born in state of residence (%) - Asian
Place of birth - Born in state of residence (%) - Hispanic or Latino
Place of birth - Born in state of residence (%) - American Indian and Alaska Native
Place of birth - Born in state of residence (%) - Multirace
Place of birth - Born in state of residence (%) - Other Race
Place of birth - Born in other state (%)
Place of birth - Born in other state (%) - White
Place of birth - Born in other state (%) - Black or African American
Place of birth - Born in other state (%) - Asian
Place of birth - Born in other state (%) - Hispanic or Latino
Place of birth - Born in other state (%) - American Indian and Alaska Native
Place of birth - Born in other state (%) - Multirace
Place of birth - Born in other state (%) - Other Race
Place of birth - Native, outside of US (%)
Place of birth - Native, outside of US (%) - White
Place of birth - Native, outside of US (%) - Black or African American
Place of birth - Native, outside of US (%) - Asian
Place of birth - Native, outside of US (%) - Hispanic or Latino
Place of birth - Native, outside of US (%) - American Indian and Alaska Native
Place of birth - Native, outside of US (%) - Multirace
Place of birth - Native, outside of US (%) - Other Race
Place of birth - Foreign born (%)
Place of birth - Foreign born (%) - White
Place of birth - Foreign born (%) - Black or African American
Place of birth - Foreign born (%) - Asian
Place of birth - Foreign born (%) - Hispanic or Latino
Place of birth - Foreign born (%) - American Indian and Alaska Native
Place of birth - Foreign born (%) - Multirace
Place of birth - Foreign born (%) - Other Race
Residents speaking English at home (%)
Residents speaking English at home - Born in the United States (%)
Residents speaking English at home - Native, born elsewhere (%)
Residents speaking English at home - Foreign born (%)
Residents speaking Spanish at home (%)
Residents speaking Spanish at home - Born in the United States (%)
Residents speaking Spanish at home - Native, born elsewhere (%)
Residents speaking Spanish at home - Foreign born (%)
Residents speaking other language at home (%)
Residents speaking other language at home - Born in the United States (%)
Residents speaking other language at home - Native, born elsewhere (%)
Residents speaking other language at home - Foreign born (%)
Marital status - Never married (%)
Marital status - Now married (%)
Marital status - Separated (%)
Marital status - Widowed (%)
Marital status - Divorced (%)
Ancestries Reported - Arab (%)
Ancestries Reported - Czech (%)
Ancestries Reported - Danish (%)
Ancestries Reported - Dutch (%)
Ancestries Reported - English (%)
Ancestries Reported - French (%)
Ancestries Reported - French Canadian (%)
Ancestries Reported - German (%)
Ancestries Reported - Greek (%)
Ancestries Reported - Hungarian (%)
Ancestries Reported - Irish (%)
Ancestries Reported - Italian (%)
Ancestries Reported - Lithuanian (%)
Ancestries Reported - Norwegian (%)
Ancestries Reported - Polish (%)
Ancestries Reported - Portuguese (%)
Ancestries Reported - Russian (%)
Ancestries Reported - Scotch-Irish (%)
Ancestries Reported - Scottish (%)
Ancestries Reported - Slovak (%)
Ancestries Reported - Subsaharan African (%)
Ancestries Reported - Swedish (%)
Ancestries Reported - Swiss (%)
Ancestries Reported - Ukrainian (%)
Ancestries Reported - United States (%)
Ancestries Reported - Welsh (%)
Ancestries Reported - West Indian (%)
Ancestries Reported - Other (%)
Geographical mobility - Same house 1 year ago (%)
Geographical mobility - Same house 1 year ago (%) - White
Geographical mobility - Same house 1 year ago (%) - Black or African American
Geographical mobility - Same house 1 year ago (%) - Asian
Geographical mobility - Same house 1 year ago (%) - Hispanic or Latino
Geographical mobility - Same house 1 year ago (%) - American Indian and Alaska Native
Geographical mobility - Same house 1 year ago (%) - Multirace
Geographical mobility - Same house 1 year ago (%) - Other Race
Geographical mobility - Moved within same county (%)
Geographical mobility - Moved within same county (%) - White
Geographical mobility - Moved within same county (%) - Black or African American
Geographical mobility - Moved within same county (%) - Asian
Geographical mobility - Moved within same county (%) - Hispanic or Latino
Geographical mobility - Moved within same county (%) - American Indian and Alaska Native
Geographical mobility - Moved within same county (%) - Multirace
Geographical mobility - Moved within same county (%) - Other Race
Geographical mobility - Moved from different county within same state (%)
Geographical mobility - Moved from different county within same state (%) - White
Geographical mobility - Moved from different county within same state (%) - Black or African American
Geographical mobility - Moved from different county within same state (%) - Asian
Geographical mobility - Moved from different county within same state (%) - Hispanic or Latino
Geographical mobility - Moved from different county within same state (%) - American Indian and Alaska Native
Geographical mobility - Moved from different county within same state (%) - Multirace
Geographical mobility - Moved from different county within same state (%) - Other Race
Geographical mobility - Moved from different state (%)
Geographical mobility - Moved from different state (%) - White
Geographical mobility - Moved from different state (%) - Black or African American
Geographical mobility - Moved from different state (%) - Asian
Geographical mobility - Moved from different state (%) - Hispanic or Latino
Geographical mobility - Moved from different state (%) - American Indian and Alaska Native
Geographical mobility - Moved from different state (%) - Multirace
Geographical mobility - Moved from different state (%) - Other Race
Geographical mobility - Moved from abroad (%)
Geographical mobility - Moved from abroad (%) - White
Geographical mobility - Moved from abroad (%) - Black or African American
Geographical mobility - Moved from abroad (%) - Asian
Geographical mobility - Moved from abroad (%) - Hispanic or Latino
Geographical mobility - Moved from abroad (%) - American Indian and Alaska Native
Geographical mobility - Moved from abroad (%) - Multirace
Geographical mobility - Moved from abroad (%) - Other Race
Place of birth for the foreign-born population - Ireland (%)
Place of birth for the foreign-born population - Denmark (%)
Place of birth for the foreign-born population - Norway (%)
Place of birth for the foreign-born population - Sweden (%)
Place of birth for the foreign-born population - United Kingdom (%)
Place of birth for the foreign-born population - England (%)
Place of birth for the foreign-born population - Scotland (%)
Place of birth for the foreign-born population - Other Northern Europe (%)
Place of birth for the foreign-born population - Austria (%)
Place of birth for the foreign-born population - Belgium (%)
Place of birth for the foreign-born population - France (%)
Place of birth for the foreign-born population - Germany (%)
Place of birth for the foreign-born population - Netherlands (%)
Place of birth for the foreign-born population - Switzerland (%)
Place of birth for the foreign-born population - Other Western Europe (%)
Place of birth for the foreign-born population - Greece (%)
Place of birth for the foreign-born population - Italy (%)
Place of birth for the foreign-born population - Portugal (%)
Place of birth for the foreign-born population - Spain (%)
Place of birth for the foreign-born population - Other Southern Europe (%)
Place of birth for the foreign-born population - Albania (%)
Place of birth for the foreign-born population - Belarus (%)
Place of birth for the foreign-born population - Bosnia and Herzegovina (%)
Place of birth for the foreign-born population - Bulgaria (%)
Place of birth for the foreign-born population - Croatia (%)
Place of birth for the foreign-born population - Czechoslovakia (%)
Place of birth for the foreign-born population - Hungary (%)
Place of birth for the foreign-born population - Latvia (%)
Place of birth for the foreign-born population - Lithuania (%)
Place of birth for the foreign-born population - North Macedonia (Macedonia) (%)
Place of birth for the foreign-born population - Moldova (%)
Place of birth for the foreign-born population - Poland (%)
Place of birth for the foreign-born population - Romania (%)
Place of birth for the foreign-born population - Russia (%)
Place of birth for the foreign-born population - Serbia (%)
Place of birth for the foreign-born population - Ukraine (%)
Place of birth for the foreign-born population - Other Eastern Europe (%)
Place of birth for the foreign-born population - China (%)
Place of birth for the foreign-born population - Hong Kong (%)
Place of birth for the foreign-born population - Taiwan (%)
Place of birth for the foreign-born population - Japan (%)
Place of birth for the foreign-born population - Korea (%)
Place of birth for the foreign-born population - Other Eastern Asia (%)
Place of birth for the foreign-born population - Afghanistan (%)
Place of birth for the foreign-born population - Bangladesh (%)
Place of birth for the foreign-born population - India (%)
Place of birth for the foreign-born population - Iran (%)
Place of birth for the foreign-born population - Kazakhstan (%)
Place of birth for the foreign-born population - Nepal (%)
Place of birth for the foreign-born population - Pakistan (%)
Place of birth for the foreign-born population - Sri Lanka (%)
Place of birth for the foreign-born population - Uzbekistan (%)
Place of birth for the foreign-born population - Other South Central Asia (%)
Place of birth for the foreign-born population - Burma (%)
Place of birth for the foreign-born population - Cambodia (%)
Place of birth for the foreign-born population - Indonesia (%)
Place of birth for the foreign-born population - Laos (%)
Place of birth for the foreign-born population - Malaysia (%)
Place of birth for the foreign-born population - Philippines (%)
Place of birth for the foreign-born population - Singapore (%)
Place of birth for the foreign-born population - Thailand (%)
Place of birth for the foreign-born population - Vietnam (%)
Place of birth for the foreign-born population - Other South Eastern Asia (%)
Place of birth for the foreign-born population - Armenia (%)
Place of birth for the foreign-born population - Iraq (%)
Place of birth for the foreign-born population - Israel (%)
Place of birth for the foreign-born population - Jordan (%)
Place of birth for the foreign-born population - Kuwait (%)
Place of birth for the foreign-born population - Lebanon (%)
Place of birth for the foreign-born population - Saudi Arabia (%)
Place of birth for the foreign-born population - Syria (%)
Place of birth for the foreign-born population - Turkey (%)
Place of birth for the foreign-born population - Yemen (%)
Place of birth for the foreign-born population - Other Western Asia (%)
Place of birth for the foreign-born population - Eritrea (%)
Place of birth for the foreign-born population - Ethiopia (%)
Place of birth for the foreign-born population - Kenya (%)
Place of birth for the foreign-born population - Somalia (%)
Place of birth for the foreign-born population - Uganda (%)
Place of birth for the foreign-born population - Zimbabwe (%)
Place of birth for the foreign-born population - Other Eastern Africa (%)
Place of birth for the foreign-born population - Cameroon (%)
Place of birth for the foreign-born population - Congo (%)
Place of birth for the foreign-born population - Democratic Republic of Congo (Zaire) (%)
Place of birth for the foreign-born population - Other Middle Africa (%)
Place of birth for the foreign-born population - Egypt (%)
Place of birth for the foreign-born population - Morocco (%)
Place of birth for the foreign-born population - Sudan (%)
Place of birth for the foreign-born population - Other Northern Africa (%)
Place of birth for the foreign-born population - South Africa (%)
Place of birth for the foreign-born population - Other Southern Africa (%)
Place of birth for the foreign-born population - Cabo Verde (%)
Place of birth for the foreign-born population - Ghana (%)
Place of birth for the foreign-born population - Liberia (%)
Place of birth for the foreign-born population - Nigeria (%)
Place of birth for the foreign-born population - Senegal (%)
Place of birth for the foreign-born population - Sierra Leone (%)
Place of birth for the foreign-born population - Other Western Africa (%)
Place of birth for the foreign-born population - Australia (%)
Place of birth for the foreign-born population - New Zealand (%)
Place of birth for the foreign-born population - Fiji (%)
Place of birth for the foreign-born population - Micronesia (%)
Place of birth for the foreign-born population - Bahamas (%)
Place of birth for the foreign-born population - Barbados (%)
Place of birth for the foreign-born population - Cuba (%)
Place of birth for the foreign-born population - Dominica (%)
Place of birth for the foreign-born population - Dominican Republic (%)
Place of birth for the foreign-born population - Grenada (%)
Place of birth for the foreign-born population - Haiti (%)
Place of birth for the foreign-born population - Jamaica (%)
Place of birth for the foreign-born population - St. Vincent and the Grenadines (%)
Place of birth for the foreign-born population - Trinidad and Tobago (%)
Place of birth for the foreign-born population - West Indies (%)
Place of birth for the foreign-born population - Other Caribbean (%)
Place of birth for the foreign-born population - Belize (%)
Place of birth for the foreign-born population - Costa Rica (%)
Place of birth for the foreign-born population - El Salvador (%)
Place of birth for the foreign-born population - Guatemala (%)
Place of birth for the foreign-born population - Honduras (%)
Place of birth for the foreign-born population - Mexico (%)
Place of birth for the foreign-born population - Nicaragua (%)
Place of birth for the foreign-born population - Panama (%)
Place of birth for the foreign-born population - Other Central America (%)
Place of birth for the foreign-born population - Argentina (%)
Place of birth for the foreign-born population - Bolivia (%)
Place of birth for the foreign-born population - Brazil (%)
Place of birth for the foreign-born population - Chile (%)
Place of birth for the foreign-born population - Colombia (%)
Place of birth for the foreign-born population - Ecuador (%)
Place of birth for the foreign-born population - Guyana (%)
Place of birth for the foreign-born population - Peru (%)
Place of birth for the foreign-born population - Uruguay (%)
Place of birth for the foreign-born population - Venezuela (%)
Place of birth for the foreign-born population - Other South America (%)
Place of birth for the foreign-born population - Canada (%)
Place of birth for the foreign-born population - Other Northern America (%)
Place of birth for the foreign-born population - Other (%)
Latest news about races in Winchester, VA collected exclusively by city-data.com from local newspapers, TV, and radio stations
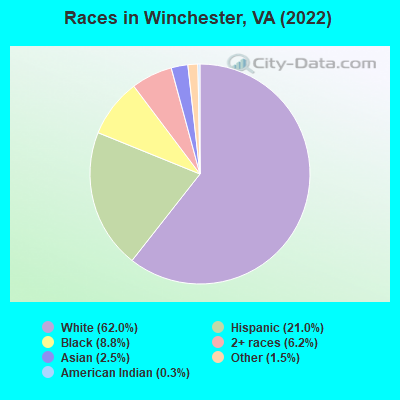
According to 2022 data, the most numerous races in Winchester, VA are White alone (17,996 residents), Black alone (2,564 residents), and Hispanic (6,108 residents). 81.0% of Winchester residents speak English at home. 11.9% of Winchester, VA residents are foreign-born (9.5% born in Latin America, 1.4% born in Asia), which is about the same as the foreign-born rate of 12.0% across the entire state of Virginia.
Race distribution in Winchester
2000 2022
4,965,637 70.2% White alone 1,376,378 19.4% Black alone 329,540 4.7% Hispanic 259,277 3.7% Asian alone 114,022 1.6% Two or more races 18,596 0.3% American Indian alone 11,685 0.2% Other race alone 3,380 0.05% Native Hawaiian and Other
5,095,130 58.7% White alone 1,594,785 18.4% Black alone 905,750 10.4% Hispanic 602,881 6.9% Asian alone 406,047 4.7% Two or more races 60,419 0.7% Other race alone 11,738 0.1% American Indian alone 6,869 0.08% Native Hawaiian and Other
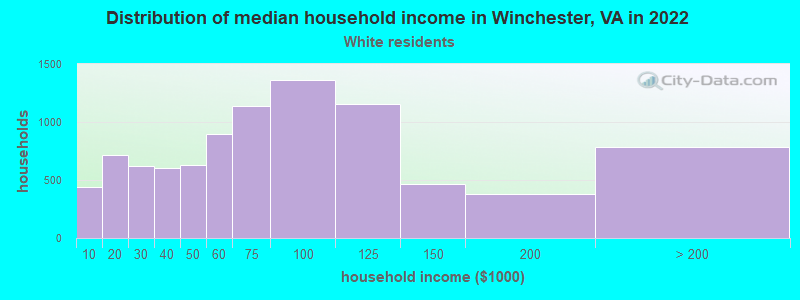
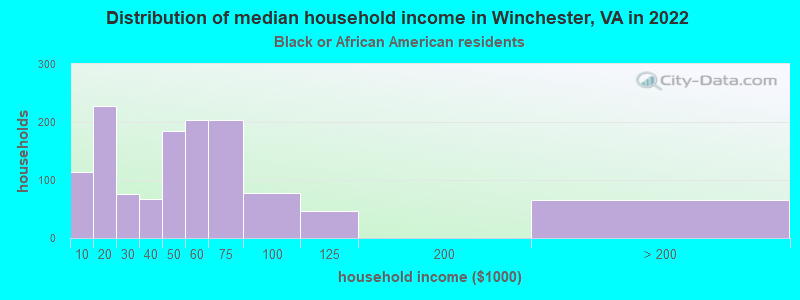
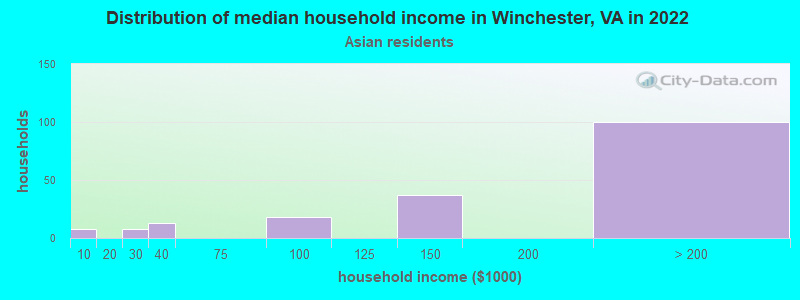
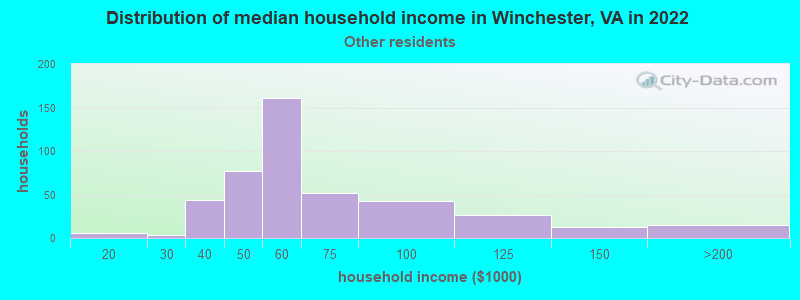
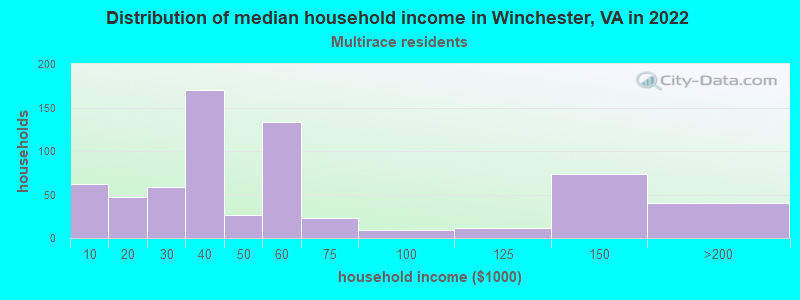
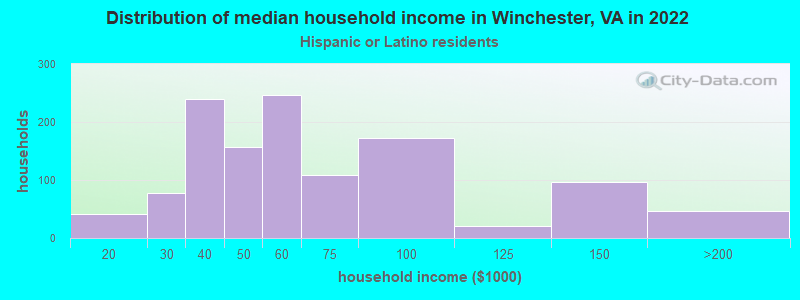
Income and house value in Winchester Median household income in 2022 $67,957 White non-Hispanic householders$49,582 Black householdersover $200,000 Asian householders$126,151 Some other race householders$51,165 Two or more races householders$130,497 Hispanic or Latino race householdersMedian 2022 house value $337,370 White Non-Hispanic householders$241,621 Black or African American householders $349,376 Asian householders$285,143 Some other race householders$227,214 Two or more races householders$316,359 Hispanic or Latino householders
Median age by race in Winchester
40.8 Median age for White residents37.4 46.1 37.9 Median age for Black or African American residents39.8 36.5 17.9 Median age for American Indian / Alaska Native residents30.1 17.3 31.1 Median age for Asian residents27.2 30.4 -611,955,419.9 Median age for Native Hawaiian / Pacific Islander residents-541,531,822.5 -714,150,046.8 37.8 Median age for Other race residents50.1 16.7 31.1 Median age for Two or more races residents19.1 42.6 44.1 Median age for White alone residents39.8 47.2 22.4 Median age for Hispanic or Latino residents19.2 28.2
Owner/renter occupied households by race in Winchester
House owners and renters - White residents 4,578 55.5% Owner occupied3,668 44.5% Renter occupiedHouse owners and renters - Black or African American residents 201 18.6% Owner occupied881 81.4% Renter occupiedHouse owners and renters - American Indian / Alaska Native residents 10 100.0% Owner occupiedHouse owners and renters - Asian residents 131 71.1% Owner occupied53 28.9% Renter occupiedHouse owners and renters - Other race residents 100 18.4% Owner occupied443 81.6% Renter occupiedHouse owners and renters - Two or more races residents 386 44.8% Owner occupied476 55.2% Renter occupiedHouse owners and renters - White alone residents 4,554 58.4% Owner occupied3,242 41.6% Renter occupiedHouse owners and renters - Hispanic or Latino residents 589 52.4% Owner occupied535 47.6% Renter occupied
Language usage in Winchester
English speakers - Total 81.0% of residents of Winchester speak English at home.
14.0% of residents speak Spanish at home 2,600 67.1% Speak English very well1,275 32.9% Speak English less than very well3.3% of residents speak other language at home 634 68.6% Speak English very well290 31.4% Speak English less than very well
English speakers - Born in the United States 91.0% of residents of Winchester speak English at home.
6.4% of residents speak Spanish at home 512 77.0% Speak English very well153 23.0% Speak English less than very well2.7% of residents speak other language at home 243 85.9% Speak English very well40 14.1% Speak English less than very well
English speakers - Native, born elsewhere 40.4% of residents of Winchester speak English at home.
44.2% of residents speak Spanish at home 154 83.7% Speak English very well30 16.3% Speak English less than very well32.0% of residents speak other language at home 133 100.0% Speak English less than very well
English speakers - Foreign-born 14.1% of residents of Winchester speak English at home.
68.1% of residents speak Spanish at home 1,134 50.6% Speak English very well1,108 49.4% Speak English less than very well12.8% of residents speak other language at home 195 46.1% Speak English very well228 53.9% Speak English less than very well
White (Caucasian) - Speak only English Native:
94.7% (17,305)Foreign-born:
5.1% (44)
White (Caucasian) - Speak another language Native:
5.5% (1,008)Foreign-born:
88.6% (774)
Black or African American - Speak only English Native:
91.0% (2,063)Foreign-born:
40.9% (180)
Black or African American - Speak another language Native:
9.5% (215)Foreign-born:
56.5% (250)
American Indian / Alaska Native - Speak another language Native:
85.3% (36)Foreign-born:
100.0% (33)
Asian - Speak only English Native:
71.6% (279)Foreign-born:
57.1% (235)
Asian - Speak another language Native:
31.8% (124)Foreign-born:
48.4% (199)
Other race - Speak only English Native:
45.6% (495)Foreign-born:
0.6% (9)
Other race - Speak another language Native:
89.5% (971)Foreign-born:
100.0% (1,494)
Two or more races - Speak only English Native:
86.2% (1,544)Foreign-born:
9.3% (96)
Two or more races - Speak another language Native:
12.7% (228)Foreign-born:
90.8% (935)
White alone - Speak only English Native:
99.0% (17,017)Foreign-born:
24.8% (45)
White alone - Speak another language Native:
0.7% (117)Foreign-born:
62.2% (113)
Hispanic or Latino - Speak only English Native:
22.3% (854)Foreign-born:
0.3% (7)
Hispanic or Latino - Speak another language Native:
47.4% (1,815)Foreign-born:
100.0% (2,160)
Foreign-born residents in Winchester 3,469 residents are foreign born (9.5% Latin America , 1.4% Asia ).
This city:
11.9%Virginia:
12.6%
Marital status for residents in Winchester Marital status - White (Caucasian) population 15 years and over
Males 42.9% Never married41.8% Now married1.7% Separated1.8% Widowed11.7% DivorcedFemales 29.3% Never married40.6% Now married2.1% Separated10.7% Widowed17.2% DivorcedWomen who gave birth in the past 12 months Now married:
89.3% (230)Unmarried:
10.7% (28)
Women who did not give birth in the past 12 months Now married:
36.8% (1,492)Unmarried:
63.2% (2,565)
Marital status - Black or African American population 15 years and over
Males 64.6% Never married23.9% Now married0.5% Separated0.2% Widowed10.8% DivorcedFemales 59.2% Never married15.6% Now married4.2% Separated3.2% Widowed17.9% DivorcedWomen who gave birth in the past 12 months Now married:
21.1% (8)Unmarried:
78.9% (30)
Women who did not give birth in the past 12 months Now married:
22.4% (162)Unmarried:
77.6% (561)
Marital status - American Indian / Alaska Native population 15 years and over
Males 40.6% Never married59.4% Now married0.0% Separated0.0% Widowed0.0% DivorcedFemales 30.8% Never married69.2% Now married0.0% Separated0.0% Widowed0.0% DivorcedWomen who did not give birth in the past 12 months Now married:
69.2% (10)Unmarried:
30.8% (4)
Marital status - Asian population 15 years and over
Males 47.4% Never married52.6% Now married0.0% Separated0.0% Widowed0.0% DivorcedFemales 8.7% Never married78.3% Now married0.0% Separated9.1% Widowed4.0% DivorcedWomen who did not give birth in the past 12 months Now married:
84.2% (160)Unmarried:
15.8% (30)
Marital status - Other race population 15 years and over
Males 16.1% Never married75.9% Now married7.6% Separated0.0% Widowed0.4% DivorcedFemales 42.8% Never married31.3% Now married18.9% Separated6.0% Widowed1.0% DivorcedWomen who gave birth in the past 12 months Now married:
100.0% (18)Unmarried:
0.0% (0)
Women who did not give birth in the past 12 months Now married:
48.8% (270)Unmarried:
51.2% (283)
Marital status - Two or more races population 15 years and over
Males 60.1% Never married33.3% Now married0.0% Separated0.0% Widowed6.6% DivorcedFemales 55.9% Never married33.1% Now married0.0% Separated3.7% Widowed7.3% DivorcedWomen who gave birth in the past 12 months Now married:
100.0% (10)Unmarried:
0.0% (0)
Women who did not give birth in the past 12 months Now married:
32.8% (278)Unmarried:
67.2% (568)
Marital status - White alone, not Hispanic / Latino population 15 years and over
Males 40.6% Never married43.5% Now married1.4% Separated2.0% Widowed12.4% DivorcedFemales 27.7% Never married40.4% Now married2.3% Separated11.3% Widowed18.2% DivorcedWomen who gave birth in the past 12 months Now married:
89.3% (240)Unmarried:
10.7% (29)
Women who did not give birth in the past 12 months Now married:
35.6% (1,313)Unmarried:
64.4% (2,376)
Marital status - Hispanic or Latino population 15 years and over
Males 43.7% Never married48.3% Now married5.0% Separated0.0% Widowed3.0% DivorcedFemales 42.6% Never married41.2% Now married5.9% Separated5.4% Widowed4.8% DivorcedWomen who gave birth in the past 12 months Now married:
100.0% (22)Unmarried:
0.0% (0)
Women who did not give birth in the past 12 months Now married:
49.0% (682)Unmarried:
51.0% (710)
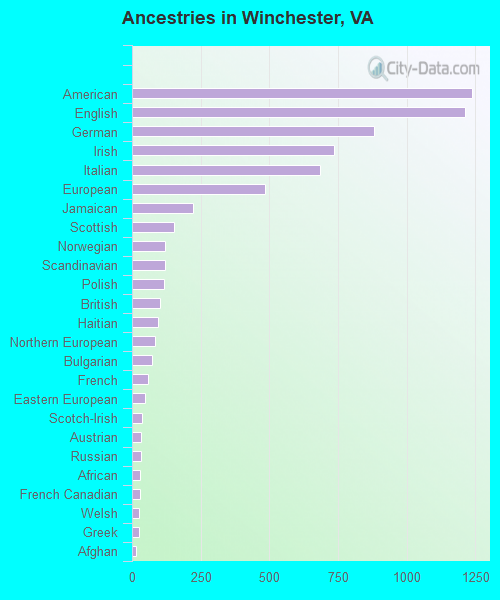
Ancestries in Winchester
1,238 11.0% American1,211 10.7% English880 7.8% German737 6.5% Irish685 6.1% Italian485 4.3% European222 2.0% Jamaican153 1.4% Scottish120 1.1% Norwegian119 1.1% Scandinavian115 1.0% Polish101 0.9% British93 0.8% Haitian82 0.7% Northern European73 0.6% Bulgarian60 0.5% French49 0.4% Eastern European37 0.3% Scotch-Irish34 0.3% Austrian34 0.3% Russian29 0.3% African28 0.2% French Canadian27 0.2% Welsh25 0.2% Greek16 0.1% Afghan15 0.1% Israeli14 0.1% Lithuanian14 0.1% Slovak12 0.1% Dutch12 0.1% Finnish9 0.08% Hungarian9 0.08% Turkish7 0.06% Egyptian6 0.05% Swedish5 0.04% Ukrainian4 0.04% Portuguese
Geographical mobility in Winchester Same house 1 year ago 17,038 88.2% White (Caucasian)2,076 81.7% Black or African American72 80.7% American Indian / Alaska Native443 72.6% Asian1,845 86.6% Other race2,667 85.8% Two or more races15,319 86.6% White alone, not Hispanic / Latino4,712 87.6% Hispanic or LatinoMoved within same county 490 2.5% White / Caucasian117 4.6% Black or African American2 0.1% Other race71 2.3% Two or more races476 2.7% White alone, not Hispanic / Latino64 1.2% Hispanic or LatinoMoved within same state 1,084 5.6% White / Caucasian251 9.9% Black or African American16 2.7% Asian303 14.2% Other race354 11.4% Two or more races1,228 6.9% White alone, not Hispanic / Latino556 10.3% Hispanic or LatinoMoved from different state 709 3.7% White / Caucasian98 3.8% Black or African American13 14.5% American Indian / Alaska Native18 0.9% Other race27 0.9% Two or more races698 3.9% White alone, not Hispanic / Latino74 1.4% Hispanic or LatinoMoved from abroad 12 0.1% White206 33.7% Asian12 0.1% White alone, not Hispanic / Latino
Children Nativity (place of birth) in Winchester
Children under 6 years - Living with two parents Both parents native 688 100.0% Native0 0.0% Foreign-bornBoth parents foreign-born 142 87.8% Native20 12.2% Foreign-bornOne native, one foreign-born parent 197 100.0% NativeChildren under 6 years - Living with one parent Native parent 752 100.0% NativeForeign-born parent 152 100.0% NativeChildren 6 to 17 years - Living with two parents Both parents native 969 100.0% NativeBoth parents foreign-born 509 70.8% Native210 29.2% Foreign-bornOne native, one foreign-born parent 193 100.0% NativeChildren 6 to 17 years - Living with one parent Native parent 1,272 100.0% NativeForeign-born parent 688 54.7% Native569 45.3% Foreign-born
Grandparents responsible for own grandchildren in Winchester
Grandparents (30 to 59 years) White / Caucasian 106 32.9% Responsible for grandchildren217 67.1% Not responsible for grandchildrenBlack or African American 15 100.0% Responsible for grandchildrenWhite alone, not Hispanic / Latino 108 32.2% Responsible for grandchildren227 67.8% Not responsible for grandchildrenHispanic or Latino 9 100.0% Not responsible for grandchildrenGrandparents (60 years and over) White / Caucasian 7 4.4% Responsible for grandchildren152 95.6% Not responsible for grandchildrenBlack or African American 76 100.0% Responsible for grandchildrenWhite alone, not Hispanic / Latino 7 6.8% Responsible for grandchildren97 93.2% Not responsible for grandchildrenHispanic or Latino 102 100.0% Not responsible for grandchildren