Races in Wimauma-Lithia, Florida (FL) Detailed Stats
Ancestries, Foreign-born residents, place of birth
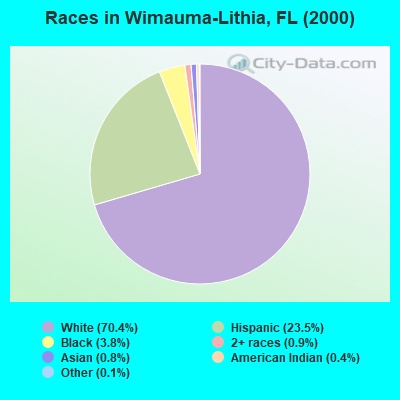
Race distribution in Wimauma-Lithia

- 21,44770.4%White alone
- 7,14723.5%Hispanic
- 1,1723.8%Black alone
- 2640.9%Two or more races
- 2520.8%Asian alone
- 1350.4%American Indian alone
- 420.1%Other race alone
- 100.03%Native Hawaiian and Other
Pacific Islander alone
2000
2022
-
- 10,458,50965.4%White alone
- 2,682,71516.8%Hispanic
- 2,264,26814.2%Black alone
- 261,6931.6%Asian alone
- 236,9541.5%Two or more races
- 42,3580.3%American Indian alone
- 28,9940.2%Other race alone
- 6,8870.04%Native Hawaiian and Other
Pacific Islander alone

-
- 11,309,40350.8%White alone
- 6,025,03927.1%Hispanic
- 3,241,01514.6%Black alone
- 861,6303.9%Two or more races
- 623,6922.8%Asian alone
- 152,0540.7%Other race alone
- 22,5040.1%American Indian alone
- 9,4860.04%Native Hawaiian and Other
Pacific Islander alone

Income and house value in Wimauma-Lithia
- Median household income in 2022
- $87,354White non-Hispanic householders
- $90,693Black householders
- $65,588American Indian and Alaska Native householders
- $67,243Asian householders
- $67,298Some other race householders
- $87,242Two or more races householders
- $75,911Hispanic or Latino race householders
- Median 2022 house value
- $474,012White Non-Hispanic householders
- $513,580Black or African American householders
- $431,247American Indian or Alaska Native householders
- $594,713Asian householders
- $339,722Some other race householders
- $417,258Two or more races householders
- $436,043Hispanic or Latino householders
Household income for White non-Hispanic householders

Household income for Black householders

Household income for American Indian and Alaska Native householders

Household income for Asian householders

Household income for Two or more races householders

Household income for Hispanic or Latino race householders

Zip code: 33547