Races in Wimauma, Florida (FL) Detailed Stats
Data:
Races - White alone (%)
Races - White alone (% change since 2000)
Races - Black alone (%)
Races - Black alone (% change since 2000)
Races - American Indian alone (%)
Races - American Indian alone (% change since 2000)
Races - Asian alone (%)
Races - Asian alone (% change since 2000)
Races - Hispanic (%)
Races - Hispanic (% change since 2000)
Races - Native Hawaiian and Other Pacific Islander alone (%)
Races - Native Hawaiian and Other Pacific Islander alone (% change since 2000)
Races - Two or more races(%)
Races - Two or more races(% change since 2000)
Races - Other race alone (%)
Races - Other race alone (% change since 2000)
Racial diversity
Place of birth - Born in state of residence (%)
Place of birth - Born in state of residence (%) - White
Place of birth - Born in state of residence (%) - Black or African American
Place of birth - Born in state of residence (%) - Asian
Place of birth - Born in state of residence (%) - Hispanic or Latino
Place of birth - Born in state of residence (%) - American Indian and Alaska Native
Place of birth - Born in state of residence (%) - Multirace
Place of birth - Born in state of residence (%) - Other Race
Place of birth - Born in other state (%)
Place of birth - Born in other state (%) - White
Place of birth - Born in other state (%) - Black or African American
Place of birth - Born in other state (%) - Asian
Place of birth - Born in other state (%) - Hispanic or Latino
Place of birth - Born in other state (%) - American Indian and Alaska Native
Place of birth - Born in other state (%) - Multirace
Place of birth - Born in other state (%) - Other Race
Place of birth - Native, outside of US (%)
Place of birth - Native, outside of US (%) - White
Place of birth - Native, outside of US (%) - Black or African American
Place of birth - Native, outside of US (%) - Asian
Place of birth - Native, outside of US (%) - Hispanic or Latino
Place of birth - Native, outside of US (%) - American Indian and Alaska Native
Place of birth - Native, outside of US (%) - Multirace
Place of birth - Native, outside of US (%) - Other Race
Place of birth - Foreign born (%)
Place of birth - Foreign born (%) - White
Place of birth - Foreign born (%) - Black or African American
Place of birth - Foreign born (%) - Asian
Place of birth - Foreign born (%) - Hispanic or Latino
Place of birth - Foreign born (%) - American Indian and Alaska Native
Place of birth - Foreign born (%) - Multirace
Place of birth - Foreign born (%) - Other Race
Residents speaking English at home (%)
Residents speaking English at home - Born in the United States (%)
Residents speaking English at home - Native, born elsewhere (%)
Residents speaking English at home - Foreign born (%)
Residents speaking Spanish at home (%)
Residents speaking Spanish at home - Born in the United States (%)
Residents speaking Spanish at home - Native, born elsewhere (%)
Residents speaking Spanish at home - Foreign born (%)
Residents speaking other language at home (%)
Residents speaking other language at home - Born in the United States (%)
Residents speaking other language at home - Native, born elsewhere (%)
Residents speaking other language at home - Foreign born (%)
Marital status - Never married (%)
Marital status - Now married (%)
Marital status - Separated (%)
Marital status - Widowed (%)
Marital status - Divorced (%)
Ancestries Reported - Arab (%)
Ancestries Reported - Czech (%)
Ancestries Reported - Danish (%)
Ancestries Reported - Dutch (%)
Ancestries Reported - English (%)
Ancestries Reported - French (%)
Ancestries Reported - French Canadian (%)
Ancestries Reported - German (%)
Ancestries Reported - Greek (%)
Ancestries Reported - Hungarian (%)
Ancestries Reported - Irish (%)
Ancestries Reported - Italian (%)
Ancestries Reported - Lithuanian (%)
Ancestries Reported - Norwegian (%)
Ancestries Reported - Polish (%)
Ancestries Reported - Portuguese (%)
Ancestries Reported - Russian (%)
Ancestries Reported - Scotch-Irish (%)
Ancestries Reported - Scottish (%)
Ancestries Reported - Slovak (%)
Ancestries Reported - Subsaharan African (%)
Ancestries Reported - Swedish (%)
Ancestries Reported - Swiss (%)
Ancestries Reported - Ukrainian (%)
Ancestries Reported - United States (%)
Ancestries Reported - Welsh (%)
Ancestries Reported - West Indian (%)
Ancestries Reported - Other (%)
Geographical mobility - Same house 1 year ago (%)
Geographical mobility - Same house 1 year ago (%) - White
Geographical mobility - Same house 1 year ago (%) - Black or African American
Geographical mobility - Same house 1 year ago (%) - Asian
Geographical mobility - Same house 1 year ago (%) - Hispanic or Latino
Geographical mobility - Same house 1 year ago (%) - American Indian and Alaska Native
Geographical mobility - Same house 1 year ago (%) - Multirace
Geographical mobility - Same house 1 year ago (%) - Other Race
Geographical mobility - Moved within same county (%)
Geographical mobility - Moved within same county (%) - White
Geographical mobility - Moved within same county (%) - Black or African American
Geographical mobility - Moved within same county (%) - Asian
Geographical mobility - Moved within same county (%) - Hispanic or Latino
Geographical mobility - Moved within same county (%) - American Indian and Alaska Native
Geographical mobility - Moved within same county (%) - Multirace
Geographical mobility - Moved within same county (%) - Other Race
Geographical mobility - Moved from different county within same state (%)
Geographical mobility - Moved from different county within same state (%) - White
Geographical mobility - Moved from different county within same state (%) - Black or African American
Geographical mobility - Moved from different county within same state (%) - Asian
Geographical mobility - Moved from different county within same state (%) - Hispanic or Latino
Geographical mobility - Moved from different county within same state (%) - American Indian and Alaska Native
Geographical mobility - Moved from different county within same state (%) - Multirace
Geographical mobility - Moved from different county within same state (%) - Other Race
Geographical mobility - Moved from different state (%)
Geographical mobility - Moved from different state (%) - White
Geographical mobility - Moved from different state (%) - Black or African American
Geographical mobility - Moved from different state (%) - Asian
Geographical mobility - Moved from different state (%) - Hispanic or Latino
Geographical mobility - Moved from different state (%) - American Indian and Alaska Native
Geographical mobility - Moved from different state (%) - Multirace
Geographical mobility - Moved from different state (%) - Other Race
Geographical mobility - Moved from abroad (%)
Geographical mobility - Moved from abroad (%) - White
Geographical mobility - Moved from abroad (%) - Black or African American
Geographical mobility - Moved from abroad (%) - Asian
Geographical mobility - Moved from abroad (%) - Hispanic or Latino
Geographical mobility - Moved from abroad (%) - American Indian and Alaska Native
Geographical mobility - Moved from abroad (%) - Multirace
Geographical mobility - Moved from abroad (%) - Other Race
Place of birth for the foreign-born population - Ireland (%)
Place of birth for the foreign-born population - Denmark (%)
Place of birth for the foreign-born population - Norway (%)
Place of birth for the foreign-born population - Sweden (%)
Place of birth for the foreign-born population - United Kingdom (%)
Place of birth for the foreign-born population - England (%)
Place of birth for the foreign-born population - Scotland (%)
Place of birth for the foreign-born population - Other Northern Europe (%)
Place of birth for the foreign-born population - Austria (%)
Place of birth for the foreign-born population - Belgium (%)
Place of birth for the foreign-born population - France (%)
Place of birth for the foreign-born population - Germany (%)
Place of birth for the foreign-born population - Netherlands (%)
Place of birth for the foreign-born population - Switzerland (%)
Place of birth for the foreign-born population - Other Western Europe (%)
Place of birth for the foreign-born population - Greece (%)
Place of birth for the foreign-born population - Italy (%)
Place of birth for the foreign-born population - Portugal (%)
Place of birth for the foreign-born population - Spain (%)
Place of birth for the foreign-born population - Other Southern Europe (%)
Place of birth for the foreign-born population - Albania (%)
Place of birth for the foreign-born population - Belarus (%)
Place of birth for the foreign-born population - Bosnia and Herzegovina (%)
Place of birth for the foreign-born population - Bulgaria (%)
Place of birth for the foreign-born population - Croatia (%)
Place of birth for the foreign-born population - Czechoslovakia (%)
Place of birth for the foreign-born population - Hungary (%)
Place of birth for the foreign-born population - Latvia (%)
Place of birth for the foreign-born population - Lithuania (%)
Place of birth for the foreign-born population - North Macedonia (Macedonia) (%)
Place of birth for the foreign-born population - Moldova (%)
Place of birth for the foreign-born population - Poland (%)
Place of birth for the foreign-born population - Romania (%)
Place of birth for the foreign-born population - Russia (%)
Place of birth for the foreign-born population - Serbia (%)
Place of birth for the foreign-born population - Ukraine (%)
Place of birth for the foreign-born population - Other Eastern Europe (%)
Place of birth for the foreign-born population - China (%)
Place of birth for the foreign-born population - Hong Kong (%)
Place of birth for the foreign-born population - Taiwan (%)
Place of birth for the foreign-born population - Japan (%)
Place of birth for the foreign-born population - Korea (%)
Place of birth for the foreign-born population - Other Eastern Asia (%)
Place of birth for the foreign-born population - Afghanistan (%)
Place of birth for the foreign-born population - Bangladesh (%)
Place of birth for the foreign-born population - India (%)
Place of birth for the foreign-born population - Iran (%)
Place of birth for the foreign-born population - Kazakhstan (%)
Place of birth for the foreign-born population - Nepal (%)
Place of birth for the foreign-born population - Pakistan (%)
Place of birth for the foreign-born population - Sri Lanka (%)
Place of birth for the foreign-born population - Uzbekistan (%)
Place of birth for the foreign-born population - Other South Central Asia (%)
Place of birth for the foreign-born population - Burma (%)
Place of birth for the foreign-born population - Cambodia (%)
Place of birth for the foreign-born population - Indonesia (%)
Place of birth for the foreign-born population - Laos (%)
Place of birth for the foreign-born population - Malaysia (%)
Place of birth for the foreign-born population - Philippines (%)
Place of birth for the foreign-born population - Singapore (%)
Place of birth for the foreign-born population - Thailand (%)
Place of birth for the foreign-born population - Vietnam (%)
Place of birth for the foreign-born population - Other South Eastern Asia (%)
Place of birth for the foreign-born population - Armenia (%)
Place of birth for the foreign-born population - Iraq (%)
Place of birth for the foreign-born population - Israel (%)
Place of birth for the foreign-born population - Jordan (%)
Place of birth for the foreign-born population - Kuwait (%)
Place of birth for the foreign-born population - Lebanon (%)
Place of birth for the foreign-born population - Saudi Arabia (%)
Place of birth for the foreign-born population - Syria (%)
Place of birth for the foreign-born population - Turkey (%)
Place of birth for the foreign-born population - Yemen (%)
Place of birth for the foreign-born population - Other Western Asia (%)
Place of birth for the foreign-born population - Eritrea (%)
Place of birth for the foreign-born population - Ethiopia (%)
Place of birth for the foreign-born population - Kenya (%)
Place of birth for the foreign-born population - Somalia (%)
Place of birth for the foreign-born population - Uganda (%)
Place of birth for the foreign-born population - Zimbabwe (%)
Place of birth for the foreign-born population - Other Eastern Africa (%)
Place of birth for the foreign-born population - Cameroon (%)
Place of birth for the foreign-born population - Congo (%)
Place of birth for the foreign-born population - Democratic Republic of Congo (Zaire) (%)
Place of birth for the foreign-born population - Other Middle Africa (%)
Place of birth for the foreign-born population - Egypt (%)
Place of birth for the foreign-born population - Morocco (%)
Place of birth for the foreign-born population - Sudan (%)
Place of birth for the foreign-born population - Other Northern Africa (%)
Place of birth for the foreign-born population - South Africa (%)
Place of birth for the foreign-born population - Other Southern Africa (%)
Place of birth for the foreign-born population - Cabo Verde (%)
Place of birth for the foreign-born population - Ghana (%)
Place of birth for the foreign-born population - Liberia (%)
Place of birth for the foreign-born population - Nigeria (%)
Place of birth for the foreign-born population - Senegal (%)
Place of birth for the foreign-born population - Sierra Leone (%)
Place of birth for the foreign-born population - Other Western Africa (%)
Place of birth for the foreign-born population - Australia (%)
Place of birth for the foreign-born population - New Zealand (%)
Place of birth for the foreign-born population - Fiji (%)
Place of birth for the foreign-born population - Micronesia (%)
Place of birth for the foreign-born population - Bahamas (%)
Place of birth for the foreign-born population - Barbados (%)
Place of birth for the foreign-born population - Cuba (%)
Place of birth for the foreign-born population - Dominica (%)
Place of birth for the foreign-born population - Dominican Republic (%)
Place of birth for the foreign-born population - Grenada (%)
Place of birth for the foreign-born population - Haiti (%)
Place of birth for the foreign-born population - Jamaica (%)
Place of birth for the foreign-born population - St. Vincent and the Grenadines (%)
Place of birth for the foreign-born population - Trinidad and Tobago (%)
Place of birth for the foreign-born population - West Indies (%)
Place of birth for the foreign-born population - Other Caribbean (%)
Place of birth for the foreign-born population - Belize (%)
Place of birth for the foreign-born population - Costa Rica (%)
Place of birth for the foreign-born population - El Salvador (%)
Place of birth for the foreign-born population - Guatemala (%)
Place of birth for the foreign-born population - Honduras (%)
Place of birth for the foreign-born population - Mexico (%)
Place of birth for the foreign-born population - Nicaragua (%)
Place of birth for the foreign-born population - Panama (%)
Place of birth for the foreign-born population - Other Central America (%)
Place of birth for the foreign-born population - Argentina (%)
Place of birth for the foreign-born population - Bolivia (%)
Place of birth for the foreign-born population - Brazil (%)
Place of birth for the foreign-born population - Chile (%)
Place of birth for the foreign-born population - Colombia (%)
Place of birth for the foreign-born population - Ecuador (%)
Place of birth for the foreign-born population - Guyana (%)
Place of birth for the foreign-born population - Peru (%)
Place of birth for the foreign-born population - Uruguay (%)
Place of birth for the foreign-born population - Venezuela (%)
Place of birth for the foreign-born population - Other South America (%)
Place of birth for the foreign-born population - Canada (%)
Place of birth for the foreign-born population - Other Northern America (%)
Place of birth for the foreign-born population - Other (%)
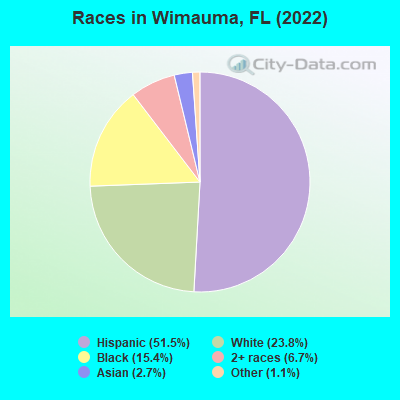
According to 2022 data, the most numerous races in Wimauma, FL are White alone (3,046 residents), Hispanic (6,605 residents), and Black alone (1,979 residents). 50.5% of Wimauma residents speak English at home. 24.5% of Wimauma, FL residents are foreign-born (22.1% born in Latin America), which is 14.2% greater than the foreign-born rate of 21.0% across the entire state of Florida.
Race distribution in Wimauma
2000 2022
10,458,509 65.4% White alone 2,682,715 16.8% Hispanic 2,264,268 14.2% Black alone 261,693 1.6% Asian alone 236,954 1.5% Two or more races 42,358 0.3% American Indian alone 28,994 0.2% Other race alone 6,887 0.04% Native Hawaiian and Other
11,309,403 50.8% White alone 6,025,039 27.1% Hispanic 3,241,015 14.6% Black alone 861,630 3.9% Two or more races 623,692 2.8% Asian alone 152,054 0.7% Other race alone 22,504 0.1% American Indian alone 9,486 0.04% Native Hawaiian and Other
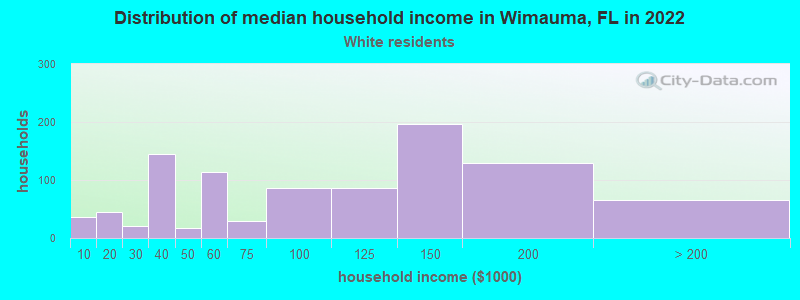
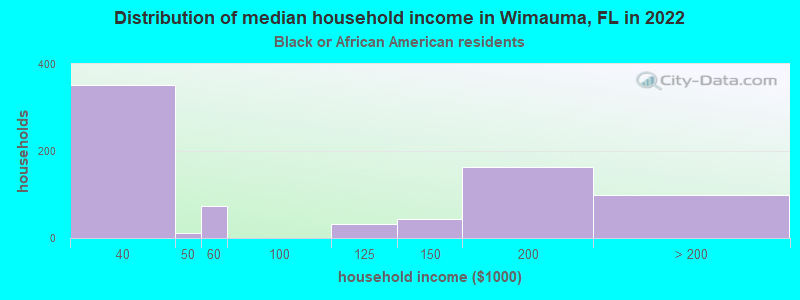
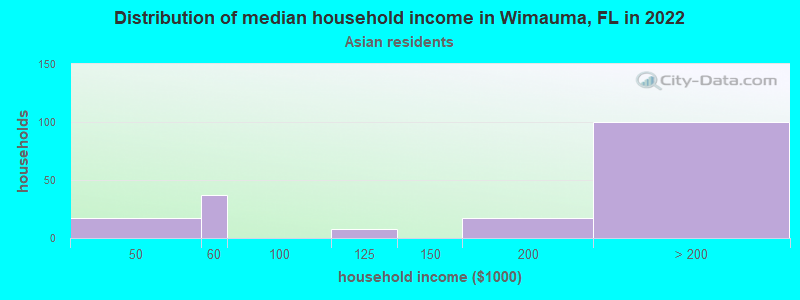
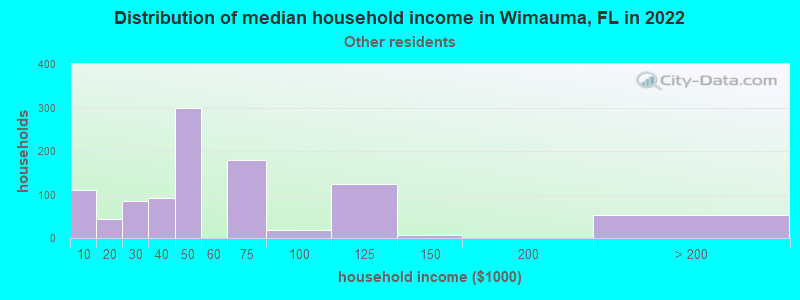
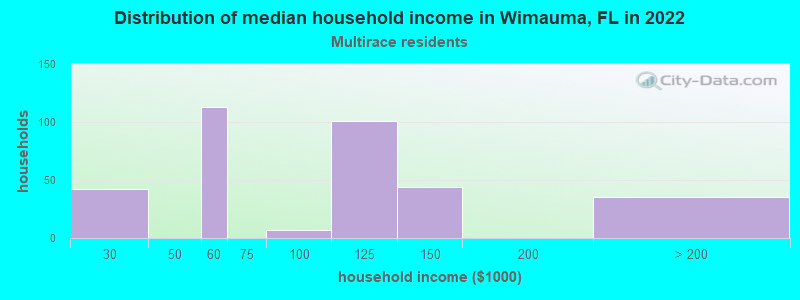
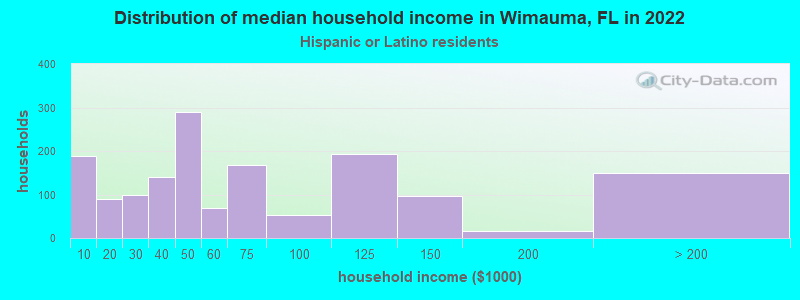
Income and house value in Wimauma Median household income in 2022 $107,229 White non-Hispanic householders$194,400 Asian householders$50,215 Some other race householders$117,183 Two or more races householders$50,078 Hispanic or Latino race householdersMedian 2022 house value $527,520 White Non-Hispanic householders$316,020 Black or African American householders$399,636 American Indian or Alaska Native householders$484,482 Some other race householders$470,341 Hispanic or Latino householders
Median age by race in Wimauma
31.8 Median age for White residents33.3 30.8 17.1 Median age for Black or African American residents17.2 34.4 44.9 Median age for American Indian / Alaska Native residents78.2 -655,399,060.4 41.0 Median age for Asian residents46.3 40.7 -848,484,847.6 Median age for Native Hawaiian / Pacific Islander residents-776,729,559.0 -490,118,576.6 26.2 Median age for Other race residents24.4 31.1 13.6 Median age for Two or more races residents13.6 11.1 33.6 Median age for White alone residents33.7 33.5 24.1 Median age for Hispanic or Latino residents22.9 27.4
Owner/renter occupied households by race in Wimauma
House owners and renters - White residents 767 77.9% Owner occupied217 22.1% Renter occupiedHouse owners and renters - Black or African American residents 723 97.6% Owner occupied18 2.4% Renter occupiedHouse owners and renters - American Indian / Alaska Native residents 29 100.0% Renter occupiedHouse owners and renters - Asian residents 174 100.0% Owner occupiedHouse owners and renters - Other race residents 623 56.7% Owner occupied476 43.3% Renter occupiedHouse owners and renters - Two or more races residents 202 54.9% Owner occupied166 45.1% Renter occupiedHouse owners and renters - White alone residents 695 87.8% Owner occupied97 12.2% Renter occupiedHouse owners and renters - Hispanic or Latino residents 893 56.1% Owner occupied700 43.9% Renter occupied
Language usage in Wimauma
English speakers - Total 50.5% of residents of Wimauma speak English at home.
45.2% of residents speak Spanish at home 3,367 64.0% Speak English very well1,892 36.0% Speak English less than very well2.6% of residents speak other language at home 161 52.4% Speak English very well146 47.6% Speak English less than very well
English speakers - Born in the United States 85.9% of residents of Wimauma speak English at home.
13.9% of residents speak Spanish at home 362 100.0% Speak English very well
English speakers - Native, born elsewhere 26.0% of residents of Wimauma speak English at home.
70.8% of residents speak Spanish at home 118 66.7% Speak English very well59 33.3% Speak English less than very well
English speakers - Foreign-born 5.3% of residents of Wimauma speak English at home.
85.3% of residents speak Spanish at home 1,066 38.2% Speak English very well1,721 61.8% Speak English less than very well9.2% of residents speak other language at home 156 52.0% Speak English very well144 48.0% Speak English less than very well
White (Caucasian) - Speak another language Native:
10.6% (342)Foreign-born:
84.9% (176)
Black or African American - Speak only English Native:
98.3% (1,644)Foreign-born:
56.1% (129)
Black or African American - Speak another language Native:
1.9% (31)Foreign-born:
43.7% (101)
American Indian / Alaska Native - Speak another language Native:
100.0% (68)Foreign-born:
100.0% (232)
Asian - Speak another language Native:
10.0% (9)Foreign-born:
99.6% (225)
Other race - Speak only English Native:
10.0% (207)Foreign-born:
2.6% (60)
Other race - Speak another language Native:
88.4% (1,837)Foreign-born:
98.3% (2,260)
Two or more races - Speak another language Native:
33.7% (669)Foreign-born:
100.0% (470)
Hispanic or Latino - Speak only English Native:
19.1% (636)Foreign-born:
2.1% (58)
Hispanic or Latino - Speak another language Native:
76.3% (2,546)Foreign-born:
98.2% (2,739)
Foreign-born residents in Wimauma 3,136 residents are foreign born (22.1% Latin America ).
This city:
24.5%Florida:
21.1%
Marital status for residents in Wimauma Marital status - White (Caucasian) population 15 years and over
Males 22.6% Never married69.6% Now married0.0% Separated0.0% Widowed7.9% DivorcedFemales 27.4% Never married49.9% Now married1.5% Separated8.3% Widowed12.9% DivorcedWomen who gave birth in the past 12 months Now married:
41.5% (23)Unmarried:
58.5% (32)
Women who did not give birth in the past 12 months Now married:
48.4% (379)Unmarried:
51.6% (405)
Marital status - Black or African American population 15 years and over
Males 52.0% Never married48.0% Now married0.0% Separated0.0% Widowed0.0% DivorcedFemales 28.3% Never married71.7% Now married0.0% Separated0.0% Widowed0.0% DivorcedWomen who did not give birth in the past 12 months Now married:
68.6% (544)Unmarried:
31.4% (250)
Marital status - American Indian / Alaska Native population 15 years and over
Males 20.2% Never married79.8% Now married0.0% Separated0.0% Widowed0.0% DivorcedFemales 100.0% Never married0.0% Now married0.0% Separated0.0% Widowed0.0% DivorcedWomen who did not give birth in the past 12 months Now married:
0.0% (0)Unmarried:
100.0% (70)
Marital status - Asian population 15 years and over
Males 0.0% Never married88.1% Now married0.0% Separated0.0% Widowed11.9% DivorcedFemales 0.0% Never married100.0% Now married0.0% Separated0.0% Widowed0.0% DivorcedWomen who did not give birth in the past 12 months Now married:
100.0% (49)Unmarried:
0.0% (0)
Marital status - Other race population 15 years and over
Males 57.5% Never married42.5% Now married0.0% Separated0.0% Widowed0.0% DivorcedFemales 38.8% Never married57.0% Now married0.0% Separated2.6% Widowed1.7% DivorcedWomen who gave birth in the past 12 months Now married:
41.6% (71)Unmarried:
58.4% (100)
Women who did not give birth in the past 12 months Now married:
39.9% (380)Unmarried:
60.1% (572)
Marital status - Two or more races population 15 years and over
Males 30.1% Never married69.9% Now married0.0% Separated0.0% Widowed0.0% DivorcedFemales 30.8% Never married62.3% Now married0.0% Separated0.0% Widowed6.9% DivorcedWomen who did not give birth in the past 12 months Now married:
54.9% (242)Unmarried:
45.1% (199)
Marital status - White alone, not Hispanic / Latino population 15 years and over
Males 19.3% Never married71.9% Now married0.0% Separated0.0% Widowed8.9% DivorcedFemales 17.2% Never married52.5% Now married0.8% Separated10.9% Widowed18.6% DivorcedWomen who did not give birth in the past 12 months Now married:
50.8% (291)Unmarried:
49.2% (282)
Marital status - Hispanic or Latino population 15 years and over
Males 46.9% Never married52.0% Now married0.0% Separated0.0% Widowed1.2% DivorcedFemales 41.1% Never married53.9% Now married0.7% Separated2.0% Widowed2.3% DivorcedWomen who gave birth in the past 12 months Now married:
41.6% (82)Unmarried:
58.4% (116)
Women who did not give birth in the past 12 months Now married:
41.9% (582)Unmarried:
58.1% (808)
Ancestries in Wimauma
692 8.2% American319 3.8% Haitian75 0.9% English62 0.7% Irish54 0.6% European46 0.5% Polish31 0.4% Guyanese26 0.3% Danish23 0.3% Trinidadian and Tobagonian19 0.2% Italian
Geographical mobility in Wimauma Same house 1 year ago 3,143 84.1% White (Caucasian)2,181 100.0% Black or African American261 100.0% American Indian / Alaska Native346 97.1% Asian4,199 89.4% Other race2,312 86.0% Two or more races2,550 83.5% White alone, not Hispanic / Latino5,554 85.8% Hispanic or LatinoMoved within same county 405 10.8% White / Caucasian71 3.3% Black or African American368 7.8% Other race272 10.1% Two or more races322 10.6% White alone, not Hispanic / Latino647 10.0% Hispanic or LatinoMoved within same state 42 1.1% White / Caucasian33 9.2% Asian49 1.6% White alone, not Hispanic / LatinoMoved from different state 77 2.1% White / Caucasian64 2.4% Two or more races83 2.7% White alone, not Hispanic / Latino53 0.8% Hispanic or LatinoMoved from abroad 7 0.2% White164 3.5% Other race145 2.2% Hispanic or Latino
Children Nativity (place of birth) in Wimauma
Children under 6 years - Living with two parents Both parents native 239 100.0% NativeBoth parents foreign-born 617 100.0% NativeOne native, one foreign-born parent 65 100.0% NativeChildren under 6 years - Living with one parent Native parent 368 100.0% NativeForeign-born parent 229 100.0% NativeChildren 6 to 17 years - Living with two parents Both parents native 1,937 100.0% NativeBoth parents foreign-born 444 78.8% Native120 21.2% Foreign-bornOne native, one foreign-born parent 149 100.0% NativeChildren 6 to 17 years - Living with one parent Native parent 591 100.0% NativeForeign-born parent 288 58.1% Native208 41.9% Foreign-born
Grandparents responsible for own grandchildren in Wimauma
Grandparents (30 to 59 years) White / Caucasian 60 100.0% Not responsible for grandchildrenOther race 65 100.0% Responsible for grandchildrenTwo or more races 32 19.1% Responsible for grandchildren137 80.9% Not responsible for grandchildrenWhite alone, not Hispanic / Latino 22 100.0% Not responsible for grandchildrenHispanic or Latino 152 57.8% Responsible for grandchildren111 42.2% Not responsible for grandchildrenGrandparents (60 years and over) White / Caucasian 34 100.0% Not responsible for grandchildrenOther race 136 100.0% Not responsible for grandchildrenTwo or more races 16 100.0% Responsible for grandchildrenWhite alone, not Hispanic / Latino 31 100.0% Not responsible for grandchildrenHispanic or Latino 11 8.9% Responsible for grandchildren107 91.1% Not responsible for grandchildren