Races in Willow Street, Pennsylvania (PA) Detailed Stats
Data:
Races - White alone (%)
Races - White alone (% change since 2000)
Races - Black alone (%)
Races - Black alone (% change since 2000)
Races - American Indian alone (%)
Races - American Indian alone (% change since 2000)
Races - Asian alone (%)
Races - Asian alone (% change since 2000)
Races - Hispanic (%)
Races - Hispanic (% change since 2000)
Races - Native Hawaiian and Other Pacific Islander alone (%)
Races - Native Hawaiian and Other Pacific Islander alone (% change since 2000)
Races - Two or more races(%)
Races - Two or more races(% change since 2000)
Races - Other race alone (%)
Races - Other race alone (% change since 2000)
Racial diversity
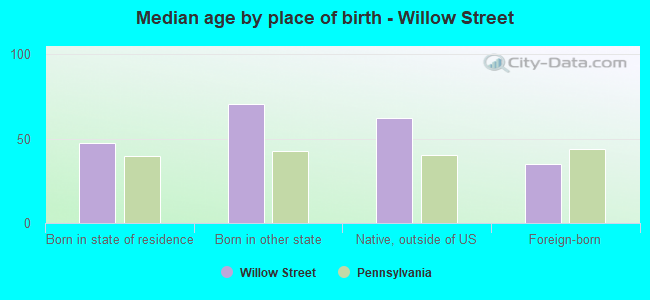
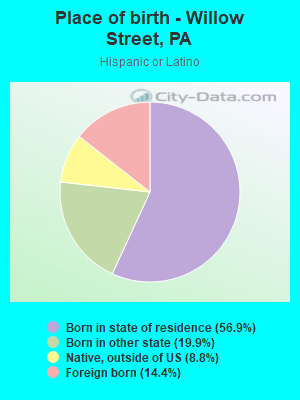
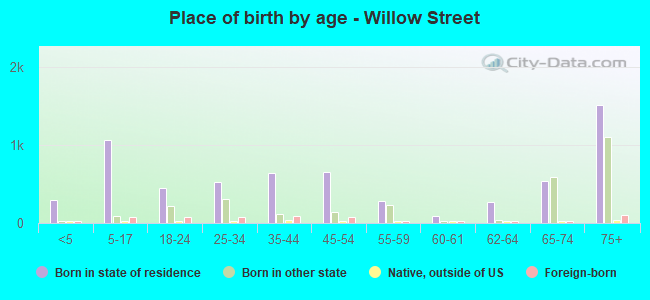
Place of birth - Born in state of residence (%)
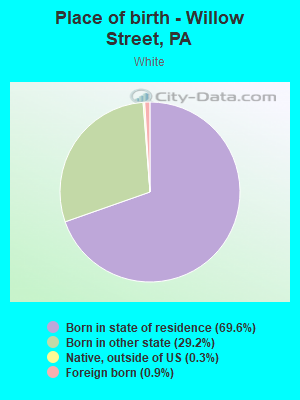
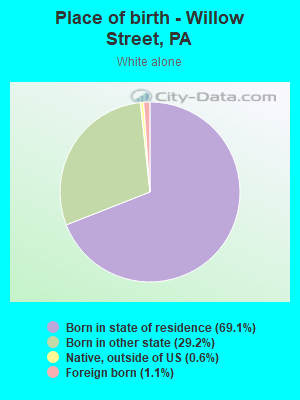
Place of birth - Born in state of residence (%) - White
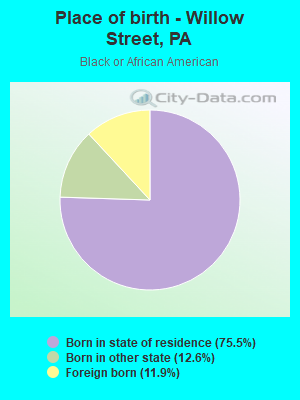
Place of birth - Born in state of residence (%) - Black or African American
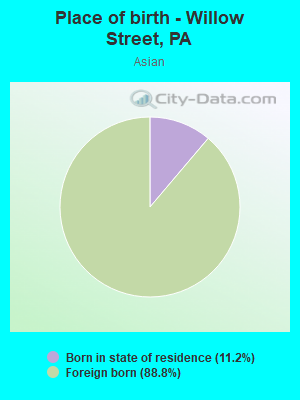
Place of birth - Born in state of residence (%) - Asian
Place of birth - Born in state of residence (%) - Hispanic or Latino
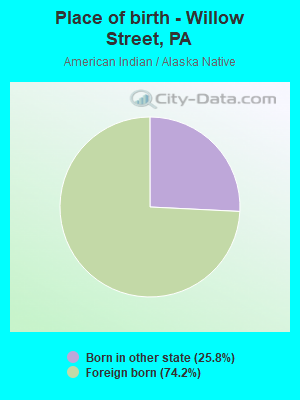
Place of birth - Born in state of residence (%) - American Indian and Alaska Native
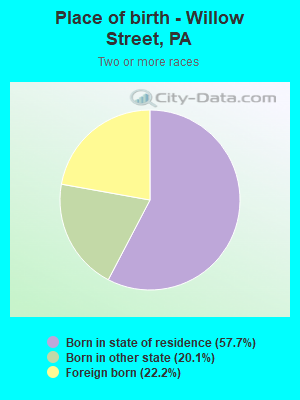
Place of birth - Born in state of residence (%) - Multirace
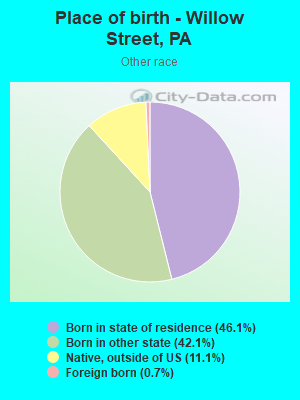
Place of birth - Born in state of residence (%) - Other Race
Place of birth - Born in other state (%)
Place of birth - Born in other state (%) - White
Place of birth - Born in other state (%) - Black or African American
Place of birth - Born in other state (%) - Asian
Place of birth - Born in other state (%) - Hispanic or Latino
Place of birth - Born in other state (%) - American Indian and Alaska Native
Place of birth - Born in other state (%) - Multirace
Place of birth - Born in other state (%) - Other Race
Place of birth - Native, outside of US (%)
Place of birth - Native, outside of US (%) - White
Place of birth - Native, outside of US (%) - Black or African American
Place of birth - Native, outside of US (%) - Asian
Place of birth - Native, outside of US (%) - Hispanic or Latino
Place of birth - Native, outside of US (%) - American Indian and Alaska Native
Place of birth - Native, outside of US (%) - Multirace
Place of birth - Native, outside of US (%) - Other Race
Place of birth - Foreign born (%)
Place of birth - Foreign born (%) - White
Place of birth - Foreign born (%) - Black or African American
Place of birth - Foreign born (%) - Asian
Place of birth - Foreign born (%) - Hispanic or Latino
Place of birth - Foreign born (%) - American Indian and Alaska Native
Place of birth - Foreign born (%) - Multirace
Place of birth - Foreign born (%) - Other Race
Residents speaking English at home (%)
Residents speaking English at home - Born in the United States (%)
Residents speaking English at home - Native, born elsewhere (%)
Residents speaking English at home - Foreign born (%)
Residents speaking Spanish at home (%)
Residents speaking Spanish at home - Born in the United States (%)
Residents speaking Spanish at home - Native, born elsewhere (%)
Residents speaking Spanish at home - Foreign born (%)
Residents speaking other language at home (%)
Residents speaking other language at home - Born in the United States (%)
Residents speaking other language at home - Native, born elsewhere (%)
Residents speaking other language at home - Foreign born (%)
Marital status - Never married (%)
Marital status - Now married (%)
Marital status - Separated (%)
Marital status - Widowed (%)
Marital status - Divorced (%)
Ancestries Reported - Arab (%)
Ancestries Reported - Czech (%)
Ancestries Reported - Danish (%)
Ancestries Reported - Dutch (%)
Ancestries Reported - English (%)
Ancestries Reported - French (%)
Ancestries Reported - French Canadian (%)
Ancestries Reported - German (%)
Ancestries Reported - Greek (%)
Ancestries Reported - Hungarian (%)
Ancestries Reported - Irish (%)
Ancestries Reported - Italian (%)
Ancestries Reported - Lithuanian (%)
Ancestries Reported - Norwegian (%)
Ancestries Reported - Polish (%)
Ancestries Reported - Portuguese (%)
Ancestries Reported - Russian (%)
Ancestries Reported - Scotch-Irish (%)
Ancestries Reported - Scottish (%)
Ancestries Reported - Slovak (%)
Ancestries Reported - Subsaharan African (%)
Ancestries Reported - Swedish (%)
Ancestries Reported - Swiss (%)
Ancestries Reported - Ukrainian (%)
Ancestries Reported - United States (%)
Ancestries Reported - Welsh (%)
Ancestries Reported - West Indian (%)
Ancestries Reported - Other (%)
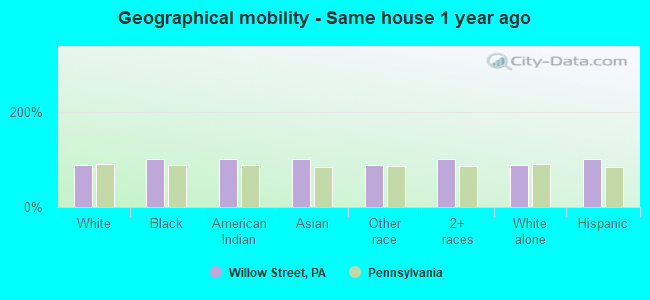
Geographical mobility - Same house 1 year ago (%)
Geographical mobility - Same house 1 year ago (%) - White
Geographical mobility - Same house 1 year ago (%) - Black or African American
Geographical mobility - Same house 1 year ago (%) - Asian
Geographical mobility - Same house 1 year ago (%) - Hispanic or Latino
Geographical mobility - Same house 1 year ago (%) - American Indian and Alaska Native
Geographical mobility - Same house 1 year ago (%) - Multirace
Geographical mobility - Same house 1 year ago (%) - Other Race
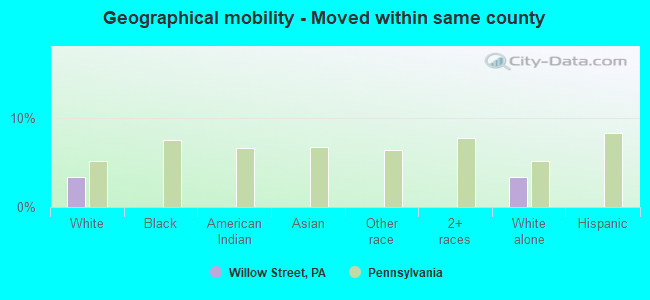
Geographical mobility - Moved within same county (%)
Geographical mobility - Moved within same county (%) - White
Geographical mobility - Moved within same county (%) - Black or African American
Geographical mobility - Moved within same county (%) - Asian
Geographical mobility - Moved within same county (%) - Hispanic or Latino
Geographical mobility - Moved within same county (%) - American Indian and Alaska Native
Geographical mobility - Moved within same county (%) - Multirace
Geographical mobility - Moved within same county (%) - Other Race
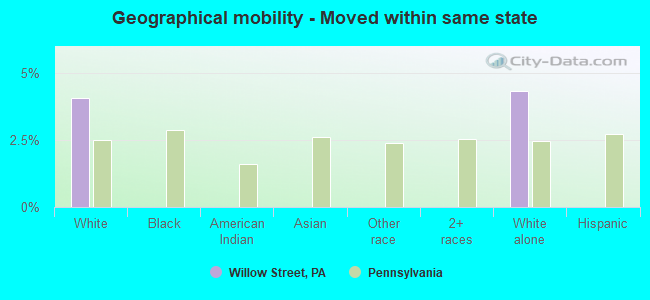
Geographical mobility - Moved from different county within same state (%)
Geographical mobility - Moved from different county within same state (%) - White
Geographical mobility - Moved from different county within same state (%) - Black or African American
Geographical mobility - Moved from different county within same state (%) - Asian
Geographical mobility - Moved from different county within same state (%) - Hispanic or Latino
Geographical mobility - Moved from different county within same state (%) - American Indian and Alaska Native
Geographical mobility - Moved from different county within same state (%) - Multirace
Geographical mobility - Moved from different county within same state (%) - Other Race
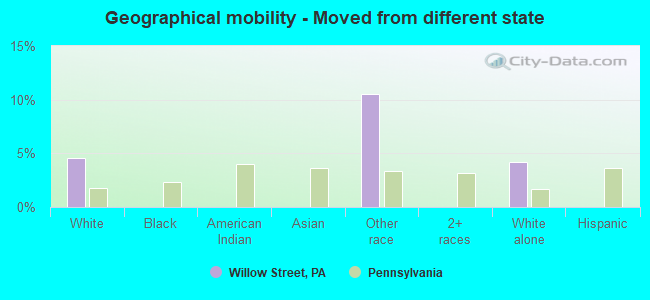
Geographical mobility - Moved from different state (%)
Geographical mobility - Moved from different state (%) - White
Geographical mobility - Moved from different state (%) - Black or African American
Geographical mobility - Moved from different state (%) - Asian
Geographical mobility - Moved from different state (%) - Hispanic or Latino
Geographical mobility - Moved from different state (%) - American Indian and Alaska Native
Geographical mobility - Moved from different state (%) - Multirace
Geographical mobility - Moved from different state (%) - Other Race
Geographical mobility - Moved from abroad (%)
Geographical mobility - Moved from abroad (%) - White
Geographical mobility - Moved from abroad (%) - Black or African American
Geographical mobility - Moved from abroad (%) - Asian
Geographical mobility - Moved from abroad (%) - Hispanic or Latino
Geographical mobility - Moved from abroad (%) - American Indian and Alaska Native
Geographical mobility - Moved from abroad (%) - Multirace
Geographical mobility - Moved from abroad (%) - Other Race
Place of birth for the foreign-born population - Ireland (%)
Place of birth for the foreign-born population - Denmark (%)
Place of birth for the foreign-born population - Norway (%)
Place of birth for the foreign-born population - Sweden (%)
Place of birth for the foreign-born population - United Kingdom (%)
Place of birth for the foreign-born population - England (%)
Place of birth for the foreign-born population - Scotland (%)
Place of birth for the foreign-born population - Other Northern Europe (%)
Place of birth for the foreign-born population - Austria (%)
Place of birth for the foreign-born population - Belgium (%)
Place of birth for the foreign-born population - France (%)
Place of birth for the foreign-born population - Germany (%)
Place of birth for the foreign-born population - Netherlands (%)
Place of birth for the foreign-born population - Switzerland (%)
Place of birth for the foreign-born population - Other Western Europe (%)
Place of birth for the foreign-born population - Greece (%)
Place of birth for the foreign-born population - Italy (%)
Place of birth for the foreign-born population - Portugal (%)
Place of birth for the foreign-born population - Spain (%)
Place of birth for the foreign-born population - Other Southern Europe (%)
Place of birth for the foreign-born population - Albania (%)
Place of birth for the foreign-born population - Belarus (%)
Place of birth for the foreign-born population - Bosnia and Herzegovina (%)
Place of birth for the foreign-born population - Bulgaria (%)
Place of birth for the foreign-born population - Croatia (%)
Place of birth for the foreign-born population - Czechoslovakia (%)
Place of birth for the foreign-born population - Hungary (%)
Place of birth for the foreign-born population - Latvia (%)
Place of birth for the foreign-born population - Lithuania (%)
Place of birth for the foreign-born population - North Macedonia (Macedonia) (%)
Place of birth for the foreign-born population - Moldova (%)
Place of birth for the foreign-born population - Poland (%)
Place of birth for the foreign-born population - Romania (%)
Place of birth for the foreign-born population - Russia (%)
Place of birth for the foreign-born population - Serbia (%)
Place of birth for the foreign-born population - Ukraine (%)
Place of birth for the foreign-born population - Other Eastern Europe (%)
Place of birth for the foreign-born population - China (%)
Place of birth for the foreign-born population - Hong Kong (%)
Place of birth for the foreign-born population - Taiwan (%)
Place of birth for the foreign-born population - Japan (%)
Place of birth for the foreign-born population - Korea (%)
Place of birth for the foreign-born population - Other Eastern Asia (%)
Place of birth for the foreign-born population - Afghanistan (%)
Place of birth for the foreign-born population - Bangladesh (%)
Place of birth for the foreign-born population - India (%)
Place of birth for the foreign-born population - Iran (%)
Place of birth for the foreign-born population - Kazakhstan (%)
Place of birth for the foreign-born population - Nepal (%)
Place of birth for the foreign-born population - Pakistan (%)
Place of birth for the foreign-born population - Sri Lanka (%)
Place of birth for the foreign-born population - Uzbekistan (%)
Place of birth for the foreign-born population - Other South Central Asia (%)
Place of birth for the foreign-born population - Burma (%)
Place of birth for the foreign-born population - Cambodia (%)
Place of birth for the foreign-born population - Indonesia (%)
Place of birth for the foreign-born population - Laos (%)
Place of birth for the foreign-born population - Malaysia (%)
Place of birth for the foreign-born population - Philippines (%)
Place of birth for the foreign-born population - Singapore (%)
Place of birth for the foreign-born population - Thailand (%)
Place of birth for the foreign-born population - Vietnam (%)
Place of birth for the foreign-born population - Other South Eastern Asia (%)
Place of birth for the foreign-born population - Armenia (%)
Place of birth for the foreign-born population - Iraq (%)
Place of birth for the foreign-born population - Israel (%)
Place of birth for the foreign-born population - Jordan (%)
Place of birth for the foreign-born population - Kuwait (%)
Place of birth for the foreign-born population - Lebanon (%)
Place of birth for the foreign-born population - Saudi Arabia (%)
Place of birth for the foreign-born population - Syria (%)
Place of birth for the foreign-born population - Turkey (%)
Place of birth for the foreign-born population - Yemen (%)
Place of birth for the foreign-born population - Other Western Asia (%)
Place of birth for the foreign-born population - Eritrea (%)
Place of birth for the foreign-born population - Ethiopia (%)
Place of birth for the foreign-born population - Kenya (%)
Place of birth for the foreign-born population - Somalia (%)
Place of birth for the foreign-born population - Uganda (%)
Place of birth for the foreign-born population - Zimbabwe (%)
Place of birth for the foreign-born population - Other Eastern Africa (%)
Place of birth for the foreign-born population - Cameroon (%)
Place of birth for the foreign-born population - Congo (%)
Place of birth for the foreign-born population - Democratic Republic of Congo (Zaire) (%)
Place of birth for the foreign-born population - Other Middle Africa (%)
Place of birth for the foreign-born population - Egypt (%)
Place of birth for the foreign-born population - Morocco (%)
Place of birth for the foreign-born population - Sudan (%)
Place of birth for the foreign-born population - Other Northern Africa (%)
Place of birth for the foreign-born population - South Africa (%)
Place of birth for the foreign-born population - Other Southern Africa (%)
Place of birth for the foreign-born population - Cabo Verde (%)
Place of birth for the foreign-born population - Ghana (%)
Place of birth for the foreign-born population - Liberia (%)
Place of birth for the foreign-born population - Nigeria (%)
Place of birth for the foreign-born population - Senegal (%)
Place of birth for the foreign-born population - Sierra Leone (%)
Place of birth for the foreign-born population - Other Western Africa (%)
Place of birth for the foreign-born population - Australia (%)
Place of birth for the foreign-born population - New Zealand (%)
Place of birth for the foreign-born population - Fiji (%)
Place of birth for the foreign-born population - Micronesia (%)
Place of birth for the foreign-born population - Bahamas (%)
Place of birth for the foreign-born population - Barbados (%)
Place of birth for the foreign-born population - Cuba (%)
Place of birth for the foreign-born population - Dominica (%)
Place of birth for the foreign-born population - Dominican Republic (%)
Place of birth for the foreign-born population - Grenada (%)
Place of birth for the foreign-born population - Haiti (%)
Place of birth for the foreign-born population - Jamaica (%)
Place of birth for the foreign-born population - St. Vincent and the Grenadines (%)
Place of birth for the foreign-born population - Trinidad and Tobago (%)
Place of birth for the foreign-born population - West Indies (%)
Place of birth for the foreign-born population - Other Caribbean (%)
Place of birth for the foreign-born population - Belize (%)
Place of birth for the foreign-born population - Costa Rica (%)
Place of birth for the foreign-born population - El Salvador (%)
Place of birth for the foreign-born population - Guatemala (%)
Place of birth for the foreign-born population - Honduras (%)
Place of birth for the foreign-born population - Mexico (%)
Place of birth for the foreign-born population - Nicaragua (%)
Place of birth for the foreign-born population - Panama (%)
Place of birth for the foreign-born population - Other Central America (%)
Place of birth for the foreign-born population - Argentina (%)
Place of birth for the foreign-born population - Bolivia (%)
Place of birth for the foreign-born population - Brazil (%)
Place of birth for the foreign-born population - Chile (%)
Place of birth for the foreign-born population - Colombia (%)
Place of birth for the foreign-born population - Ecuador (%)
Place of birth for the foreign-born population - Guyana (%)
Place of birth for the foreign-born population - Peru (%)
Place of birth for the foreign-born population - Uruguay (%)
Place of birth for the foreign-born population - Venezuela (%)
Place of birth for the foreign-born population - Other South America (%)
Place of birth for the foreign-born population - Canada (%)
Place of birth for the foreign-born population - Other Northern America (%)
Place of birth for the foreign-born population - Other (%)
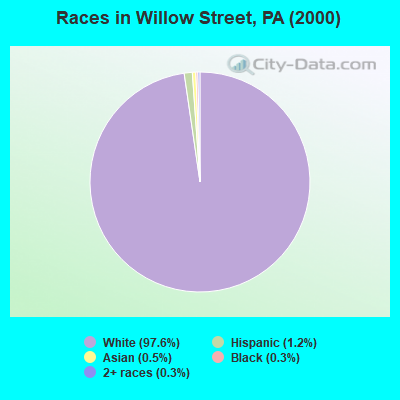
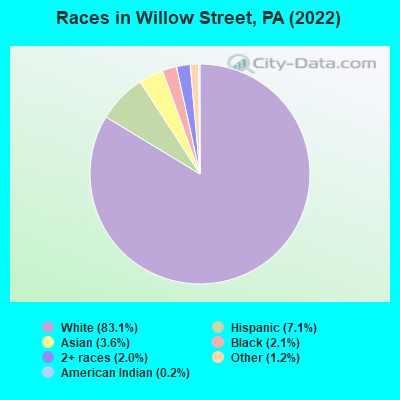
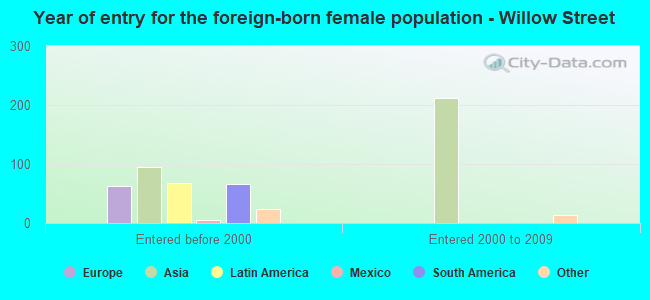
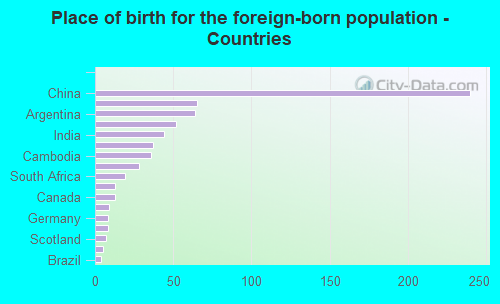
According to 2022 data, the most numerous races in Willow Street, PA are White alone (8,060 residents), Black alone (206 residents), and Hispanic (684 residents). 93.5% of Willow Street residents speak English at home. 6.8% of Willow Street, PA residents are foreign-born (3.2% born in Asia, 1.4% born in Latin America, 1.3% born in Europe), which is 3.0% less than the foreign-born rate of 7.0% across the entire state of Pennsylvania.
Race distribution in Willow Street
2000 2022
10,322,455 84.1% White alone 1,202,437 9.8% Black alone 394,088 3.2% Hispanic 218,296 1.8% Asian alone 113,097 0.9% Two or more races 13,086 0.1% Other race alone 14,904 0.1% American Indian alone 2,691 0.02% Native Hawaiian and Other
9,487,228 73.1% White alone 1,311,581 10.1% Black alone 1,115,997 8.6% Hispanic 493,942 3.8% Two or more races 487,124 3.8% Asian alone 63,582 0.5% Other race alone 10,130 0.08% American Indian alone 2,424 0.02% Native Hawaiian and Other
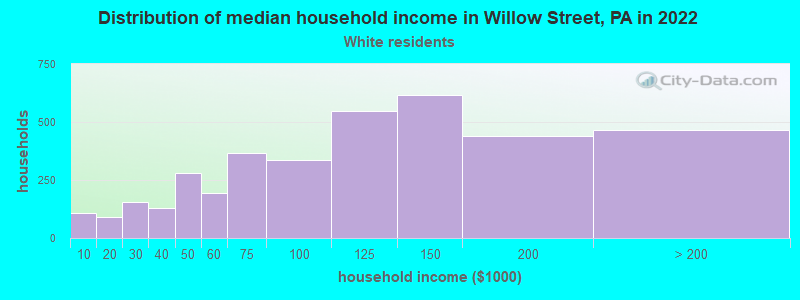
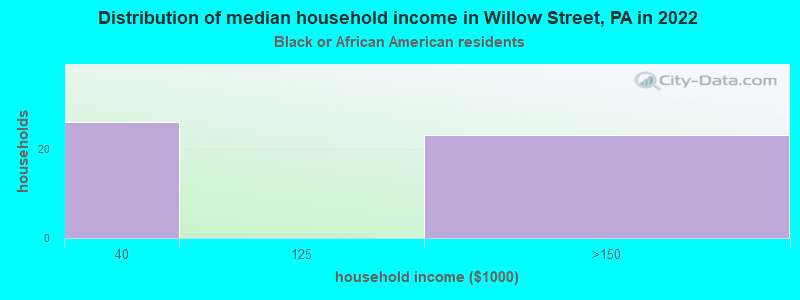
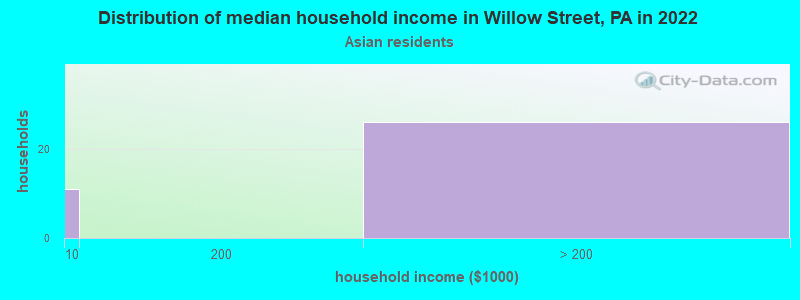
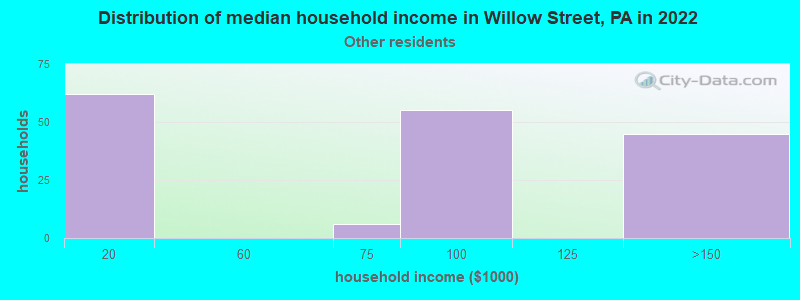
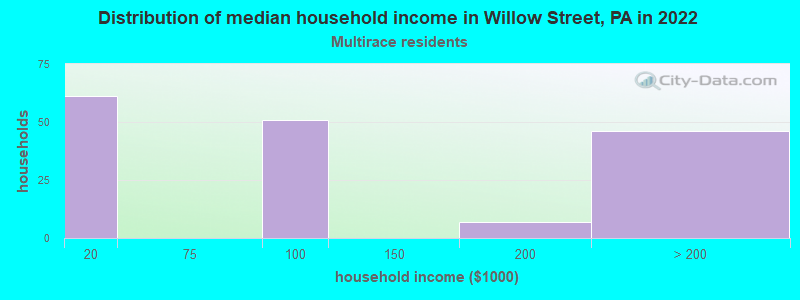
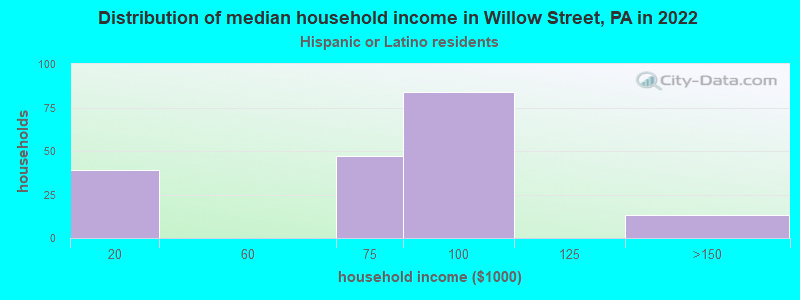
Income and house value in Willow Street Median household income in 2022 $105,024 White non-Hispanic householders$71,798 Hispanic or Latino race householdersMedian 2022 house value $300,949 White Non-Hispanic householders$328,417 Black or African American householders$117,991 Hispanic or Latino householders
Median age by race in Willow Street
57.4 Median age for White residents55.8 61.3 50.4 Median age for Black or African American residents48.1 66.1 27.3 Median age for American Indian / Alaska Native residents-714,583,332.6 -577,519,379.3 22.1 Median age for Asian residents36.2 19.9 -612,499,999.4 Median age for Native Hawaiian / Pacific Islander residents-760,416,665.9 -747,474,746.7 30.3 Median age for Other race residents56.5 31.2 20.1 Median age for Two or more races residents21.8 11.0 56.3 Median age for White alone residents55.3 59.9 23.4 Median age for Hispanic or Latino residents16.8 29.8
Owner/renter occupied households by race in Willow Street
House owners and renters - White residents 1,744 47.7% Owner occupied1,912 52.3% Renter occupiedHouse owners and renters - Black or African American residents 32 44.8% Owner occupied39 55.2% Renter occupiedHouse owners and renters - American Indian / Alaska Native residents 96 100.0% Renter occupiedHouse owners and renters - Asian residents 36 100.0% Owner occupiedHouse owners and renters - Other race residents 18 12.2% Owner occupied128 87.8% Renter occupiedHouse owners and renters - Two or more races residents 96 55.8% Owner occupied76 44.2% Renter occupiedHouse owners and renters - White alone residents 1,764 47.2% Owner occupied1,974 52.8% Renter occupiedHouse owners and renters - Hispanic or Latino residents 17 7.4% Owner occupied213 92.6% Renter occupied
Language usage in Willow Street
English speakers - Total 93.5% of residents of Willow Street speak English at home.
4.7% of residents speak Spanish at home 446 100.0% Speak English very well2.3% of residents speak other language at home 170 79.4% Speak English very well44 20.6% Speak English less than very well
English speakers - Born in the United States 90.6% of residents of Willow Street speak English at home.
6.8% of residents speak Spanish at home 185 100.0% Speak English very well1.9% of residents speak other language at home 53 100.0% Speak English very well
English speakers - Native, born elsewhere 19.8% of residents of Willow Street speak English at home.
63.7% of residents speak Spanish at home 58 100.0% Speak English very well11.0% of residents speak other language at home 10 100.0% Speak English very well
English speakers - Foreign-born 63.7% of residents of Willow Street speak English at home.
26.0% of residents speak Spanish at home 141 100.0% Speak English very well21.2% of residents speak other language at home 78 67.8% Speak English very well37 32.2% Speak English less than very well
White (Caucasian) - Speak only English Native:
98.4% (7,544)Foreign-born:
73.0% (54)
White (Caucasian) - Speak another language Native:
1.4% (108)Foreign-born:
39.7% (29)
Asian - Speak only English Native:
100.0% (41)Foreign-born:
78.7% (241)
Other race - Speak another language Native:
77.2% (318)Foreign-born:
86.0% (3)
Two or more races - Speak only English Native:
100.0% (419)Foreign-born:
14.1% (21)
White alone - Speak only English Native:
98.0% (7,619)Foreign-born:
64.4% (58)
White alone - Speak another language Native:
1.2% (94)Foreign-born:
40.6% (37)
Hispanic or Latino - Speak another language Native:
43.6% (223)Foreign-born:
99.2% (100)
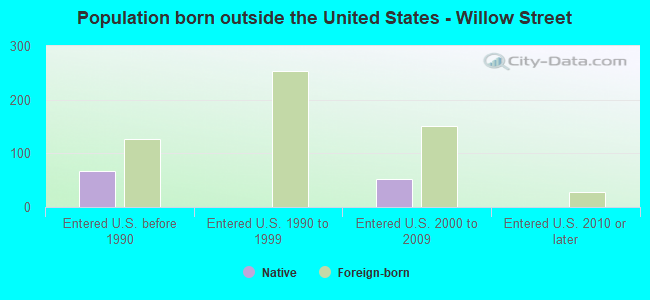
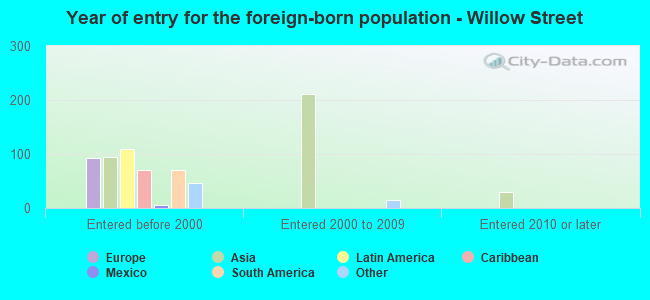
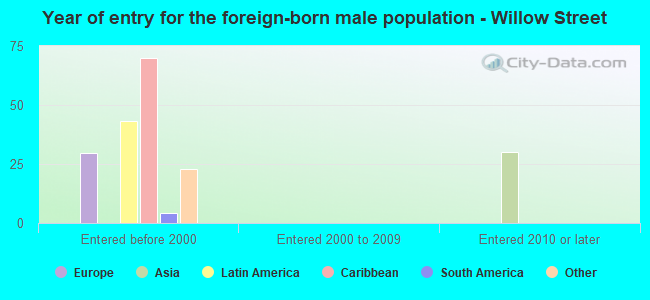
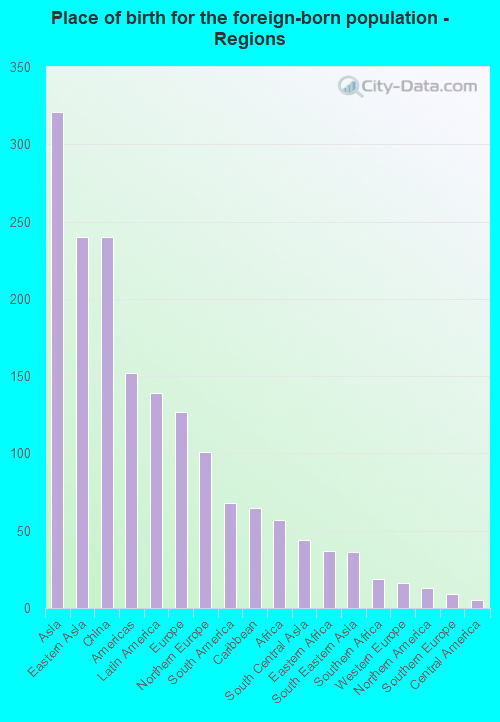
Foreign-born residents in Willow Street 659 residents are foreign born (3.2% Asia , 1.4% Latin America , 1.3% Europe ).
This city:
6.8%Pennsylvania:
7.3%
Marital status for residents in Willow Street Marital status - White (Caucasian) population 15 years and over
Males 18.6% Never married63.4% Now married3.2% Separated10.4% Widowed4.3% DivorcedFemales 19.4% Never married58.5% Now married2.6% Separated14.2% Widowed5.3% DivorcedWomen who gave birth in the past 12 months Now married:
98.5% (62)Unmarried:
1.5% (1)
Women who did not give birth in the past 12 months Now married:
51.8% (662)Unmarried:
48.2% (615)
Marital status - Black or African American population 15 years and over
Males 52.1% Never married47.9% Now married0.0% Separated0.0% Widowed0.0% DivorcedFemales 9.2% Never married90.8% Now married0.0% Separated0.0% Widowed0.0% DivorcedWomen who did not give birth in the past 12 months Now married:
70.8% (17)Unmarried:
29.2% (7)
Marital status - American Indian / Alaska Native population 15 years and over
Males 100.0% Never married0.0% Now married0.0% Separated0.0% Widowed0.0% DivorcedFemales 96.9% Never married0.0% Now married0.0% Separated0.0% Widowed3.1% DivorcedWomen who did not give birth in the past 12 months Now married:
0.0% (0)Unmarried:
100.0% (113)
Marital status - Asian population 15 years and over
Males 0.0% Never married100.0% Now married0.0% Separated0.0% Widowed0.0% DivorcedFemales 83.8% Never married16.2% Now married0.0% Separated0.0% Widowed0.0% DivorcedWomen who did not give birth in the past 12 months Now married:
8.7% (23)Unmarried:
91.3% (247)
Marital status - Other race population 15 years and over
Males 27.5% Never married62.7% Now married9.9% Separated0.0% Widowed0.0% DivorcedFemales 21.8% Never married30.9% Now married10.9% Separated0.0% Widowed36.4% DivorcedWomen who did not give birth in the past 12 months Now married:
40.0% (75)Unmarried:
60.0% (112)
Marital status - Two or more races population 15 years and over
Males 16.7% Never married83.3% Now married0.0% Separated0.0% Widowed0.0% DivorcedFemales 6.9% Never married51.7% Now married0.0% Separated0.0% Widowed41.4% DivorcedWomen who did not give birth in the past 12 months Now married:
85.7% (70)Unmarried:
14.3% (12)
Marital status - White alone, not Hispanic / Latino population 15 years and over
Males 18.6% Never married63.4% Now married3.2% Separated10.4% Widowed4.3% DivorcedFemales 19.5% Never married58.3% Now married2.6% Separated14.3% Widowed5.3% DivorcedWomen who gave birth in the past 12 months Now married:
98.5% (64)Unmarried:
1.5% (1)
Women who did not give birth in the past 12 months Now married:
51.8% (683)Unmarried:
48.2% (634)
Marital status - Hispanic or Latino population 15 years and over
Males 10.9% Never married80.6% Now married8.5% Separated0.0% Widowed0.0% DivorcedFemales 38.0% Never married28.7% Now married7.0% Separated0.0% Widowed26.4% DivorcedWomen who did not give birth in the past 12 months Now married:
28.8% (63)Unmarried:
71.2% (155)
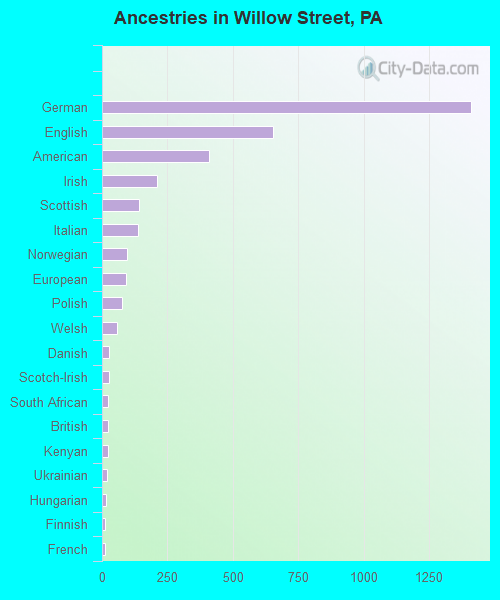
Ancestries in Willow Street
1,409 32.6% German655 15.1% English409 9.5% American211 4.9% Irish142 3.3% Scottish136 3.1% Italian97 2.2% Norwegian93 2.1% European76 1.8% Polish58 1.3% Welsh26 0.6% Danish25 0.6% Scotch-Irish23 0.5% South African22 0.5% British22 0.5% Kenyan19 0.4% Ukrainian14 0.3% Hungarian13 0.3% Finnish13 0.3% French11 0.3% Pennsylvania German10 0.2% Scandinavian7 0.2% Slovak7 0.2% Swiss5 0.1% Swedish2 0.05% Greek
Children Nativity (place of birth) in Willow Street
Children under 6 years - Living with two parents Both parents native 212 100.0% NativeChildren under 6 years - Living with one parent Foreign-born parent 127 100.0% NativeChildren 6 to 17 years - Living with two parents Both parents native 785 88.3% Native104 11.7% Foreign-bornBoth parents foreign-born 33 100.0% NativeOne native, one foreign-born parent 146 100.0% NativeChildren 6 to 17 years - Living with one parent Native parent 112 100.0% Native
Grandparents responsible for own grandchildren in Willow Street
Grandparents (30 to 59 years) White / Caucasian 14 100.0% Not responsible for grandchildrenWhite alone, not Hispanic / Latino 16 100.0% Not responsible for grandchildrenGrandparents (60 years and over) White / Caucasian 14 67.6% Responsible for grandchildren7 32.4% Not responsible for grandchildrenWhite alone, not Hispanic / Latino 14 66.7% Responsible for grandchildren7 33.3% Not responsible for grandchildren