Races in Williamsburg, Florida (FL) Detailed Stats
Ancestries, Foreign-born residents, place of birth
Settings
X


Recent posts about races in Williamsburg, Florida on our local forum with over 2,400,000 registered users:
 | Drivers License Data: Miami Growth Continued In 2023 (27 replies) |
| How can Miami keep it's Latin/International culture vibe while growing? (79 replies) |
| New York Transplant - Feeling Out of Place (50 replies) |
| Moving out of Florida or US entirely? (38 replies) |
| Best city/neighborhood for young family (21 replies) |
| Location recommendatons for a Mom with 2 teen girls (102 replies) |
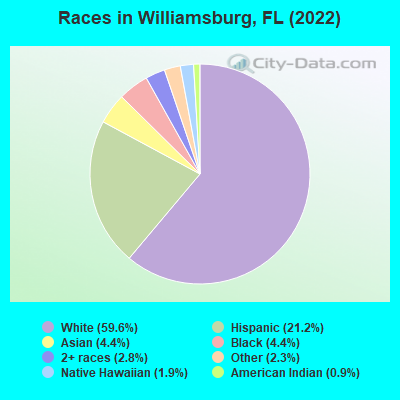
According to 2022 data, the most numerous races in Williamsburg, FL are White alone (4,187 residents), Hispanic (1,492 residents), and Black alone (306 residents). 73.1% of Williamsburg residents speak English at home. 22.0% of Williamsburg, FL residents are foreign-born (7.1% born in Latin America, 5.0% born in Asia, 3.7% born in Europe, 3.0% born in Oceania), which is 4.4% greater than the foreign-born rate of 21.0% across the entire state of Florida.
Race distribution in Williamsburg
2000
2022

- 5,59883.1%White alone
- 6389.5%Hispanic
- 2583.8%Asian alone
- 1151.7%Black alone
- 911.4%Two or more races
- 210.3%Other race alone
- 100.1%Native Hawaiian and Other
Pacific Islander alone - 50.07%American Indian alone

-
- 4,18759.6%White alone
- 1,49221.2%Hispanic
- 3064.4%Black alone
- 3084.4%Asian alone
- 1982.8%Two or more races
- 1602.3%Other race alone
- 1341.9%Native Hawaiian and Other
Pacific Islander alone - 620.9%American Indian alone
2000
2022
-
- 10,458,50965.4%White alone
- 2,682,71516.8%Hispanic
- 2,264,26814.2%Black alone
- 261,6931.6%Asian alone
- 236,9541.5%Two or more races
- 42,3580.3%American Indian alone
- 28,9940.2%Other race alone
- 6,8870.04%Native Hawaiian and Other
Pacific Islander alone

-
- 11,309,40350.8%White alone
- 6,025,03927.1%Hispanic
- 3,241,01514.6%Black alone
- 861,6303.9%Two or more races
- 623,6922.8%Asian alone
- 152,0540.7%Other race alone
- 22,5040.1%American Indian alone
- 9,4860.04%Native Hawaiian and Other
Pacific Islander alone

Income and house value in Williamsburg
- Median household income in 2022
- $79,170White non-Hispanic householders
- $94,500Asian householders
- $54,795Some other race householders
- $77,832Two or more races householders
- $51,333Hispanic or Latino race householders
- Median 2022 house value
- $316,756White Non-Hispanic householders
- $403,445Black or African American householders
- $401,645Asian householders
- $412,443Native Hawaiian and other Pacific Islander householders
- $281,961Some other race householders
- $412,443Two or more races householders
- $391,146Hispanic or Latino householders
Household income for White non-Hispanic householders

Household income for Black householders

Household income for Asian householders

Household income for Some other race householders

Household income for Two or more races householders

Household income for Hispanic or Latino race householders

Median age by race in Williamsburg
- 49.4Median age for White residents
- 53.4Males
- 44.3Females
- 54.7Median age for Black or African American residents
- 55.1Males
- 54.6Females
- -614,300,100.1Median age for American Indian / Alaska Native residents
- -735,632,183.2Males
- -529,680,364.8Females
- 58.1Median age for Asian residents
- 54.7Males
- 59.6Females
- 41.1Median age for Native Hawaiian / Pacific Islander residents
- 33.5Males
- -611,111,110.5Females
- 44.7Median age for Other race residents
- 44.9Males
- 57.9Females
- 54.8Median age for Two or more races residents
- 39.6Males
- 66.1Females
- 46.9Median age for White alone residents
- 49.6Males
- 44.5Females
- 55.2Median age for Hispanic or Latino residents
- 55.8Males
- 54.9Females
Owner/renter occupied households by race in Williamsburg
- House owners and renters - White residents
- 1,96889.3%Owner occupied
- 23610.7%Renter occupied
- House owners and renters - Black or African American residents
- 142100.0%Owner occupied
- House owners and renters - American Indian / Alaska Native residents
- 28100.0%Owner occupied
- House owners and renters - Asian residents
- 158100.0%Owner occupied
- House owners and renters - Native Hawaiian / Pacific Islander residents
- 45100.0%Renter occupied
- House owners and renters - Other race residents
- 9939.6%Owner occupied
- 15160.4%Renter occupied
- House owners and renters - Two or more races residents
- 31270.8%Owner occupied
- 12929.2%Renter occupied
- House owners and renters - White alone residents
- 1,76186.2%Owner occupied
- 28213.8%Renter occupied
- House owners and renters - Hispanic or Latino residents
- 73689.7%Owner occupied
- 8510.3%Renter occupied
Language usage in Williamsburg
- English speakers - Total
- 73.1% of residents of Williamsburg speak English at home.
- 12.9% of residents speak Spanish at home
- 59369.2%Speak English very well
- 26430.8%Speak English less than very well
- 14.4% of residents speak other language at home
- 48050.0%Speak English very well
- 48050.0%Speak English less than very well
- English speakers - Born in the United States
- 92.3% of residents of Williamsburg speak English at home.
- 6.4% of residents speak Spanish at home
- 21186.1%Speak English very well
- 3413.9%Speak English less than very well
- 1.4% of residents speak other language at home
- 52100.0%Speak English very well
- English speakers - Native, born elsewhere
- 29.3% of residents of Williamsburg speak English at home.
- 76.2% of residents speak Spanish at home
- 19191.8%Speak English very well
- 178.2%Speak English less than very well
- English speakers - Foreign-born
- 20.2% of residents of Williamsburg speak English at home.
- 22.8% of residents speak Spanish at home
- 12435.9%Speak English very well
- 22164.1%Speak English less than very well
- 57.3% of residents speak other language at home
- 39846.0%Speak English very well
- 46754.0%Speak English less than very well
White (Caucasian) - Speak only English
| Native: | 100.0% (3,582) |
| Foreign-born: | 31.1% (102) |
White (Caucasian) - Speak another language
| Native: | 3.2% (113) |
| Foreign-born: | 71.2% (233) |
Black or African American - Speak only English
| Native: | 98.6% (237) |
| Foreign-born: | 69.5% (45) |
Asian - Speak only English
| Native: | 100.0% (51) |
| Foreign-born: | 41.6% (118) |
Other race - Speak another language
| Native: | 51.8% (26) |
| Foreign-born: | 100.0% (307) |
Two or more races - Speak another language
| Native: | 67.1% (536) |
| Foreign-born: | 100.0% (247) |
White alone - Speak only English
| Native: | 96.3% (3,440) |
| Foreign-born: | 27.8% (120) |
White alone - Speak another language
| Native: | 3.8% (135) |
| Foreign-born: | 71.2% (308) |
Hispanic or Latino - Speak another language
| Native: | 45.1% (443) |
| Foreign-born: | 100.0% (376) |
Foreign-born residents in Williamsburg
1,545 residents are foreign born (7.1% Latin America, 5.0% Asia, 3.7% Europe, 3.0% Oceania).
| This city: | 22.0% |
| Florida: | 21.1% |


Marital status for residents in Williamsburg
Marital status - White (Caucasian) population 15 years and over
- Males
- 26.9%Never married
- 57.1%Now married
- 4.6%Separated
- 3.0%Widowed
- 8.3%Divorced
- Females
- 28.9%Never married
- 46.5%Now married
- 1.1%Separated
- 9.9%Widowed
- 13.6%Divorced
Women who gave birth in the past 12 months
| Now married: | 100.0% (34) |
| Unmarried: | 0.0% (0) |
Women who did not give birth in the past 12 months
| Now married: | 47.6% (421) |
| Unmarried: | 52.4% (463) |
Marital status - Black or African American population 15 years and over
- Males
- 51.2%Never married
- 30.1%Now married
- 0.0%Separated
- 7.2%Widowed
- 11.4%Divorced
- Females
- 62.1%Never married
- 25.7%Now married
- 0.0%Separated
- 0.0%Widowed
- 12.1%Divorced
Women who did not give birth in the past 12 months
| Now married: | 0.0% (0) |
| Unmarried: | 100.0% (65) |
Marital status - American Indian / Alaska Native population 15 years and over
- Males
- 100.0%Never married
- 0.0%Now married
- 0.0%Separated
- 0.0%Widowed
- 0.0%Divorced
- Females
- 100.0%Never married
- 0.0%Now married
- 0.0%Separated
- 0.0%Widowed
- 0.0%Divorced
Women who did not give birth in the past 12 months
| Now married: | 0.0% (0) |
| Unmarried: | 100.0% (31) |
Marital status - Asian population 15 years and over
- Males
- 48.4%Never married
- 27.8%Now married
- 0.0%Separated
- 23.8%Widowed
- 0.0%Divorced
- Females
- 0.0%Never married
- 81.2%Now married
- 0.0%Separated
- 15.1%Widowed
- 3.8%Divorced
Women who did not give birth in the past 12 months
| Now married: | 100.0% (70) |
| Unmarried: | 0.0% (0) |
Marital status - Native Hawaiian / Pacific Islander population 15 years and over
- Males
- 54.5%Never married
- 45.5%Now married
- 0.0%Separated
- 0.0%Widowed
- 0.0%Divorced
- Females
- 0.0%Never married
- 100.0%Now married
- 0.0%Separated
- 0.0%Widowed
- 0.0%Divorced
Women who did not give birth in the past 12 months
| Now married: | 100.0% (32) |
| Unmarried: | 0.0% (0) |
Marital status - Other race population 15 years and over
- Males
- 4.8%Never married
- 28.2%Now married
- 0.0%Separated
- 0.0%Widowed
- 67.0%Divorced
- Females
- 0.0%Never married
- 54.4%Now married
- 0.0%Separated
- 0.0%Widowed
- 45.6%Divorced
Women who did not give birth in the past 12 months
| Now married: | 100.0% (22) |
| Unmarried: | 0.0% (0) |
Marital status - Two or more races population 15 years and over
- Males
- 60.5%Never married
- 31.5%Now married
- 0.0%Separated
- 7.9%Widowed
- 0.0%Divorced
- Females
- 12.4%Never married
- 58.5%Now married
- 0.0%Separated
- 17.0%Widowed
- 12.1%Divorced
Women who did not give birth in the past 12 months
| Now married: | 27.2% (36) |
| Unmarried: | 72.8% (96) |
Marital status - White alone, not Hispanic / Latino population 15 years and over
- Males
- 30.3%Never married
- 53.3%Now married
- 5.2%Separated
- 3.4%Widowed
- 7.8%Divorced
- Females
- 29.1%Never married
- 46.9%Now married
- 1.3%Separated
- 7.7%Widowed
- 15.1%Divorced
Women who gave birth in the past 12 months
| Now married: | 100.0% (12) |
| Unmarried: | 0.0% (0) |
Women who did not give birth in the past 12 months
| Now married: | 48.7% (466) |
| Unmarried: | 51.3% (490) |
Marital status - Hispanic or Latino population 15 years and over
- Males
- 24.4%Never married
- 57.6%Now married
- 0.0%Separated
- 5.2%Widowed
- 12.7%Divorced
- Females
- 16.0%Never married
- 52.9%Now married
- 0.0%Separated
- 18.5%Widowed
- 12.6%Divorced
Women who gave birth in the past 12 months
| Now married: | 100.0% (30) |
| Unmarried: | 0.0% (0) |
Women who did not give birth in the past 12 months
| Now married: | 49.5% (96) |
| Unmarried: | 50.5% (98) |
Ancestries in Williamsburg

- 39211.1%German
- 2888.1%Italian
- 2497.0%English
- 2276.4%American
- 1434.0%Irish
- 1333.8%Polish
- 1022.9%Swedish
- 691.9%Brazilian
- 641.8%Moroccan
- 631.8%Russian
- 501.4%Lebanese
- 411.2%Greek
- 401.1%Scotch-Irish
- 361.0%French
- 341.0%European
- 330.9%Norwegian
- 270.8%Ukrainian
- 250.7%Romanian
- 240.7%Haitian
- 200.6%Armenian
- 200.6%Jamaican
- 150.4%Lithuanian
- 140.4%West Indian
- 100.3%Austrian
- 70.2%Yugoslavian
- 40.1%Iranian
- 30.08%Eastern European

Geographical mobility in Williamsburg

- Same house 1 year ago
- 3,78592.7%White (Caucasian)
- 24981.8%Black or African American
- 114100.0%American Indian / Alaska Native
- 31493.2%Asian
- 226100.0%Native Hawaiian / Pacific Islander
- 34195.5%Other race
- 69264.3%Two or more races
- 3,89693.2%White alone, not Hispanic / Latino
- 1,13778.6%Hispanic or Latino

-
- Moved within same county
- 1263.1%White / Caucasian
- 4815.8%Black or African American
- 133.6%Other race
- 13612.6%Two or more races
- 1142.7%White alone, not Hispanic / Latino
- 1218.4%Hispanic or Latino

-
- Moved within same state
- 541.3%White / Caucasian
- 807.4%Two or more races
- 601.4%White alone, not Hispanic / Latino
- 533.6%Hispanic or Latino

-
- Moved from different state
- 972.4%White / Caucasian
- 20.7%Black or African American
- 3510.3%Asian
- 1039.5%Two or more races
- 832.0%White alone, not Hispanic / Latino
- 14810.2%Hispanic or Latino

-
- Moved from abroad
- 290.7%White
- 201.9%Two or more races
- 451.1%White alone, not Hispanic / Latino
- 120.8%Hispanic or Latino

Children Nativity (place of birth) in Williamsburg
Place of birth for residents in Williamsburg
![Place of birth for the foreign-born population - Regions]()
- 539Americas
- 517Latin America
- 362Asia
- 351South America
- 267Europe
- 219Oceania
- 157Africa
- 157Northern Africa
- 154South Eastern Asia
- 125Eastern Asia
- 112Eastern Europe
- 103Caribbean
- 76Western Asia
- 71Western Europe
- 70China
- 62Central America
- 54Northern Europe
- 28Southern Europe
- 22Northern America
- 5South Central Asia

![Place of birth for the foreign-born population - Countries]()
- 219Micronesia
- 166Brazil
- 140Colombia
- 110Morocco
- 80Philippines
- 74Vietnam
- 70China
- 57Germany
- 47Russia
- 47Japan
- 45Mexico
- 45Venezuela
- 41Algeria
- 38Turkey
- 37Lebanon
- 33Romania
- 33Cuba
- 31Bulgaria
- 28Spain
- 26Dominican Republic
- 25Norway
- 23Haiti
- 22Canada
- 21England
- 20Jamaica
- 16Panama
- 13France
- 8United Kingdom
- 7Korea
- 5Iran

Grandparents responsible for own grandchildren in Williamsburg
Zip codes: 32821.