Races in Westview, Florida (FL) Detailed Stats
Data:
Races - White alone (%)
Races - White alone (% change since 2000)
Races - Black alone (%)
Races - Black alone (% change since 2000)
Races - American Indian alone (%)
Races - American Indian alone (% change since 2000)
Races - Asian alone (%)
Races - Asian alone (% change since 2000)
Races - Hispanic (%)
Races - Hispanic (% change since 2000)
Races - Native Hawaiian and Other Pacific Islander alone (%)
Races - Native Hawaiian and Other Pacific Islander alone (% change since 2000)
Races - Two or more races(%)
Races - Two or more races(% change since 2000)
Races - Other race alone (%)
Races - Other race alone (% change since 2000)
Racial diversity
Place of birth - Born in state of residence (%)
Place of birth - Born in state of residence (%) - White
Place of birth - Born in state of residence (%) - Black or African American
Place of birth - Born in state of residence (%) - Asian
Place of birth - Born in state of residence (%) - Hispanic or Latino
Place of birth - Born in state of residence (%) - American Indian and Alaska Native
Place of birth - Born in state of residence (%) - Multirace
Place of birth - Born in state of residence (%) - Other Race
Place of birth - Born in other state (%)
Place of birth - Born in other state (%) - White
Place of birth - Born in other state (%) - Black or African American
Place of birth - Born in other state (%) - Asian
Place of birth - Born in other state (%) - Hispanic or Latino
Place of birth - Born in other state (%) - American Indian and Alaska Native
Place of birth - Born in other state (%) - Multirace
Place of birth - Born in other state (%) - Other Race
Place of birth - Native, outside of US (%)
Place of birth - Native, outside of US (%) - White
Place of birth - Native, outside of US (%) - Black or African American
Place of birth - Native, outside of US (%) - Asian
Place of birth - Native, outside of US (%) - Hispanic or Latino
Place of birth - Native, outside of US (%) - American Indian and Alaska Native
Place of birth - Native, outside of US (%) - Multirace
Place of birth - Native, outside of US (%) - Other Race
Place of birth - Foreign born (%)
Place of birth - Foreign born (%) - White
Place of birth - Foreign born (%) - Black or African American
Place of birth - Foreign born (%) - Asian
Place of birth - Foreign born (%) - Hispanic or Latino
Place of birth - Foreign born (%) - American Indian and Alaska Native
Place of birth - Foreign born (%) - Multirace
Place of birth - Foreign born (%) - Other Race
Residents speaking English at home (%)
Residents speaking English at home - Born in the United States (%)
Residents speaking English at home - Native, born elsewhere (%)
Residents speaking English at home - Foreign born (%)
Residents speaking Spanish at home (%)
Residents speaking Spanish at home - Born in the United States (%)
Residents speaking Spanish at home - Native, born elsewhere (%)
Residents speaking Spanish at home - Foreign born (%)
Residents speaking other language at home (%)
Residents speaking other language at home - Born in the United States (%)
Residents speaking other language at home - Native, born elsewhere (%)
Residents speaking other language at home - Foreign born (%)
Marital status - Never married (%)
Marital status - Now married (%)
Marital status - Separated (%)
Marital status - Widowed (%)
Marital status - Divorced (%)
Ancestries Reported - Arab (%)
Ancestries Reported - Czech (%)
Ancestries Reported - Danish (%)
Ancestries Reported - Dutch (%)
Ancestries Reported - English (%)
Ancestries Reported - French (%)
Ancestries Reported - French Canadian (%)
Ancestries Reported - German (%)
Ancestries Reported - Greek (%)
Ancestries Reported - Hungarian (%)
Ancestries Reported - Irish (%)
Ancestries Reported - Italian (%)
Ancestries Reported - Lithuanian (%)
Ancestries Reported - Norwegian (%)
Ancestries Reported - Polish (%)
Ancestries Reported - Portuguese (%)
Ancestries Reported - Russian (%)
Ancestries Reported - Scotch-Irish (%)
Ancestries Reported - Scottish (%)
Ancestries Reported - Slovak (%)
Ancestries Reported - Subsaharan African (%)
Ancestries Reported - Swedish (%)
Ancestries Reported - Swiss (%)
Ancestries Reported - Ukrainian (%)
Ancestries Reported - United States (%)
Ancestries Reported - Welsh (%)
Ancestries Reported - West Indian (%)
Ancestries Reported - Other (%)
Geographical mobility - Same house 1 year ago (%)
Geographical mobility - Same house 1 year ago (%) - White
Geographical mobility - Same house 1 year ago (%) - Black or African American
Geographical mobility - Same house 1 year ago (%) - Asian
Geographical mobility - Same house 1 year ago (%) - Hispanic or Latino
Geographical mobility - Same house 1 year ago (%) - American Indian and Alaska Native
Geographical mobility - Same house 1 year ago (%) - Multirace
Geographical mobility - Same house 1 year ago (%) - Other Race
Geographical mobility - Moved within same county (%)
Geographical mobility - Moved within same county (%) - White
Geographical mobility - Moved within same county (%) - Black or African American
Geographical mobility - Moved within same county (%) - Asian
Geographical mobility - Moved within same county (%) - Hispanic or Latino
Geographical mobility - Moved within same county (%) - American Indian and Alaska Native
Geographical mobility - Moved within same county (%) - Multirace
Geographical mobility - Moved within same county (%) - Other Race
Geographical mobility - Moved from different county within same state (%)
Geographical mobility - Moved from different county within same state (%) - White
Geographical mobility - Moved from different county within same state (%) - Black or African American
Geographical mobility - Moved from different county within same state (%) - Asian
Geographical mobility - Moved from different county within same state (%) - Hispanic or Latino
Geographical mobility - Moved from different county within same state (%) - American Indian and Alaska Native
Geographical mobility - Moved from different county within same state (%) - Multirace
Geographical mobility - Moved from different county within same state (%) - Other Race
Geographical mobility - Moved from different state (%)
Geographical mobility - Moved from different state (%) - White
Geographical mobility - Moved from different state (%) - Black or African American
Geographical mobility - Moved from different state (%) - Asian
Geographical mobility - Moved from different state (%) - Hispanic or Latino
Geographical mobility - Moved from different state (%) - American Indian and Alaska Native
Geographical mobility - Moved from different state (%) - Multirace
Geographical mobility - Moved from different state (%) - Other Race
Geographical mobility - Moved from abroad (%)
Geographical mobility - Moved from abroad (%) - White
Geographical mobility - Moved from abroad (%) - Black or African American
Geographical mobility - Moved from abroad (%) - Asian
Geographical mobility - Moved from abroad (%) - Hispanic or Latino
Geographical mobility - Moved from abroad (%) - American Indian and Alaska Native
Geographical mobility - Moved from abroad (%) - Multirace
Geographical mobility - Moved from abroad (%) - Other Race
Place of birth for the foreign-born population - Ireland (%)
Place of birth for the foreign-born population - Denmark (%)
Place of birth for the foreign-born population - Norway (%)
Place of birth for the foreign-born population - Sweden (%)
Place of birth for the foreign-born population - United Kingdom (%)
Place of birth for the foreign-born population - England (%)
Place of birth for the foreign-born population - Scotland (%)
Place of birth for the foreign-born population - Other Northern Europe (%)
Place of birth for the foreign-born population - Austria (%)
Place of birth for the foreign-born population - Belgium (%)
Place of birth for the foreign-born population - France (%)
Place of birth for the foreign-born population - Germany (%)
Place of birth for the foreign-born population - Netherlands (%)
Place of birth for the foreign-born population - Switzerland (%)
Place of birth for the foreign-born population - Other Western Europe (%)
Place of birth for the foreign-born population - Greece (%)
Place of birth for the foreign-born population - Italy (%)
Place of birth for the foreign-born population - Portugal (%)
Place of birth for the foreign-born population - Spain (%)
Place of birth for the foreign-born population - Other Southern Europe (%)
Place of birth for the foreign-born population - Albania (%)
Place of birth for the foreign-born population - Belarus (%)
Place of birth for the foreign-born population - Bosnia and Herzegovina (%)
Place of birth for the foreign-born population - Bulgaria (%)
Place of birth for the foreign-born population - Croatia (%)
Place of birth for the foreign-born population - Czechoslovakia (%)
Place of birth for the foreign-born population - Hungary (%)
Place of birth for the foreign-born population - Latvia (%)
Place of birth for the foreign-born population - Lithuania (%)
Place of birth for the foreign-born population - North Macedonia (Macedonia) (%)
Place of birth for the foreign-born population - Moldova (%)
Place of birth for the foreign-born population - Poland (%)
Place of birth for the foreign-born population - Romania (%)
Place of birth for the foreign-born population - Russia (%)
Place of birth for the foreign-born population - Serbia (%)
Place of birth for the foreign-born population - Ukraine (%)
Place of birth for the foreign-born population - Other Eastern Europe (%)
Place of birth for the foreign-born population - China (%)
Place of birth for the foreign-born population - Hong Kong (%)
Place of birth for the foreign-born population - Taiwan (%)
Place of birth for the foreign-born population - Japan (%)
Place of birth for the foreign-born population - Korea (%)
Place of birth for the foreign-born population - Other Eastern Asia (%)
Place of birth for the foreign-born population - Afghanistan (%)
Place of birth for the foreign-born population - Bangladesh (%)
Place of birth for the foreign-born population - India (%)
Place of birth for the foreign-born population - Iran (%)
Place of birth for the foreign-born population - Kazakhstan (%)
Place of birth for the foreign-born population - Nepal (%)
Place of birth for the foreign-born population - Pakistan (%)
Place of birth for the foreign-born population - Sri Lanka (%)
Place of birth for the foreign-born population - Uzbekistan (%)
Place of birth for the foreign-born population - Other South Central Asia (%)
Place of birth for the foreign-born population - Burma (%)
Place of birth for the foreign-born population - Cambodia (%)
Place of birth for the foreign-born population - Indonesia (%)
Place of birth for the foreign-born population - Laos (%)
Place of birth for the foreign-born population - Malaysia (%)
Place of birth for the foreign-born population - Philippines (%)
Place of birth for the foreign-born population - Singapore (%)
Place of birth for the foreign-born population - Thailand (%)
Place of birth for the foreign-born population - Vietnam (%)
Place of birth for the foreign-born population - Other South Eastern Asia (%)
Place of birth for the foreign-born population - Armenia (%)
Place of birth for the foreign-born population - Iraq (%)
Place of birth for the foreign-born population - Israel (%)
Place of birth for the foreign-born population - Jordan (%)
Place of birth for the foreign-born population - Kuwait (%)
Place of birth for the foreign-born population - Lebanon (%)
Place of birth for the foreign-born population - Saudi Arabia (%)
Place of birth for the foreign-born population - Syria (%)
Place of birth for the foreign-born population - Turkey (%)
Place of birth for the foreign-born population - Yemen (%)
Place of birth for the foreign-born population - Other Western Asia (%)
Place of birth for the foreign-born population - Eritrea (%)
Place of birth for the foreign-born population - Ethiopia (%)
Place of birth for the foreign-born population - Kenya (%)
Place of birth for the foreign-born population - Somalia (%)
Place of birth for the foreign-born population - Uganda (%)
Place of birth for the foreign-born population - Zimbabwe (%)
Place of birth for the foreign-born population - Other Eastern Africa (%)
Place of birth for the foreign-born population - Cameroon (%)
Place of birth for the foreign-born population - Congo (%)
Place of birth for the foreign-born population - Democratic Republic of Congo (Zaire) (%)
Place of birth for the foreign-born population - Other Middle Africa (%)
Place of birth for the foreign-born population - Egypt (%)
Place of birth for the foreign-born population - Morocco (%)
Place of birth for the foreign-born population - Sudan (%)
Place of birth for the foreign-born population - Other Northern Africa (%)
Place of birth for the foreign-born population - South Africa (%)
Place of birth for the foreign-born population - Other Southern Africa (%)
Place of birth for the foreign-born population - Cabo Verde (%)
Place of birth for the foreign-born population - Ghana (%)
Place of birth for the foreign-born population - Liberia (%)
Place of birth for the foreign-born population - Nigeria (%)
Place of birth for the foreign-born population - Senegal (%)
Place of birth for the foreign-born population - Sierra Leone (%)
Place of birth for the foreign-born population - Other Western Africa (%)
Place of birth for the foreign-born population - Australia (%)
Place of birth for the foreign-born population - New Zealand (%)
Place of birth for the foreign-born population - Fiji (%)
Place of birth for the foreign-born population - Micronesia (%)
Place of birth for the foreign-born population - Bahamas (%)
Place of birth for the foreign-born population - Barbados (%)
Place of birth for the foreign-born population - Cuba (%)
Place of birth for the foreign-born population - Dominica (%)
Place of birth for the foreign-born population - Dominican Republic (%)
Place of birth for the foreign-born population - Grenada (%)
Place of birth for the foreign-born population - Haiti (%)
Place of birth for the foreign-born population - Jamaica (%)
Place of birth for the foreign-born population - St. Vincent and the Grenadines (%)
Place of birth for the foreign-born population - Trinidad and Tobago (%)
Place of birth for the foreign-born population - West Indies (%)
Place of birth for the foreign-born population - Other Caribbean (%)
Place of birth for the foreign-born population - Belize (%)
Place of birth for the foreign-born population - Costa Rica (%)
Place of birth for the foreign-born population - El Salvador (%)
Place of birth for the foreign-born population - Guatemala (%)
Place of birth for the foreign-born population - Honduras (%)
Place of birth for the foreign-born population - Mexico (%)
Place of birth for the foreign-born population - Nicaragua (%)
Place of birth for the foreign-born population - Panama (%)
Place of birth for the foreign-born population - Other Central America (%)
Place of birth for the foreign-born population - Argentina (%)
Place of birth for the foreign-born population - Bolivia (%)
Place of birth for the foreign-born population - Brazil (%)
Place of birth for the foreign-born population - Chile (%)
Place of birth for the foreign-born population - Colombia (%)
Place of birth for the foreign-born population - Ecuador (%)
Place of birth for the foreign-born population - Guyana (%)
Place of birth for the foreign-born population - Peru (%)
Place of birth for the foreign-born population - Uruguay (%)
Place of birth for the foreign-born population - Venezuela (%)
Place of birth for the foreign-born population - Other South America (%)
Place of birth for the foreign-born population - Canada (%)
Place of birth for the foreign-born population - Other Northern America (%)
Place of birth for the foreign-born population - Other (%)
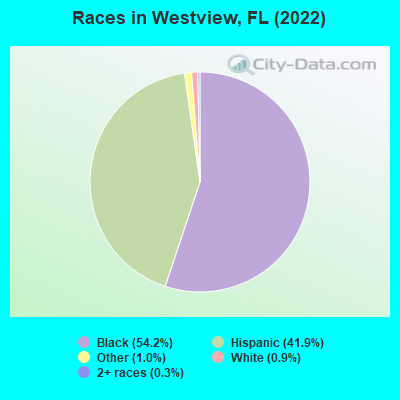
According to 2022 data, the most numerous races in Westview, FL are White alone (97 residents), Hispanic (4,584 residents), and Black alone (5,929 residents). 45.9% of Westview residents speak English at home. 41.9% of Westview, FL residents are foreign-born (41.5% born in Latin America), which is 49.9% greater than the foreign-born rate of 21.0% across the entire state of Florida.
Race distribution in Westview
2000 2022
10,458,509 65.4% White alone 2,682,715 16.8% Hispanic 2,264,268 14.2% Black alone 261,693 1.6% Asian alone 236,954 1.5% Two or more races 42,358 0.3% American Indian alone 28,994 0.2% Other race alone 6,887 0.04% Native Hawaiian and Other
11,309,403 50.8% White alone 6,025,039 27.1% Hispanic 3,241,015 14.6% Black alone 861,630 3.9% Two or more races 623,692 2.8% Asian alone 152,054 0.7% Other race alone 22,504 0.1% American Indian alone 9,486 0.04% Native Hawaiian and Other
Income and house value in Westview Median household income in 2022 $34,097 Black householders$80,160 Two or more races householders$69,175 Hispanic or Latino race householdersMedian 2022 house value $263,132 White Non-Hispanic householders$344,637 Black or African American householders $186,178 Asian householders$337,190 Some other race householders$348,774 Two or more races householders$316,089 Hispanic or Latino householders
Median age by race in Westview
41.9 Median age for White residents43.9 41.5 37.4 Median age for Black or African American residents30.3 43.7 -653,446,647.1 Median age for American Indian / Alaska Native residents-543,352,600.6 -762,696,213.5 -673,333,332.7 Median age for Asian residents-697,674,417.9 -653,626,731.2 -679,849,340.2 Median age for Native Hawaiian / Pacific Islander residents-858,307,848.3 -443,298,968.6 37.3 Median age for Other race residents28.3 37.6 46.3 Median age for Two or more races residents45.7 55.8 60.4 Median age for White alone residents59.6 61.3 45.6 Median age for Hispanic or Latino residents44.1 46.1
Owner/renter occupied households by race in Westview
House owners and renters - White residents 356 76.2% Owner occupied111 23.8% Renter occupiedHouse owners and renters - Black or African American residents 939 48.1% Owner occupied1,015 51.9% Renter occupiedHouse owners and renters - Other race residents 254 51.2% Owner occupied242 48.8% Renter occupiedHouse owners and renters - Two or more races residents 402 72.3% Owner occupied154 27.7% Renter occupiedHouse owners and renters - White alone residents 31 100.0% Owner occupiedHouse owners and renters - Hispanic or Latino residents 1,059 66.0% Owner occupied546 34.0% Renter occupied
Language usage in Westview
English speakers - Total 45.9% of residents of Westview speak English at home.
39.5% of residents speak Spanish at home 1,517 36.5% Speak English very well2,643 63.5% Speak English less than very well15.0% of residents speak other language at home 1,129 71.5% Speak English very well451 28.5% Speak English less than very well
English speakers - Born in the United States 83.4% of residents of Westview speak English at home.
1.9% of residents speak Spanish at home 19 100.0% Speak English very well16.5% of residents speak other language at home 133 81.6% Speak English very well30 18.4% Speak English less than very well
English speakers - Native, born elsewhere 0.0% of residents of Westview speak English at home.
56.7% of residents speak Spanish at home 24 63.2% Speak English very well14 36.8% Speak English less than very well37.3% of residents speak other language at home 25 100.0% Speak English very well
English speakers - Foreign-born 10.9% of residents of Westview speak English at home.
72.5% of residents speak Spanish at home 743 22.5% Speak English very well2,564 77.5% Speak English less than very well16.8% of residents speak other language at home 348 45.4% Speak English very well419 54.6% Speak English less than very well
White (Caucasian) - Speak only English Native:
16.9% (86)Foreign-born:
13.0% (99)
White (Caucasian) - Speak another language Native:
69.7% (355)Foreign-born:
88.2% (674)
Black or African American - Speak only English Native:
84.4% (3,921)Foreign-born:
19.4% (206)
Black or African American - Speak another language Native:
15.7% (727)Foreign-born:
79.6% (843)
Other race - Speak only English Native:
9.8% (4)Foreign-born:
11.0% (122)
Other race - Speak another language Native:
90.2% (37)Foreign-born:
88.9% (987)
Two or more races - Speak only English Native:
23.4% (118)Foreign-born:
3.3% (42)
Two or more races - Speak another language Native:
76.5% (386)Foreign-born:
96.6% (1,248)
White alone - Speak another language Native:
27.0% (20)Foreign-born:
93.5% (24)
Hispanic or Latino - Speak only English Native:
12.9% (125)Foreign-born:
6.7% (232)
Hispanic or Latino - Speak another language Native:
86.9% (839)Foreign-born:
93.5% (3,247)
Foreign-born residents in Westview 4,585 residents are foreign born (41.5% Latin America ).
This city:
41.9%Florida:
21.1%
Marital status for residents in Westview Marital status - White (Caucasian) population 15 years and over
Males 18.6% Never married72.2% Now married0.0% Separated1.8% Widowed7.3% DivorcedFemales 19.6% Never married71.2% Now married1.2% Separated1.3% Widowed6.7% DivorcedWomen who gave birth in the past 12 months Now married:
100.0% (20)Unmarried:
0.0% (0)
Women who did not give birth in the past 12 months Now married:
63.5% (282)Unmarried:
36.5% (162)
Marital status - Black or African American population 15 years and over
Males 61.1% Never married33.2% Now married0.0% Separated0.0% Widowed5.7% DivorcedFemales 50.9% Never married21.9% Now married3.1% Separated13.3% Widowed10.9% DivorcedWomen who gave birth in the past 12 months Now married:
0.0% (0)Unmarried:
100.0% (45)
Women who did not give birth in the past 12 months Now married:
15.1% (168)Unmarried:
84.9% (942)
Marital status - Other race population 15 years and over
Males 16.1% Never married68.4% Now married0.0% Separated0.0% Widowed15.5% DivorcedFemales 8.3% Never married62.7% Now married0.0% Separated21.9% Widowed7.2% DivorcedWomen who did not give birth in the past 12 months Now married:
86.2% (269)Unmarried:
13.8% (43)
Marital status - Two or more races population 15 years and over
Males 36.4% Never married54.9% Now married0.0% Separated0.0% Widowed8.7% DivorcedFemales 19.6% Never married68.9% Now married0.0% Separated0.3% Widowed11.3% DivorcedWomen who did not give birth in the past 12 months Now married:
71.6% (124)Unmarried:
28.4% (49)
Marital status - White alone, not Hispanic / Latino population 15 years and over
Males 26.7% Never married73.3% Now married0.0% Separated0.0% Widowed0.0% DivorcedFemales 23.8% Never married54.8% Now married0.0% Separated0.0% Widowed21.4% DivorcedMarital status - Hispanic or Latino population 15 years and over
Males 25.8% Never married64.8% Now married0.0% Separated0.9% Widowed8.5% DivorcedFemales 15.9% Never married72.1% Now married0.8% Separated5.2% Widowed6.1% DivorcedWomen who gave birth in the past 12 months Now married:
100.0% (36)Unmarried:
0.0% (0)
Women who did not give birth in the past 12 months Now married:
70.4% (765)Unmarried:
29.6% (321)
Ancestries in Westview
1,288 14.7% Haitian384 4.4% American106 1.2% Jamaican62 0.7% English28 0.3% African26 0.3% Brazilian20 0.2% Russian15 0.2% German5 0.06% Trinidadian and Tobagonian2 0.02% British West Indian1 0.01% British
Children Nativity (place of birth) in Westview
Children under 6 years - Living with two parents Both parents native 186 100.0% NativeBoth parents foreign-born 106 100.0% NativeChildren under 6 years - Living with one parent Native parent 169 99.3% Native1 0.7% Foreign-bornForeign-born parent 16 37.8% Native26 62.2% Foreign-bornChildren 6 to 17 years - Living with two parents Both parents native 221 99.1% Native2 0.9% Foreign-bornBoth parents foreign-born 276 77.0% Native82 23.0% Foreign-bornOne native, one foreign-born parent 44 100.0% NativeChildren 6 to 17 years - Living with one parent Native parent 743 100.0% NativeForeign-born parent 235 50.7% Native229 49.3% Foreign-born
Grandparents responsible for own grandchildren in Westview
Grandparents (30 to 59 years) White / Caucasian 46 100.0% Not responsible for grandchildrenBlack or African American 88 100.0% Responsible for grandchildrenHispanic or Latino 70 100.0% Not responsible for grandchildren
Grandparents (60 years and over) Black or African American 4 2.6% Responsible for grandchildren156 97.4% Not responsible for grandchildrenHispanic or Latino 58 100.0% Not responsible for grandchildren