Races in Westgate, Florida (FL) Detailed Stats
Data:
Races - White alone (%)
Races - White alone (% change since 2000)
Races - Black alone (%)
Races - Black alone (% change since 2000)
Races - American Indian alone (%)
Races - American Indian alone (% change since 2000)
Races - Asian alone (%)
Races - Asian alone (% change since 2000)
Races - Hispanic (%)
Races - Hispanic (% change since 2000)
Races - Native Hawaiian and Other Pacific Islander alone (%)
Races - Native Hawaiian and Other Pacific Islander alone (% change since 2000)
Races - Two or more races(%)
Races - Two or more races(% change since 2000)
Races - Other race alone (%)
Races - Other race alone (% change since 2000)
Racial diversity
Place of birth - Born in state of residence (%)
Place of birth - Born in state of residence (%) - White
Place of birth - Born in state of residence (%) - Black or African American
Place of birth - Born in state of residence (%) - Asian
Place of birth - Born in state of residence (%) - Hispanic or Latino
Place of birth - Born in state of residence (%) - American Indian and Alaska Native
Place of birth - Born in state of residence (%) - Multirace
Place of birth - Born in state of residence (%) - Other Race
Place of birth - Born in other state (%)
Place of birth - Born in other state (%) - White
Place of birth - Born in other state (%) - Black or African American
Place of birth - Born in other state (%) - Asian
Place of birth - Born in other state (%) - Hispanic or Latino
Place of birth - Born in other state (%) - American Indian and Alaska Native
Place of birth - Born in other state (%) - Multirace
Place of birth - Born in other state (%) - Other Race
Place of birth - Native, outside of US (%)
Place of birth - Native, outside of US (%) - White
Place of birth - Native, outside of US (%) - Black or African American
Place of birth - Native, outside of US (%) - Asian
Place of birth - Native, outside of US (%) - Hispanic or Latino
Place of birth - Native, outside of US (%) - American Indian and Alaska Native
Place of birth - Native, outside of US (%) - Multirace
Place of birth - Native, outside of US (%) - Other Race
Place of birth - Foreign born (%)
Place of birth - Foreign born (%) - White
Place of birth - Foreign born (%) - Black or African American
Place of birth - Foreign born (%) - Asian
Place of birth - Foreign born (%) - Hispanic or Latino
Place of birth - Foreign born (%) - American Indian and Alaska Native
Place of birth - Foreign born (%) - Multirace
Place of birth - Foreign born (%) - Other Race
Residents speaking English at home (%)
Residents speaking English at home - Born in the United States (%)
Residents speaking English at home - Native, born elsewhere (%)
Residents speaking English at home - Foreign born (%)
Residents speaking Spanish at home (%)
Residents speaking Spanish at home - Born in the United States (%)
Residents speaking Spanish at home - Native, born elsewhere (%)
Residents speaking Spanish at home - Foreign born (%)
Residents speaking other language at home (%)
Residents speaking other language at home - Born in the United States (%)
Residents speaking other language at home - Native, born elsewhere (%)
Residents speaking other language at home - Foreign born (%)
Marital status - Never married (%)
Marital status - Now married (%)
Marital status - Separated (%)
Marital status - Widowed (%)
Marital status - Divorced (%)
Ancestries Reported - Arab (%)
Ancestries Reported - Czech (%)
Ancestries Reported - Danish (%)
Ancestries Reported - Dutch (%)
Ancestries Reported - English (%)
Ancestries Reported - French (%)
Ancestries Reported - French Canadian (%)
Ancestries Reported - German (%)
Ancestries Reported - Greek (%)
Ancestries Reported - Hungarian (%)
Ancestries Reported - Irish (%)
Ancestries Reported - Italian (%)
Ancestries Reported - Lithuanian (%)
Ancestries Reported - Norwegian (%)
Ancestries Reported - Polish (%)
Ancestries Reported - Portuguese (%)
Ancestries Reported - Russian (%)
Ancestries Reported - Scotch-Irish (%)
Ancestries Reported - Scottish (%)
Ancestries Reported - Slovak (%)
Ancestries Reported - Subsaharan African (%)
Ancestries Reported - Swedish (%)
Ancestries Reported - Swiss (%)
Ancestries Reported - Ukrainian (%)
Ancestries Reported - United States (%)
Ancestries Reported - Welsh (%)
Ancestries Reported - West Indian (%)
Ancestries Reported - Other (%)
Geographical mobility - Same house 1 year ago (%)
Geographical mobility - Same house 1 year ago (%) - White
Geographical mobility - Same house 1 year ago (%) - Black or African American
Geographical mobility - Same house 1 year ago (%) - Asian
Geographical mobility - Same house 1 year ago (%) - Hispanic or Latino
Geographical mobility - Same house 1 year ago (%) - American Indian and Alaska Native
Geographical mobility - Same house 1 year ago (%) - Multirace
Geographical mobility - Same house 1 year ago (%) - Other Race
Geographical mobility - Moved within same county (%)
Geographical mobility - Moved within same county (%) - White
Geographical mobility - Moved within same county (%) - Black or African American
Geographical mobility - Moved within same county (%) - Asian
Geographical mobility - Moved within same county (%) - Hispanic or Latino
Geographical mobility - Moved within same county (%) - American Indian and Alaska Native
Geographical mobility - Moved within same county (%) - Multirace
Geographical mobility - Moved within same county (%) - Other Race
Geographical mobility - Moved from different county within same state (%)
Geographical mobility - Moved from different county within same state (%) - White
Geographical mobility - Moved from different county within same state (%) - Black or African American
Geographical mobility - Moved from different county within same state (%) - Asian
Geographical mobility - Moved from different county within same state (%) - Hispanic or Latino
Geographical mobility - Moved from different county within same state (%) - American Indian and Alaska Native
Geographical mobility - Moved from different county within same state (%) - Multirace
Geographical mobility - Moved from different county within same state (%) - Other Race
Geographical mobility - Moved from different state (%)
Geographical mobility - Moved from different state (%) - White
Geographical mobility - Moved from different state (%) - Black or African American
Geographical mobility - Moved from different state (%) - Asian
Geographical mobility - Moved from different state (%) - Hispanic or Latino
Geographical mobility - Moved from different state (%) - American Indian and Alaska Native
Geographical mobility - Moved from different state (%) - Multirace
Geographical mobility - Moved from different state (%) - Other Race
Geographical mobility - Moved from abroad (%)
Geographical mobility - Moved from abroad (%) - White
Geographical mobility - Moved from abroad (%) - Black or African American
Geographical mobility - Moved from abroad (%) - Asian
Geographical mobility - Moved from abroad (%) - Hispanic or Latino
Geographical mobility - Moved from abroad (%) - American Indian and Alaska Native
Geographical mobility - Moved from abroad (%) - Multirace
Geographical mobility - Moved from abroad (%) - Other Race
Place of birth for the foreign-born population - Ireland (%)
Place of birth for the foreign-born population - Denmark (%)
Place of birth for the foreign-born population - Norway (%)
Place of birth for the foreign-born population - Sweden (%)
Place of birth for the foreign-born population - United Kingdom (%)
Place of birth for the foreign-born population - England (%)
Place of birth for the foreign-born population - Scotland (%)
Place of birth for the foreign-born population - Other Northern Europe (%)
Place of birth for the foreign-born population - Austria (%)
Place of birth for the foreign-born population - Belgium (%)
Place of birth for the foreign-born population - France (%)
Place of birth for the foreign-born population - Germany (%)
Place of birth for the foreign-born population - Netherlands (%)
Place of birth for the foreign-born population - Switzerland (%)
Place of birth for the foreign-born population - Other Western Europe (%)
Place of birth for the foreign-born population - Greece (%)
Place of birth for the foreign-born population - Italy (%)
Place of birth for the foreign-born population - Portugal (%)
Place of birth for the foreign-born population - Spain (%)
Place of birth for the foreign-born population - Other Southern Europe (%)
Place of birth for the foreign-born population - Albania (%)
Place of birth for the foreign-born population - Belarus (%)
Place of birth for the foreign-born population - Bosnia and Herzegovina (%)
Place of birth for the foreign-born population - Bulgaria (%)
Place of birth for the foreign-born population - Croatia (%)
Place of birth for the foreign-born population - Czechoslovakia (%)
Place of birth for the foreign-born population - Hungary (%)
Place of birth for the foreign-born population - Latvia (%)
Place of birth for the foreign-born population - Lithuania (%)
Place of birth for the foreign-born population - North Macedonia (Macedonia) (%)
Place of birth for the foreign-born population - Moldova (%)
Place of birth for the foreign-born population - Poland (%)
Place of birth for the foreign-born population - Romania (%)
Place of birth for the foreign-born population - Russia (%)
Place of birth for the foreign-born population - Serbia (%)
Place of birth for the foreign-born population - Ukraine (%)
Place of birth for the foreign-born population - Other Eastern Europe (%)
Place of birth for the foreign-born population - China (%)
Place of birth for the foreign-born population - Hong Kong (%)
Place of birth for the foreign-born population - Taiwan (%)
Place of birth for the foreign-born population - Japan (%)
Place of birth for the foreign-born population - Korea (%)
Place of birth for the foreign-born population - Other Eastern Asia (%)
Place of birth for the foreign-born population - Afghanistan (%)
Place of birth for the foreign-born population - Bangladesh (%)
Place of birth for the foreign-born population - India (%)
Place of birth for the foreign-born population - Iran (%)
Place of birth for the foreign-born population - Kazakhstan (%)
Place of birth for the foreign-born population - Nepal (%)
Place of birth for the foreign-born population - Pakistan (%)
Place of birth for the foreign-born population - Sri Lanka (%)
Place of birth for the foreign-born population - Uzbekistan (%)
Place of birth for the foreign-born population - Other South Central Asia (%)
Place of birth for the foreign-born population - Burma (%)
Place of birth for the foreign-born population - Cambodia (%)
Place of birth for the foreign-born population - Indonesia (%)
Place of birth for the foreign-born population - Laos (%)
Place of birth for the foreign-born population - Malaysia (%)
Place of birth for the foreign-born population - Philippines (%)
Place of birth for the foreign-born population - Singapore (%)
Place of birth for the foreign-born population - Thailand (%)
Place of birth for the foreign-born population - Vietnam (%)
Place of birth for the foreign-born population - Other South Eastern Asia (%)
Place of birth for the foreign-born population - Armenia (%)
Place of birth for the foreign-born population - Iraq (%)
Place of birth for the foreign-born population - Israel (%)
Place of birth for the foreign-born population - Jordan (%)
Place of birth for the foreign-born population - Kuwait (%)
Place of birth for the foreign-born population - Lebanon (%)
Place of birth for the foreign-born population - Saudi Arabia (%)
Place of birth for the foreign-born population - Syria (%)
Place of birth for the foreign-born population - Turkey (%)
Place of birth for the foreign-born population - Yemen (%)
Place of birth for the foreign-born population - Other Western Asia (%)
Place of birth for the foreign-born population - Eritrea (%)
Place of birth for the foreign-born population - Ethiopia (%)
Place of birth for the foreign-born population - Kenya (%)
Place of birth for the foreign-born population - Somalia (%)
Place of birth for the foreign-born population - Uganda (%)
Place of birth for the foreign-born population - Zimbabwe (%)
Place of birth for the foreign-born population - Other Eastern Africa (%)
Place of birth for the foreign-born population - Cameroon (%)
Place of birth for the foreign-born population - Congo (%)
Place of birth for the foreign-born population - Democratic Republic of Congo (Zaire) (%)
Place of birth for the foreign-born population - Other Middle Africa (%)
Place of birth for the foreign-born population - Egypt (%)
Place of birth for the foreign-born population - Morocco (%)
Place of birth for the foreign-born population - Sudan (%)
Place of birth for the foreign-born population - Other Northern Africa (%)
Place of birth for the foreign-born population - South Africa (%)
Place of birth for the foreign-born population - Other Southern Africa (%)
Place of birth for the foreign-born population - Cabo Verde (%)
Place of birth for the foreign-born population - Ghana (%)
Place of birth for the foreign-born population - Liberia (%)
Place of birth for the foreign-born population - Nigeria (%)
Place of birth for the foreign-born population - Senegal (%)
Place of birth for the foreign-born population - Sierra Leone (%)
Place of birth for the foreign-born population - Other Western Africa (%)
Place of birth for the foreign-born population - Australia (%)
Place of birth for the foreign-born population - New Zealand (%)
Place of birth for the foreign-born population - Fiji (%)
Place of birth for the foreign-born population - Micronesia (%)
Place of birth for the foreign-born population - Bahamas (%)
Place of birth for the foreign-born population - Barbados (%)
Place of birth for the foreign-born population - Cuba (%)
Place of birth for the foreign-born population - Dominica (%)
Place of birth for the foreign-born population - Dominican Republic (%)
Place of birth for the foreign-born population - Grenada (%)
Place of birth for the foreign-born population - Haiti (%)
Place of birth for the foreign-born population - Jamaica (%)
Place of birth for the foreign-born population - St. Vincent and the Grenadines (%)
Place of birth for the foreign-born population - Trinidad and Tobago (%)
Place of birth for the foreign-born population - West Indies (%)
Place of birth for the foreign-born population - Other Caribbean (%)
Place of birth for the foreign-born population - Belize (%)
Place of birth for the foreign-born population - Costa Rica (%)
Place of birth for the foreign-born population - El Salvador (%)
Place of birth for the foreign-born population - Guatemala (%)
Place of birth for the foreign-born population - Honduras (%)
Place of birth for the foreign-born population - Mexico (%)
Place of birth for the foreign-born population - Nicaragua (%)
Place of birth for the foreign-born population - Panama (%)
Place of birth for the foreign-born population - Other Central America (%)
Place of birth for the foreign-born population - Argentina (%)
Place of birth for the foreign-born population - Bolivia (%)
Place of birth for the foreign-born population - Brazil (%)
Place of birth for the foreign-born population - Chile (%)
Place of birth for the foreign-born population - Colombia (%)
Place of birth for the foreign-born population - Ecuador (%)
Place of birth for the foreign-born population - Guyana (%)
Place of birth for the foreign-born population - Peru (%)
Place of birth for the foreign-born population - Uruguay (%)
Place of birth for the foreign-born population - Venezuela (%)
Place of birth for the foreign-born population - Other South America (%)
Place of birth for the foreign-born population - Canada (%)
Place of birth for the foreign-born population - Other Northern America (%)
Place of birth for the foreign-born population - Other (%)
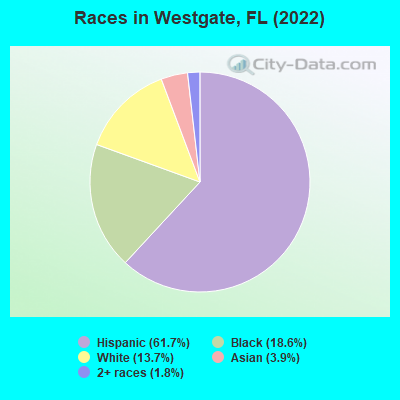
According to 2022 data, the most numerous races in Westgate, FL are White alone (1,133 residents), Hispanic (5,116 residents), and Black alone (1,544 residents). 31.2% of Westgate residents speak English at home.
Race distribution in Westgate 5,116 61.7% Hispanic 1,544 18.6% Black alone 1,133 13.7% White alone 325 3.9% Asian alone 148 1.8% Two or more races
2000 2022
10,458,509 65.4% White alone 2,682,715 16.8% Hispanic 2,264,268 14.2% Black alone 261,693 1.6% Asian alone 236,954 1.5% Two or more races 42,358 0.3% American Indian alone 28,994 0.2% Other race alone 6,887 0.04% Native Hawaiian and Other
11,309,403 50.8% White alone 6,025,039 27.1% Hispanic 3,241,015 14.6% Black alone 861,630 3.9% Two or more races 623,692 2.8% Asian alone 152,054 0.7% Other race alone 22,504 0.1% American Indian alone 9,486 0.04% Native Hawaiian and Other
Income and house value in Westgate Median household income in 2022 $34,984 Black householders$30,231 Asian householders$43,564 Some other race householders$49,912 Two or more races householders$49,394 Hispanic or Latino race householders
Median age by race in Westgate
28.5 Median age for White residents28.3 31.5 34.6 Median age for Black or African American residents26.5 38.6 29.7 Median age for American Indian / Alaska Native residents24.9 -762,696,213.5 25.2 Median age for Asian residents25.5 45.4 67.8 Median age for Native Hawaiian / Pacific Islander residents61.2 -443,298,968.6 36.8 Median age for Other race residents39.1 28.3 30.7 Median age for Two or more races residents31.6 28.2 41.8 Median age for White alone residents31.0 48.3 28.7 Median age for Hispanic or Latino residents31.1 26.6
Owner/renter occupied households by race in Westgate
House owners and renters - White residents 272 56.6% Owner occupied208 43.4% Renter occupiedHouse owners and renters - Black or African American residents 208 32.7% Owner occupied428 67.3% Renter occupiedHouse owners and renters - American Indian / Alaska Native residents 30 100.0% Renter occupiedHouse owners and renters - Asian residents 15 15.6% Owner occupied79 84.4% Renter occupiedHouse owners and renters - Native Hawaiian / Pacific Islander residents 24 100.0% Owner occupiedHouse owners and renters - Other race residents 78 23.0% Owner occupied262 77.0% Renter occupiedHouse owners and renters - Two or more races residents 241 29.0% Owner occupied589 71.0% Renter occupiedHouse owners and renters - White alone residents 228 71.9% Owner occupied89 28.1% Renter occupiedHouse owners and renters - Hispanic or Latino residents 447 35.7% Owner occupied806 64.3% Renter occupied
Language usage in Westgate
English speakers - Total 31.2% of residents of Westgate speak English at home.
55.2% of residents speak Spanish at home 1,654 39.4% Speak English very well2,549 60.6% Speak English less than very well13.7% of residents speak other language at home 522 50.0% Speak English very well521 50.0% Speak English less than very well
English speakers - Born in the United States 68.6% of residents of Westgate speak English at home.
27.5% of residents speak Spanish at home 211 79.6% Speak English very well54 20.4% Speak English less than very well3.3% of residents speak other language at home 32 100.0% Speak English very well
English speakers - Native, born elsewhere 21.6% of residents of Westgate speak English at home.
73.4% of residents speak Spanish at home 24 11.6% Speak English very well183 88.4% Speak English less than very well7.1% of residents speak other language at home 20 100.0% Speak English very well
English speakers - Foreign-born 4.5% of residents of Westgate speak English at home.
71.8% of residents speak Spanish at home 444 17.2% Speak English very well2,135 82.8% Speak English less than very well23.6% of residents speak other language at home 345 40.7% Speak English very well502 59.3% Speak English less than very well
White (Caucasian) - Speak only English Native:
85.3% (1,101)Foreign-born:
4.0% (17)
White (Caucasian) - Speak another language Native:
25.2% (326)Foreign-born:
94.0% (406)
Black or African American - Speak only English Native:
80.8% (745)Foreign-born:
15.3% (98)
Black or African American - Speak another language Native:
19.2% (177)Foreign-born:
83.3% (529)
American Indian / Alaska Native - Speak another language Native:
100.0% (12)Foreign-born:
98.3% (59)
Asian - Speak another language Native:
78.5% (41)Foreign-born:
100.0% (285)
Native Hawaiian / Pacific Islander - Speak another language Native:
100.0% (7)Foreign-born:
100.0% (29)
Other race - Speak only English Native:
3.8% (27)Foreign-born:
7.5% (43)
Other race - Speak another language Native:
96.1% (680)Foreign-born:
92.5% (530)
Two or more races - Speak another language Native:
72.9% (832)Foreign-born:
99.4% (1,789)
White alone - Speak only English Native:
96.0% (1,059)Foreign-born:
100.0% (17)
Hispanic or Latino - Speak only English Native:
15.1% (288)Foreign-born:
2.4% (62)
Hispanic or Latino - Speak another language Native:
84.9% (1,625)Foreign-born:
97.5% (2,556)
Foreign-born residents in Westgate
Marital status for residents in Westgate Marital status - White (Caucasian) population 15 years and over
Males 67.2% Never married20.7% Now married1.0% Separated7.5% Widowed3.5% DivorcedFemales 39.3% Never married26.5% Now married16.7% Separated9.3% Widowed8.2% DivorcedWomen who gave birth in the past 12 months Now married:
0.0% (0)Unmarried:
100.0% (15)
Women who did not give birth in the past 12 months Now married:
46.7% (146)Unmarried:
53.3% (166)
Marital status - Black or African American population 15 years and over
Males 50.6% Never married27.3% Now married8.3% Separated7.8% Widowed6.0% DivorcedFemales 38.0% Never married31.2% Now married12.8% Separated0.0% Widowed18.0% DivorcedWomen who gave birth in the past 12 months Now married:
100.0% (25)Unmarried:
0.0% (0)
Women who did not give birth in the past 12 months Now married:
42.6% (182)Unmarried:
57.4% (245)
Marital status - American Indian / Alaska Native population 15 years and over
Males 72.4% Never married27.6% Now married0.0% Separated0.0% Widowed0.0% DivorcedFemales 100.0% Never married0.0% Now married0.0% Separated0.0% Widowed0.0% DivorcedWomen who did not give birth in the past 12 months Now married:
0.0% (0)Unmarried:
100.0% (14)
Marital status - Asian population 15 years and over
Males 36.4% Never married63.6% Now married0.0% Separated0.0% Widowed0.0% DivorcedFemales 7.5% Never married88.3% Now married0.0% Separated0.0% Widowed4.2% DivorcedWomen who did not give birth in the past 12 months Now married:
75.4% (45)Unmarried:
24.6% (15)
Marital status - Native Hawaiian / Pacific Islander population 15 years and over
Males 50.0% Never married50.0% Now married0.0% Separated0.0% Widowed0.0% DivorcedFemales 0.0% Never married100.0% Now married0.0% Separated0.0% Widowed0.0% DivorcedMarital status - Other race population 15 years and over
Males 29.7% Never married20.1% Now married5.8% Separated36.0% Widowed8.4% DivorcedFemales 63.0% Never married22.2% Now married0.0% Separated5.3% Widowed9.5% DivorcedWomen who did not give birth in the past 12 months Now married:
14.8% (63)Unmarried:
85.2% (361)
Marital status - Two or more races population 15 years and over
Males 39.1% Never married45.7% Now married10.2% Separated0.0% Widowed5.1% DivorcedFemales 34.3% Never married36.3% Now married16.1% Separated3.2% Widowed10.1% DivorcedWomen who gave birth in the past 12 months Now married:
42.5% (81)Unmarried:
57.5% (110)
Women who did not give birth in the past 12 months Now married:
47.5% (412)Unmarried:
52.5% (455)
Marital status - White alone, not Hispanic / Latino population 15 years and over
Males 69.9% Never married11.4% Now married0.0% Separated14.7% Widowed4.0% DivorcedFemales 2.9% Never married17.5% Now married46.7% Separated15.0% Widowed17.9% DivorcedWomen who did not give birth in the past 12 months Now married:
83.7% (123)Unmarried:
16.3% (24)
Marital status - Hispanic or Latino population 15 years and over
Males 46.6% Never married36.4% Now married6.1% Separated7.1% Widowed3.8% DivorcedFemales 49.0% Never married30.8% Now married8.6% Separated4.9% Widowed6.7% DivorcedWomen who gave birth in the past 12 months Now married:
34.7% (50)Unmarried:
65.3% (93)
Women who did not give birth in the past 12 months Now married:
33.0% (400)Unmarried:
67.0% (814)
Ancestries in Westgate
815 13.0% English761 12.1% Haitian173 2.8% African103 1.6% American60 1.0% Bahamian54 0.9% Jamaican46 0.7% Italian15 0.2% German13 0.2% Irish13 0.2% Polish10 0.2% Lithuanian6 0.10% Scotch-Irish4 0.06% British
Children Nativity (place of birth) in Westgate
Children under 6 years - Living with two parents Both parents foreign-born 143 100.0% NativeOne native, one foreign-born parent 165 100.0% NativeChildren under 6 years - Living with one parent Native parent 49 54.3% Native42 45.7% Foreign-bornForeign-born parent 494 100.0% NativeChildren 6 to 17 years - Living with two parents Both parents native 136 98.5% Native2 1.5% Foreign-bornBoth parents foreign-born 209 71.1% Native85 28.9% Foreign-bornChildren 6 to 17 years - Living with one parent Native parent 26 100.0% NativeForeign-born parent 783 61.9% Native482 38.1% Foreign-born
Grandparents responsible for own grandchildren in Westgate
Grandparents (30 to 59 years) White / Caucasian 11 21.7% Responsible for grandchildren41 78.3% Not responsible for grandchildrenBlack or African American 19 100.0% Responsible for grandchildrenOther race 74 100.0% Not responsible for grandchildrenTwo or more races 148 69.5% Responsible for grandchildren65 30.5% Not responsible for grandchildrenHispanic or Latino 98 39.5% Responsible for grandchildren150 60.5% Not responsible for grandchildrenGrandparents (60 years and over) White / Caucasian 29 35.6% Responsible for grandchildren53 64.4% Not responsible for grandchildrenTwo or more races 7 100.0% Not responsible for grandchildrenHispanic or Latino 59 94.0% Responsible for grandchildren4 6.0% Not responsible for grandchildren