Races in West Palm Beach, Florida (FL) Detailed Stats
Data:
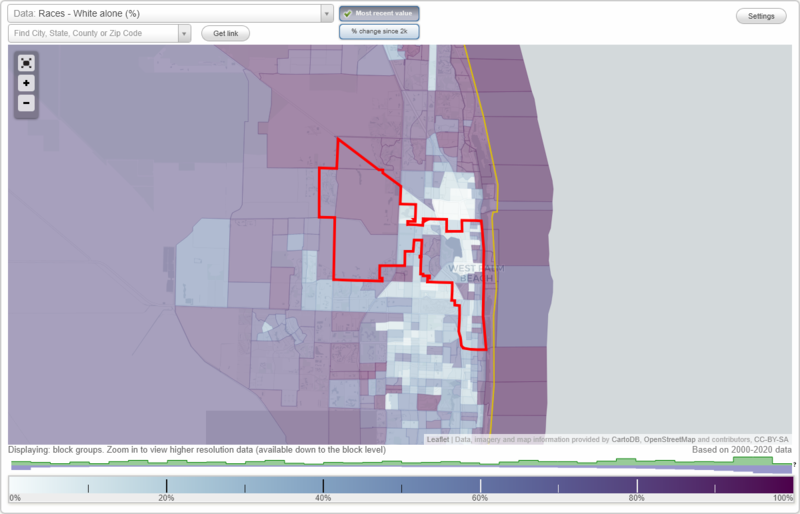
Races - White alone (%)
Races - White alone (% change since 2000)
Races - Black alone (%)
Races - Black alone (% change since 2000)
Races - American Indian alone (%)
Races - American Indian alone (% change since 2000)
Races - Asian alone (%)
Races - Asian alone (% change since 2000)
Races - Hispanic (%)
Races - Hispanic (% change since 2000)
Races - Native Hawaiian and Other Pacific Islander alone (%)
Races - Native Hawaiian and Other Pacific Islander alone (% change since 2000)
Races - Two or more races(%)
Races - Two or more races(% change since 2000)
Races - Other race alone (%)
Races - Other race alone (% change since 2000)
Racial diversity
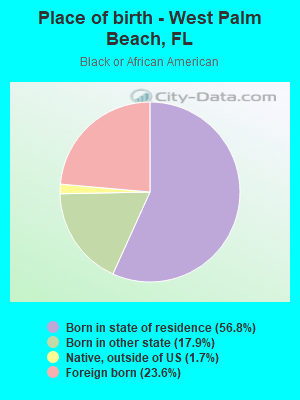
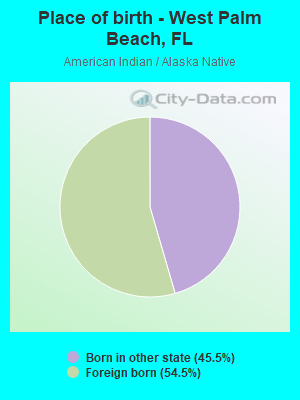
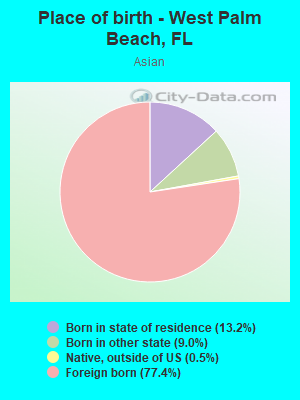
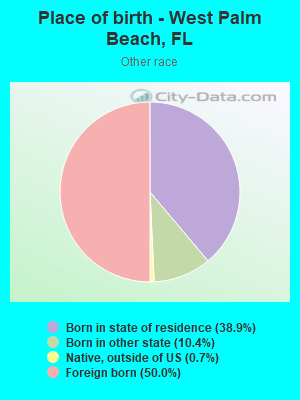
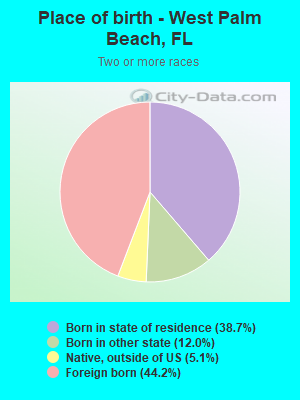
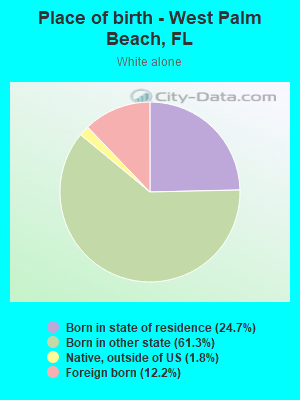
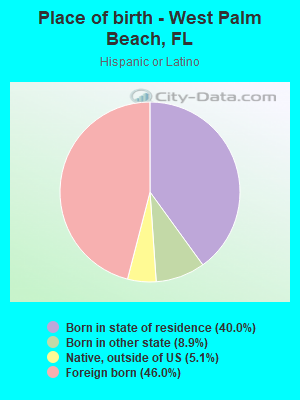
Place of birth - Born in state of residence (%)
Place of birth - Born in state of residence (%) - White
Place of birth - Born in state of residence (%) - Black or African American
Place of birth - Born in state of residence (%) - Asian
Place of birth - Born in state of residence (%) - Hispanic or Latino
Place of birth - Born in state of residence (%) - American Indian and Alaska Native
Place of birth - Born in state of residence (%) - Multirace
Place of birth - Born in state of residence (%) - Other Race
Place of birth - Born in other state (%)
Place of birth - Born in other state (%) - White
Place of birth - Born in other state (%) - Black or African American
Place of birth - Born in other state (%) - Asian
Place of birth - Born in other state (%) - Hispanic or Latino
Place of birth - Born in other state (%) - American Indian and Alaska Native
Place of birth - Born in other state (%) - Multirace
Place of birth - Born in other state (%) - Other Race
Place of birth - Native, outside of US (%)
Place of birth - Native, outside of US (%) - White
Place of birth - Native, outside of US (%) - Black or African American
Place of birth - Native, outside of US (%) - Asian
Place of birth - Native, outside of US (%) - Hispanic or Latino
Place of birth - Native, outside of US (%) - American Indian and Alaska Native
Place of birth - Native, outside of US (%) - Multirace
Place of birth - Native, outside of US (%) - Other Race
Place of birth - Foreign born (%)
Place of birth - Foreign born (%) - White
Place of birth - Foreign born (%) - Black or African American
Place of birth - Foreign born (%) - Asian
Place of birth - Foreign born (%) - Hispanic or Latino
Place of birth - Foreign born (%) - American Indian and Alaska Native
Place of birth - Foreign born (%) - Multirace
Place of birth - Foreign born (%) - Other Race
Residents speaking English at home (%)
Residents speaking English at home - Born in the United States (%)
Residents speaking English at home - Native, born elsewhere (%)
Residents speaking English at home - Foreign born (%)
Residents speaking Spanish at home (%)
Residents speaking Spanish at home - Born in the United States (%)
Residents speaking Spanish at home - Native, born elsewhere (%)
Residents speaking Spanish at home - Foreign born (%)
Residents speaking other language at home (%)
Residents speaking other language at home - Born in the United States (%)
Residents speaking other language at home - Native, born elsewhere (%)
Residents speaking other language at home - Foreign born (%)
Marital status - Never married (%)
Marital status - Now married (%)
Marital status - Separated (%)
Marital status - Widowed (%)
Marital status - Divorced (%)
Ancestries Reported - Arab (%)
Ancestries Reported - Czech (%)
Ancestries Reported - Danish (%)
Ancestries Reported - Dutch (%)
Ancestries Reported - English (%)
Ancestries Reported - French (%)
Ancestries Reported - French Canadian (%)
Ancestries Reported - German (%)
Ancestries Reported - Greek (%)
Ancestries Reported - Hungarian (%)
Ancestries Reported - Irish (%)
Ancestries Reported - Italian (%)
Ancestries Reported - Lithuanian (%)
Ancestries Reported - Norwegian (%)
Ancestries Reported - Polish (%)
Ancestries Reported - Portuguese (%)
Ancestries Reported - Russian (%)
Ancestries Reported - Scotch-Irish (%)
Ancestries Reported - Scottish (%)
Ancestries Reported - Slovak (%)
Ancestries Reported - Subsaharan African (%)
Ancestries Reported - Swedish (%)
Ancestries Reported - Swiss (%)
Ancestries Reported - Ukrainian (%)
Ancestries Reported - United States (%)
Ancestries Reported - Welsh (%)
Ancestries Reported - West Indian (%)
Ancestries Reported - Other (%)
Geographical mobility - Same house 1 year ago (%)
Geographical mobility - Same house 1 year ago (%) - White
Geographical mobility - Same house 1 year ago (%) - Black or African American
Geographical mobility - Same house 1 year ago (%) - Asian
Geographical mobility - Same house 1 year ago (%) - Hispanic or Latino
Geographical mobility - Same house 1 year ago (%) - American Indian and Alaska Native
Geographical mobility - Same house 1 year ago (%) - Multirace
Geographical mobility - Same house 1 year ago (%) - Other Race
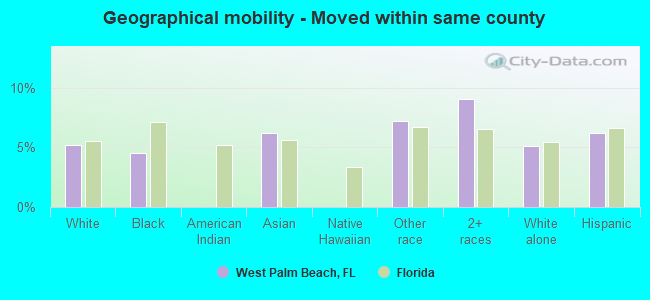
Geographical mobility - Moved within same county (%)
Geographical mobility - Moved within same county (%) - White
Geographical mobility - Moved within same county (%) - Black or African American
Geographical mobility - Moved within same county (%) - Asian
Geographical mobility - Moved within same county (%) - Hispanic or Latino
Geographical mobility - Moved within same county (%) - American Indian and Alaska Native
Geographical mobility - Moved within same county (%) - Multirace
Geographical mobility - Moved within same county (%) - Other Race
Geographical mobility - Moved from different county within same state (%)
Geographical mobility - Moved from different county within same state (%) - White
Geographical mobility - Moved from different county within same state (%) - Black or African American
Geographical mobility - Moved from different county within same state (%) - Asian
Geographical mobility - Moved from different county within same state (%) - Hispanic or Latino
Geographical mobility - Moved from different county within same state (%) - American Indian and Alaska Native
Geographical mobility - Moved from different county within same state (%) - Multirace
Geographical mobility - Moved from different county within same state (%) - Other Race
Geographical mobility - Moved from different state (%)
Geographical mobility - Moved from different state (%) - White
Geographical mobility - Moved from different state (%) - Black or African American
Geographical mobility - Moved from different state (%) - Asian
Geographical mobility - Moved from different state (%) - Hispanic or Latino
Geographical mobility - Moved from different state (%) - American Indian and Alaska Native
Geographical mobility - Moved from different state (%) - Multirace
Geographical mobility - Moved from different state (%) - Other Race
Geographical mobility - Moved from abroad (%)
Geographical mobility - Moved from abroad (%) - White
Geographical mobility - Moved from abroad (%) - Black or African American
Geographical mobility - Moved from abroad (%) - Asian
Geographical mobility - Moved from abroad (%) - Hispanic or Latino
Geographical mobility - Moved from abroad (%) - American Indian and Alaska Native
Geographical mobility - Moved from abroad (%) - Multirace
Geographical mobility - Moved from abroad (%) - Other Race
Place of birth for the foreign-born population - Ireland (%)
Place of birth for the foreign-born population - Denmark (%)
Place of birth for the foreign-born population - Norway (%)
Place of birth for the foreign-born population - Sweden (%)
Place of birth for the foreign-born population - United Kingdom (%)
Place of birth for the foreign-born population - England (%)
Place of birth for the foreign-born population - Scotland (%)
Place of birth for the foreign-born population - Other Northern Europe (%)
Place of birth for the foreign-born population - Austria (%)
Place of birth for the foreign-born population - Belgium (%)
Place of birth for the foreign-born population - France (%)
Place of birth for the foreign-born population - Germany (%)
Place of birth for the foreign-born population - Netherlands (%)
Place of birth for the foreign-born population - Switzerland (%)
Place of birth for the foreign-born population - Other Western Europe (%)
Place of birth for the foreign-born population - Greece (%)
Place of birth for the foreign-born population - Italy (%)
Place of birth for the foreign-born population - Portugal (%)
Place of birth for the foreign-born population - Spain (%)
Place of birth for the foreign-born population - Other Southern Europe (%)
Place of birth for the foreign-born population - Albania (%)
Place of birth for the foreign-born population - Belarus (%)
Place of birth for the foreign-born population - Bosnia and Herzegovina (%)
Place of birth for the foreign-born population - Bulgaria (%)
Place of birth for the foreign-born population - Croatia (%)
Place of birth for the foreign-born population - Czechoslovakia (%)
Place of birth for the foreign-born population - Hungary (%)
Place of birth for the foreign-born population - Latvia (%)
Place of birth for the foreign-born population - Lithuania (%)
Place of birth for the foreign-born population - North Macedonia (Macedonia) (%)
Place of birth for the foreign-born population - Moldova (%)
Place of birth for the foreign-born population - Poland (%)
Place of birth for the foreign-born population - Romania (%)
Place of birth for the foreign-born population - Russia (%)
Place of birth for the foreign-born population - Serbia (%)
Place of birth for the foreign-born population - Ukraine (%)
Place of birth for the foreign-born population - Other Eastern Europe (%)
Place of birth for the foreign-born population - China (%)
Place of birth for the foreign-born population - Hong Kong (%)
Place of birth for the foreign-born population - Taiwan (%)
Place of birth for the foreign-born population - Japan (%)
Place of birth for the foreign-born population - Korea (%)
Place of birth for the foreign-born population - Other Eastern Asia (%)
Place of birth for the foreign-born population - Afghanistan (%)
Place of birth for the foreign-born population - Bangladesh (%)
Place of birth for the foreign-born population - India (%)
Place of birth for the foreign-born population - Iran (%)
Place of birth for the foreign-born population - Kazakhstan (%)
Place of birth for the foreign-born population - Nepal (%)
Place of birth for the foreign-born population - Pakistan (%)
Place of birth for the foreign-born population - Sri Lanka (%)
Place of birth for the foreign-born population - Uzbekistan (%)
Place of birth for the foreign-born population - Other South Central Asia (%)
Place of birth for the foreign-born population - Burma (%)
Place of birth for the foreign-born population - Cambodia (%)
Place of birth for the foreign-born population - Indonesia (%)
Place of birth for the foreign-born population - Laos (%)
Place of birth for the foreign-born population - Malaysia (%)
Place of birth for the foreign-born population - Philippines (%)
Place of birth for the foreign-born population - Singapore (%)
Place of birth for the foreign-born population - Thailand (%)
Place of birth for the foreign-born population - Vietnam (%)
Place of birth for the foreign-born population - Other South Eastern Asia (%)
Place of birth for the foreign-born population - Armenia (%)
Place of birth for the foreign-born population - Iraq (%)
Place of birth for the foreign-born population - Israel (%)
Place of birth for the foreign-born population - Jordan (%)
Place of birth for the foreign-born population - Kuwait (%)
Place of birth for the foreign-born population - Lebanon (%)
Place of birth for the foreign-born population - Saudi Arabia (%)
Place of birth for the foreign-born population - Syria (%)
Place of birth for the foreign-born population - Turkey (%)
Place of birth for the foreign-born population - Yemen (%)
Place of birth for the foreign-born population - Other Western Asia (%)
Place of birth for the foreign-born population - Eritrea (%)
Place of birth for the foreign-born population - Ethiopia (%)
Place of birth for the foreign-born population - Kenya (%)
Place of birth for the foreign-born population - Somalia (%)
Place of birth for the foreign-born population - Uganda (%)
Place of birth for the foreign-born population - Zimbabwe (%)
Place of birth for the foreign-born population - Other Eastern Africa (%)
Place of birth for the foreign-born population - Cameroon (%)
Place of birth for the foreign-born population - Congo (%)
Place of birth for the foreign-born population - Democratic Republic of Congo (Zaire) (%)
Place of birth for the foreign-born population - Other Middle Africa (%)
Place of birth for the foreign-born population - Egypt (%)
Place of birth for the foreign-born population - Morocco (%)
Place of birth for the foreign-born population - Sudan (%)
Place of birth for the foreign-born population - Other Northern Africa (%)
Place of birth for the foreign-born population - South Africa (%)
Place of birth for the foreign-born population - Other Southern Africa (%)
Place of birth for the foreign-born population - Cabo Verde (%)
Place of birth for the foreign-born population - Ghana (%)
Place of birth for the foreign-born population - Liberia (%)
Place of birth for the foreign-born population - Nigeria (%)
Place of birth for the foreign-born population - Senegal (%)
Place of birth for the foreign-born population - Sierra Leone (%)
Place of birth for the foreign-born population - Other Western Africa (%)
Place of birth for the foreign-born population - Australia (%)
Place of birth for the foreign-born population - New Zealand (%)
Place of birth for the foreign-born population - Fiji (%)
Place of birth for the foreign-born population - Micronesia (%)
Place of birth for the foreign-born population - Bahamas (%)
Place of birth for the foreign-born population - Barbados (%)
Place of birth for the foreign-born population - Cuba (%)
Place of birth for the foreign-born population - Dominica (%)
Place of birth for the foreign-born population - Dominican Republic (%)
Place of birth for the foreign-born population - Grenada (%)
Place of birth for the foreign-born population - Haiti (%)
Place of birth for the foreign-born population - Jamaica (%)
Place of birth for the foreign-born population - St. Vincent and the Grenadines (%)
Place of birth for the foreign-born population - Trinidad and Tobago (%)
Place of birth for the foreign-born population - West Indies (%)
Place of birth for the foreign-born population - Other Caribbean (%)
Place of birth for the foreign-born population - Belize (%)
Place of birth for the foreign-born population - Costa Rica (%)
Place of birth for the foreign-born population - El Salvador (%)
Place of birth for the foreign-born population - Guatemala (%)
Place of birth for the foreign-born population - Honduras (%)
Place of birth for the foreign-born population - Mexico (%)
Place of birth for the foreign-born population - Nicaragua (%)
Place of birth for the foreign-born population - Panama (%)
Place of birth for the foreign-born population - Other Central America (%)
Place of birth for the foreign-born population - Argentina (%)
Place of birth for the foreign-born population - Bolivia (%)
Place of birth for the foreign-born population - Brazil (%)
Place of birth for the foreign-born population - Chile (%)
Place of birth for the foreign-born population - Colombia (%)
Place of birth for the foreign-born population - Ecuador (%)
Place of birth for the foreign-born population - Guyana (%)
Place of birth for the foreign-born population - Peru (%)
Place of birth for the foreign-born population - Uruguay (%)
Place of birth for the foreign-born population - Venezuela (%)
Place of birth for the foreign-born population - Other South America (%)
Place of birth for the foreign-born population - Canada (%)
Place of birth for the foreign-born population - Other Northern America (%)
Place of birth for the foreign-born population - Other (%)
According to 2022 data, the most numerous races in West Palm Beach, FL are White alone (45,296 residents), Hispanic (35,165 residents), and Black alone (31,430 residents). 66.7% of West Palm Beach residents speak English at home. 28.6% of West Palm Beach, FL residents are foreign-born (21.0% born in Latin America, 3.6% born in Europe), which is 26.7% greater than the foreign-born rate of 21.0% across the entire state of Florida.
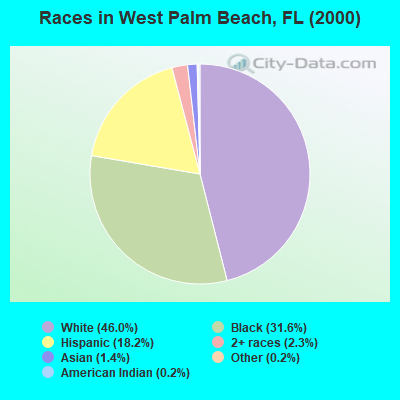
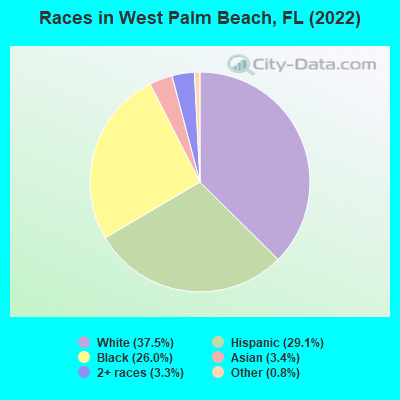
Race distribution in West Palm Beach
2000 2022
37,771 46.0% White alone 25,958 31.6% Black alone 14,955 18.2% Hispanic 1,848 2.3% Two or more races 1,163 1.4% Asian alone 169 0.2% Other race alone 158 0.2% American Indian alone 81 0.10% Native Hawaiian and Other
45,296 37.5% White alone 35,165 29.1% Hispanic 31,430 26.0% Black alone 4,062 3.4% Asian alone 3,987 3.3% Two or more races 915 0.8% Other race alone 67 0.06% American Indian alone
2000 2022
10,458,509 65.4% White alone 2,682,715 16.8% Hispanic 2,264,268 14.2% Black alone 261,693 1.6% Asian alone 236,954 1.5% Two or more races 42,358 0.3% American Indian alone 28,994 0.2% Other race alone 6,887 0.04% Native Hawaiian and Other
11,309,403 50.8% White alone 6,025,039 27.1% Hispanic 3,241,015 14.6% Black alone 861,630 3.9% Two or more races 623,692 2.8% Asian alone 152,054 0.7% Other race alone 22,504 0.1% American Indian alone 9,486 0.04% Native Hawaiian and Other
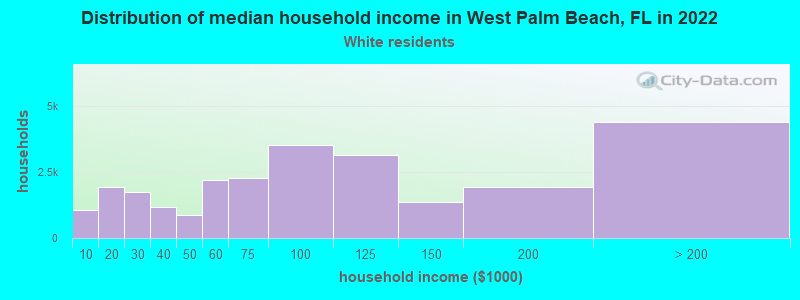
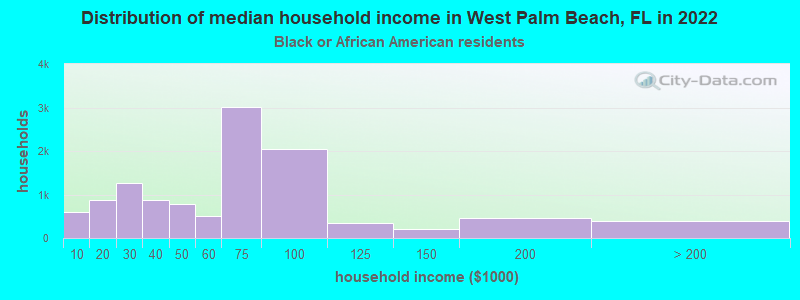
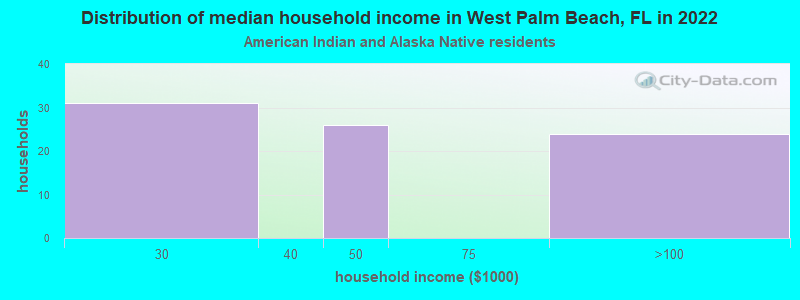
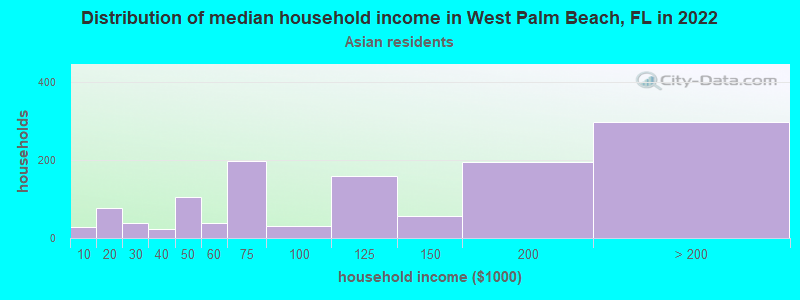
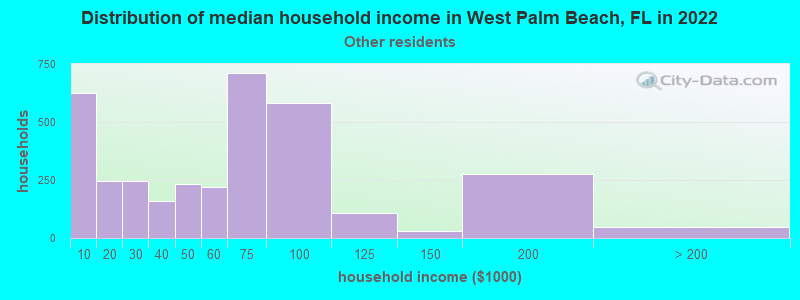
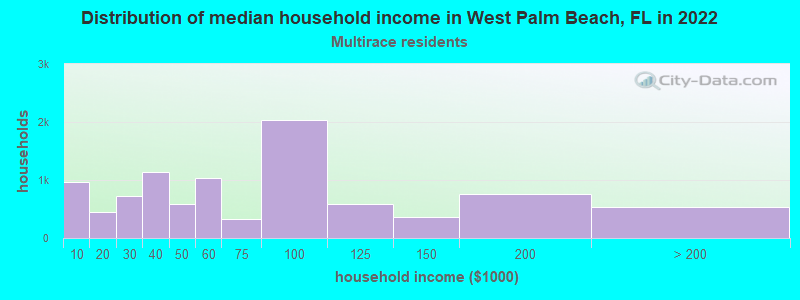
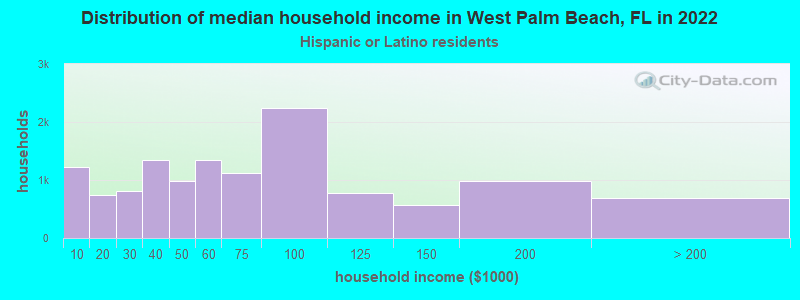
Income and house value in West Palm Beach Median household income in 2022 $81,752 White non-Hispanic householders$65,529 Black householders$83,333 Asian householders$70,457 Some other race householders$58,412 Two or more races householders$59,579 Hispanic or Latino race householdersMedian 2022 house value $653,229 White Non-Hispanic householders$393,178 Black or African American householders$310,153 American Indian or Alaska Native householders $680,427 Asian householders$395,087 Some other race householders$422,762 Two or more races householders$395,564 Hispanic or Latino householders
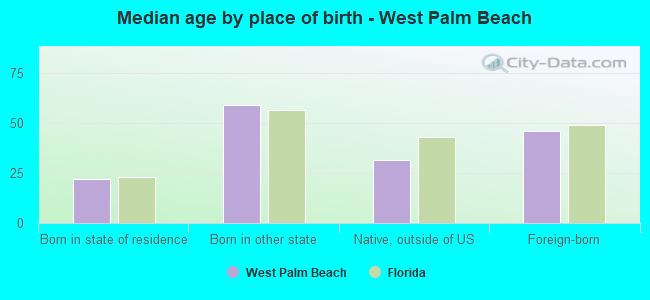
Median age by race in West Palm Beach
53.3 Median age for White residents49.0 55.9 36.2 Median age for Black or African American residents32.7 36.7 44.0 Median age for American Indian / Alaska Native residents30.1 -660,098,521.5 36.8 Median age for Asian residents34.6 37.2 -666,666,666.0 Median age for Native Hawaiian / Pacific Islander residents-666,666,666.0 -666,666,666.0 31.4 Median age for Other race residents29.9 31.5 32.9 Median age for Two or more races residents32.3 33.6 54.2 Median age for White alone residents50.5 56.9 34.1 Median age for Hispanic or Latino residents32.7 34.4
Owner/renter occupied households by race in West Palm Beach
House owners and renters - White residents 15,686 61.3% Owner occupied9,883 38.7% Renter occupiedHouse owners and renters - Black or African American residents 4,549 40.0% Owner occupied6,828 60.0% Renter occupiedHouse owners and renters - American Indian / Alaska Native residents 31 56.3% Owner occupied24 43.7% Renter occupiedHouse owners and renters - Asian residents 1,110 83.7% Owner occupied216 16.3% Renter occupiedHouse owners and renters - Native Hawaiian / Pacific Islander residents 20 100.0% Owner occupiedHouse owners and renters - Other race residents 1,102 33.4% Owner occupied2,199 66.6% Renter occupiedHouse owners and renters - Two or more races residents 3,874 40.7% Owner occupied5,638 59.3% Renter occupiedHouse owners and renters - White alone residents 14,759 62.2% Owner occupied8,963 37.8% Renter occupiedHouse owners and renters - Hispanic or Latino residents 5,149 40.2% Owner occupied7,658 59.8% Renter occupied
Language usage in West Palm Beach
English speakers - Total 66.7% of residents of West Palm Beach speak English at home.
21.8% of residents speak Spanish at home 13,513 54.6% Speak English very well11,250 45.4% Speak English less than very well11.5% of residents speak other language at home 9,636 73.7% Speak English very well3,442 26.3% Speak English less than very well
English speakers - Born in the United States 94.5% of residents of West Palm Beach speak English at home.
3.9% of residents speak Spanish at home 1,299 88.9% Speak English very well162 11.1% Speak English less than very well1.5% of residents speak other language at home 572 100.0% Speak English very well
English speakers - Native, born elsewhere 49.5% of residents of West Palm Beach speak English at home.
44.5% of residents speak Spanish at home 935 68.1% Speak English very well438 31.9% Speak English less than very well5.9% of residents speak other language at home 183 100.0% Speak English very well
English speakers - Foreign-born 27.7% of residents of West Palm Beach speak English at home.
44.2% of residents speak Spanish at home 5,617 37.7% Speak English very well9,274 62.3% Speak English less than very well28.1% of residents speak other language at home 6,149 64.9% Speak English very well3,327 35.1% Speak English less than very well
White (Caucasian) - Speak only English Native:
93.5% (38,231)Foreign-born:
39.6% (2,501)
White (Caucasian) - Speak another language Native:
6.5% (2,641)Foreign-born:
60.4% (3,817)
Black or African American - Speak only English Native:
92.3% (21,143)Foreign-born:
68.7% (5,217)
Black or African American - Speak another language Native:
7.7% (1,771)Foreign-born:
31.3% (2,378)
American Indian / Alaska Native - Speak another language Native:
39.4% (23)Foreign-born:
100.0% (79)
Asian - Speak only English Native:
54.4% (355)Foreign-born:
27.1% (648)
Asian - Speak another language Native:
44.1% (289)Foreign-born:
73.0% (1,748)
Other race - Speak only English Native:
61.9% (2,856)Foreign-born:
6.8% (410)
Other race - Speak another language Native:
38.1% (1,759)Foreign-born:
93.2% (5,661)
Two or more races - Speak only English Native:
36.5% (3,806)Foreign-born:
7.3% (759)
Two or more races - Speak another language Native:
63.5% (6,610)Foreign-born:
92.7% (9,572)
White alone - Speak only English Native:
96.2% (37,220)Foreign-born:
43.3% (2,386)
White alone - Speak another language Native:
3.8% (1,457)Foreign-born:
56.7% (3,124)
Hispanic or Latino - Speak only English Native:
35.4% (5,244)Foreign-born:
7.8% (1,260)
Hispanic or Latino - Speak another language Native:
64.6% (9,553)Foreign-born:
92.2% (14,906)
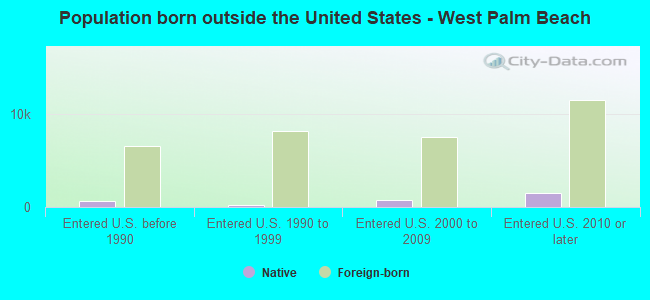
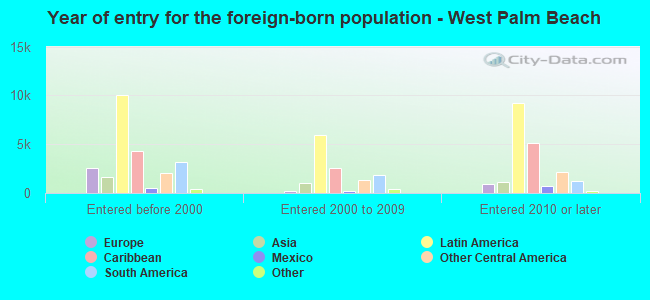
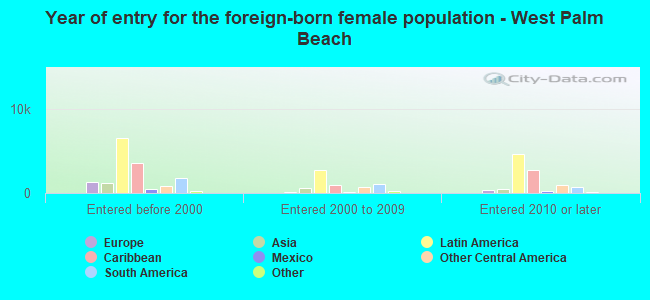
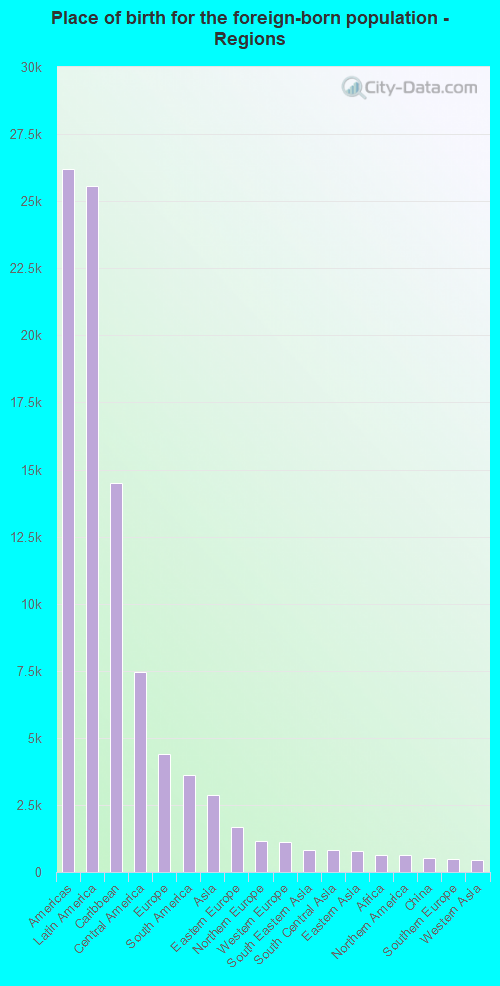
Foreign-born residents in West Palm Beach 34,214 residents are foreign born (21.0% Latin America , 3.6% Europe ).
This city:
28.6%Florida:
21.1%
Marital status for residents in West Palm Beach Marital status - White (Caucasian) population 15 years and over
Males 33.5% Never married45.1% Now married1.5% Separated4.5% Widowed15.4% DivorcedFemales 23.2% Never married41.3% Now married0.3% Separated14.8% Widowed20.3% DivorcedWomen who gave birth in the past 12 months Now married:
100.0% (457)Unmarried:
0.0% (0)
Women who did not give birth in the past 12 months Now married:
40.8% (3,254)Unmarried:
59.2% (4,725)
Marital status - Black or African American population 15 years and over
Males 49.0% Never married36.5% Now married2.5% Separated1.6% Widowed10.4% DivorcedFemales 40.4% Never married27.8% Now married5.7% Separated12.8% Widowed13.3% DivorcedWomen who gave birth in the past 12 months Now married:
44.8% (252)Unmarried:
55.2% (310)
Women who did not give birth in the past 12 months Now married:
23.7% (1,747)Unmarried:
76.3% (5,634)
Marital status - American Indian / Alaska Native population 15 years and over
Males 77.6% Never married0.0% Now married0.0% Separated0.0% Widowed22.4% DivorcedFemales 0.0% Never married0.0% Now married0.0% Separated75.0% Widowed25.0% DivorcedWomen who did not give birth in the past 12 months Now married:
0.0% (0)Unmarried:
100.0% (25)
Marital status - Asian population 15 years and over
Males 29.8% Never married62.1% Now married3.3% Separated0.0% Widowed4.8% DivorcedFemales 26.8% Never married55.1% Now married0.0% Separated9.2% Widowed8.9% DivorcedWomen who gave birth in the past 12 months Now married:
100.0% (18)Unmarried:
0.0% (0)
Women who did not give birth in the past 12 months Now married:
58.8% (555)Unmarried:
41.2% (388)
Marital status - Other race population 15 years and over
Males 61.1% Never married23.5% Now married4.1% Separated4.9% Widowed6.3% DivorcedFemales 46.5% Never married25.2% Now married2.1% Separated17.4% Widowed8.9% DivorcedWomen who gave birth in the past 12 months Now married:
44.2% (74)Unmarried:
55.8% (94)
Women who did not give birth in the past 12 months Now married:
32.1% (912)Unmarried:
67.9% (1,925)
Marital status - Two or more races population 15 years and over
Males 44.7% Never married50.5% Now married1.6% Separated0.2% Widowed3.1% DivorcedFemales 30.4% Never married42.9% Now married2.3% Separated7.9% Widowed16.6% DivorcedWomen who gave birth in the past 12 months Now married:
23.1% (165)Unmarried:
76.9% (549)
Women who did not give birth in the past 12 months Now married:
46.4% (2,808)Unmarried:
53.6% (3,248)
Marital status - White alone, not Hispanic / Latino population 15 years and over
Males 34.1% Never married44.8% Now married1.6% Separated4.8% Widowed14.7% DivorcedFemales 22.4% Never married41.8% Now married0.3% Separated14.8% Widowed20.7% DivorcedWomen who gave birth in the past 12 months Now married:
100.0% (457)Unmarried:
0.0% (0)
Women who did not give birth in the past 12 months Now married:
40.5% (2,844)Unmarried:
59.5% (4,177)
Marital status - Hispanic or Latino population 15 years and over
Males 52.7% Never married37.1% Now married3.1% Separated2.1% Widowed4.9% DivorcedFemales 40.6% Never married31.8% Now married3.0% Separated7.8% Widowed16.8% DivorcedWomen who gave birth in the past 12 months Now married:
23.1% (165)Unmarried:
76.9% (549)
Women who did not give birth in the past 12 months Now married:
34.0% (3,246)Unmarried:
66.0% (6,292)
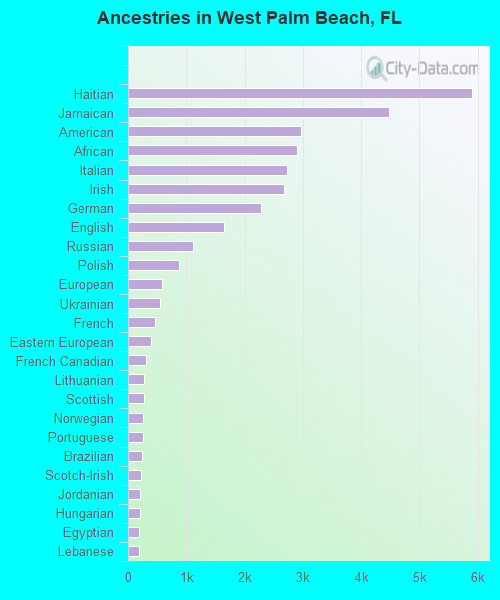
Ancestries in West Palm Beach
5,898 8.2% Haitian4,476 6.2% Jamaican2,972 4.1% American2,899 4.0% African2,728 3.8% Italian2,672 3.7% Irish2,277 3.2% German1,650 2.3% English1,115 1.5% Russian870 1.2% Polish575 0.8% European549 0.8% Ukrainian456 0.6% French389 0.5% Eastern European310 0.4% French Canadian276 0.4% Lithuanian268 0.4% Scottish265 0.4% Norwegian261 0.4% Portuguese248 0.3% Brazilian217 0.3% Scotch-Irish208 0.3% Jordanian199 0.3% Hungarian185 0.3% Egyptian181 0.3% Lebanese165 0.2% Austrian155 0.2% Canadian139 0.2% Dutch136 0.2% Ghanaian132 0.2% Greek129 0.2% Danish103 0.1% West Indian102 0.1% Barbadian101 0.1% British94 0.1% Romanian82 0.1% Swedish82 0.1% Trinidadian and Tobagonian79 0.1% Nigerian77 0.1% Iranian73 0.1% Yugoslavian68 0.09% Croatian66 0.09% Bahamian60 0.08% Latvian59 0.08% Bulgarian58 0.08% Moroccan55 0.08% Albanian53 0.07% South African52 0.07% Israeli51 0.07% Macedonian50 0.07% Slovak43 0.06% Serbian42 0.06% U.S. Virgin Islander40 0.06% Welsh40 0.06% Czechoslovakian37 0.05% Northern European33 0.05% Czech31 0.04% Guyanese28 0.04% Belgian27 0.04% British West Indian16 0.02% Bermudan12 0.02% Finnish10 0.01% Turkish9 0.01% Belizean8 0.01% Slovene8 0.01% New Zealander6 0.01% Maltese6 0.01% Estonian6 0.01% Scandinavian5 0.01% Armenian4 0.01% Arab4 0.01% Australian
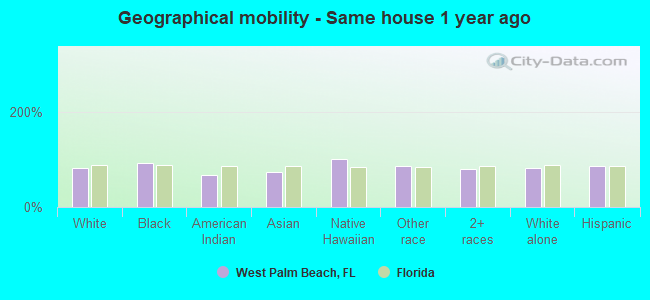
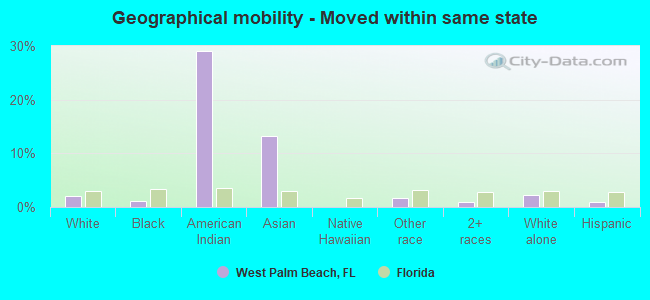
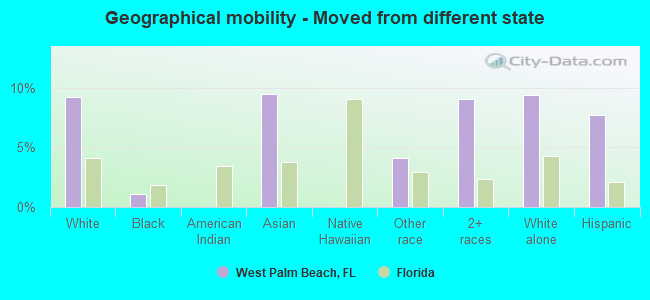
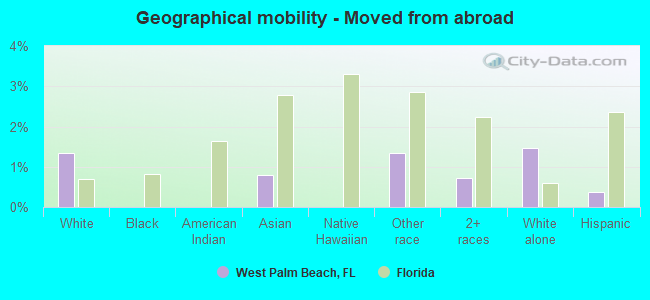
Geographical mobility in West Palm Beach Same house 1 year ago 39,836 82.2% White (Caucasian)29,838 93.4% Black or African American123 68.3% American Indian / Alaska Native2,266 73.3% Asian12 100.0% Native Hawaiian / Pacific Islander8,782 85.3% Other race18,287 80.2% Two or more races36,840 81.8% White alone, not Hispanic / Latino29,379 84.9% Hispanic or LatinoMoved within same county 2,505 5.2% White / Caucasian1,442 4.5% Black or African American191 6.2% Asian743 7.2% Other race2,067 9.1% Two or more races2,313 5.1% White alone, not Hispanic / Latino2,134 6.2% Hispanic or LatinoMoved within same state 993 2.0% White / Caucasian333 1.0% Black or African American53 29.2% American Indian / Alaska Native412 13.3% Asian167 1.6% Other race208 0.9% Two or more races993 2.2% White alone, not Hispanic / Latino299 0.9% Hispanic or LatinoMoved from different state 4,457 9.2% White / Caucasian344 1.1% Black or African American294 9.5% Asian421 4.1% Other race2,065 9.1% Two or more races4,226 9.4% White alone, not Hispanic / Latino2,683 7.7% Hispanic or LatinoMoved from abroad 656 1.4% White25 0.8% Asian139 1.4% Other race166 0.7% Two or more races656 1.5% White alone, not Hispanic / Latino127 0.4% Hispanic or Latino
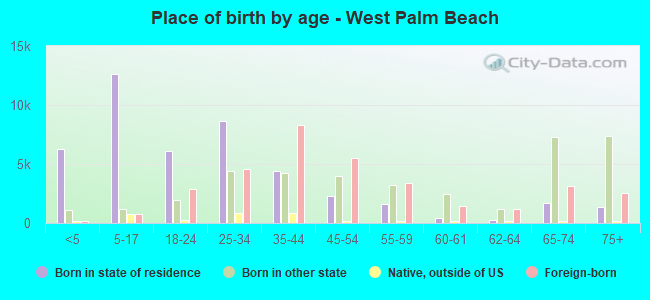
Children Nativity (place of birth) in West Palm Beach
Children under 6 years - Living with two parents Both parents native 1,509 100.0% NativeBoth parents foreign-born 339 100.0% NativeOne native, one foreign-born parent 328 100.0% NativeChildren under 6 years - Living with one parent Native parent 2,244 100.0% NativeForeign-born parent 3,136 100.0% NativeChildren 6 to 17 years - Living with two parents Both parents native 3,568 100.0% NativeBoth parents foreign-born 1,382 76.7% Native421 23.3% Foreign-bornOne native, one foreign-born parent 1,997 100.0% NativeChildren 6 to 17 years - Living with one parent Native parent 2,606 100.0% NativeForeign-born parent 3,686 52.6% Native3,325 47.4% Foreign-born
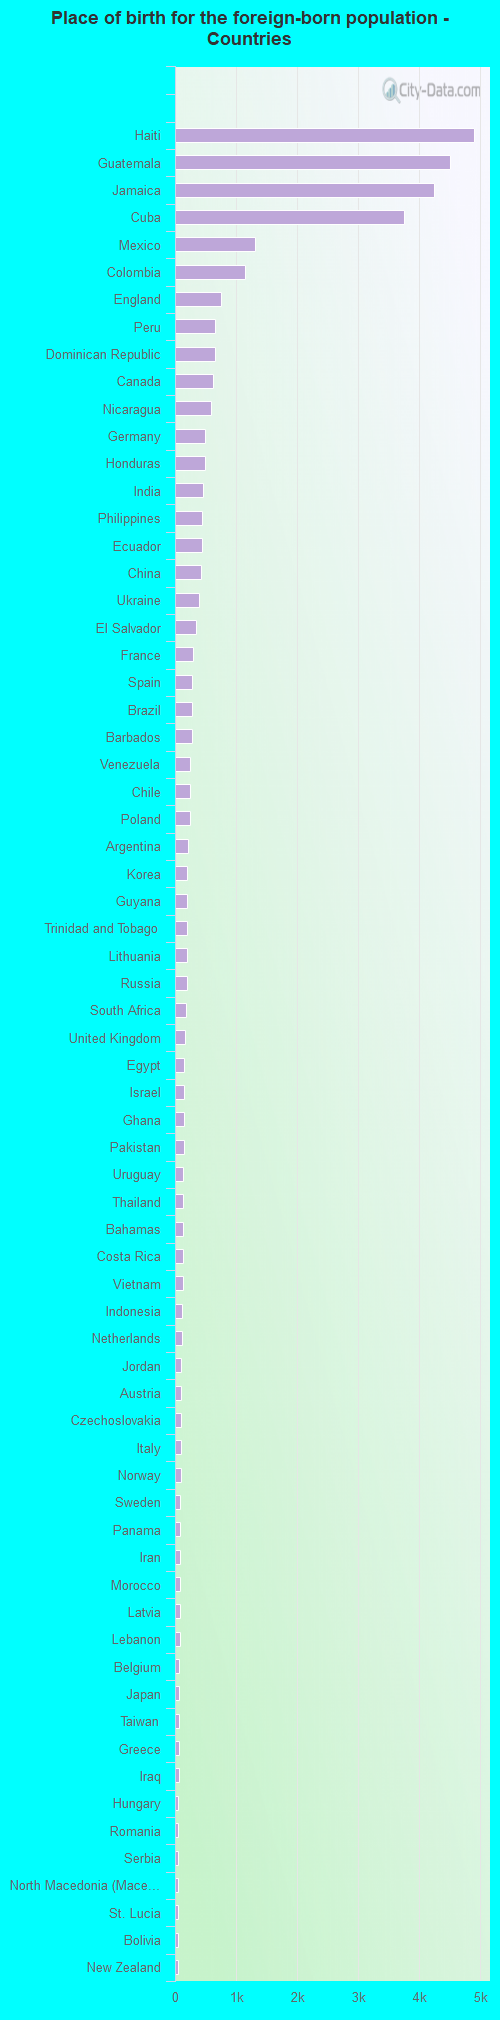
Place of birth for residents in West Palm Beach 26,212 Americas25,567 Latin America14,491 Caribbean7,459 Central America4,416 Europe3,616 South America2,875 Asia1,671 Eastern Europe1,162 Northern Europe1,110 Western Europe829 South Eastern Asia803 South Central Asia793 Eastern Asia645 Africa645 Northern America517 China470 Southern Europe448 Western Asia232 Northern Africa197 Western Africa189 Southern Africa64 Oceania46 Australia and New Zealand Subregion25 Eastern Africa4,898 Haiti4,498 Guatemala4,237 Jamaica3,755 Cuba1,309 Mexico1,146 Colombia749 England661 Peru649 Dominican Republic628 Canada586 Nicaragua498 Germany494 Honduras451 India442 Philippines435 Ecuador426 China392 Ukraine344 El Salvador298 France277 Spain276 Brazil276 Barbados253 Venezuela251 Chile242 Poland208 Argentina202 Korea195 Guyana191 Trinidad and Tobago191 Lithuania189 Russia175 South Africa168 United Kingdom154 Egypt151 Israel148 Ghana143 Pakistan139 Uruguay134 Thailand129 Bahamas128 Costa Rica127 Vietnam119 Indonesia115 Netherlands106 Jordan103 Austria98 Czechoslovakia97 Italy92 Norway88 Sweden84 Panama82 Iran78 Morocco76 Latvia74 Lebanon73 Belgium73 Japan69 Taiwan59 Greece59 Iraq55 Hungary55 Romania54 Serbia52 North Macedonia (Macedonia)50 St. Lucia48 Bolivia46 New Zealand40 Nepal37 Dominica37 Bosnia and Herzegovina36 Bangladesh36 Portugal28 Ireland27 United Arab Emirates25 Azores Islands25 Kenya25 Nigeria25 Bulgaria22 Liberia21 Moldova21 Hong Kong20 Switzerland18 Grenada18 Kazakhstan18 St. Vincent and the Grenadines17 Scotland17 Croatia16 West Indies16 Denmark15 Syria15 Uzbekistan13 Turkey12 Belize5 Malaysia
Grandparents responsible for own grandchildren in West Palm Beach
Grandparents (30 to 59 years) White / Caucasian 114 62.8% Responsible for grandchildren68 37.2% Not responsible for grandchildrenBlack or African American 284 51.1% Responsible for grandchildren272 48.9% Not responsible for grandchildrenOther race 253 100.0% Responsible for grandchildrenTwo or more races 257 100.0% Not responsible for grandchildrenWhite alone, not Hispanic / Latino 64 55.0% Responsible for grandchildren52 45.0% Not responsible for grandchildrenHispanic or Latino 217 44.1% Responsible for grandchildren275 55.9% Not responsible for grandchildrenGrandparents (60 years and over) White / Caucasian 60 25.3% Responsible for grandchildren177 74.7% Not responsible for grandchildrenBlack or African American 454 59.3% Responsible for grandchildren311 40.7% Not responsible for grandchildrenTwo or more races 21 5.9% Responsible for grandchildren338 94.1% Not responsible for grandchildrenWhite alone, not Hispanic / Latino 71 46.8% Responsible for grandchildren81 53.2% Not responsible for grandchildrenHispanic or Latino 19 3.9% Responsible for grandchildren483 96.1% Not responsible for grandchildren