Races in West Milford, New Jersey (NJ) Detailed Stats
Ancestries, Foreign-born residents, place of birth

Recent posts about races in West Milford, New Jersey on our local forum with over 2,400,000 registered users:
 | Bergen County Morris County - Planning to buy a house (70 replies) |
| Black family wanting to move to West Milford, NJ (43 replies) |
| Crazy Phil Murphy wants to STOP the Bear Hunt? (80 replies) |
| Recommendations for towns to look into for moving to Jersey (30 replies) |
| Man Attacked & Killed By Black Bear in West Milford (242 replies) |
| Moving to Radburn. Looking for advice (15 replies) |
5.8% of West Milford, NJ residents are foreign-born (3.7% born in Europe, 1.0% born in Latin America, 0.8% born in Asia), which is 297.5% less than the foreign-born rate of 23.0% across the entire state of New Jersey.
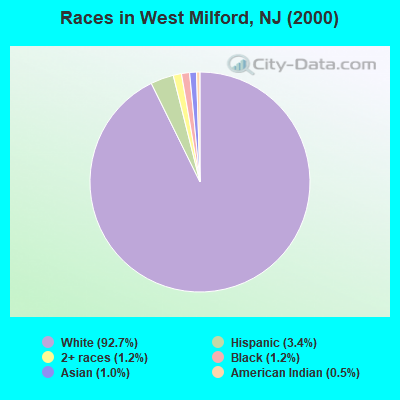
Race distribution in West Milford

- 24,47492.7%White alone
- 8933.4%Hispanic
- 3141.2%Black alone
- 3171.2%Two or more races
- 2621.0%Asian alone
- 1230.5%American Indian alone
- 260.10%Other race alone
2000
2022
-
- 5,557,20966.0%White alone
- 1,117,19113.3%Hispanic
- 1,096,17113.0%Black alone
- 477,0125.7%Asian alone
- 133,6891.6%Two or more races
- 19,5650.2%Other race alone
- 11,3380.1%American Indian alone
- 2,1750.03%Native Hawaiian and Other
Pacific Islander alone

-
- 4,766,47651.5%White alone
- 2,028,47021.9%Hispanic
- 1,111,63212.0%Black alone
- 923,54610.0%Asian alone
- 332,2373.6%Two or more races
- 89,8471.0%Other race alone
- 8,5570.09%American Indian alone
- 9340.01%Native Hawaiian and Other
Pacific Islander alone

Income and house value in West Milford
- Median household income in 2022
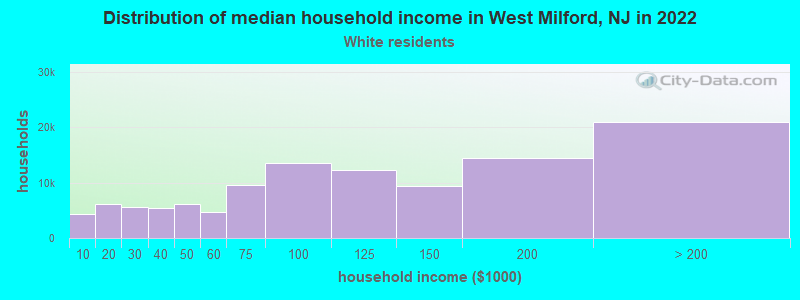
- $131,514White non-Hispanic householders
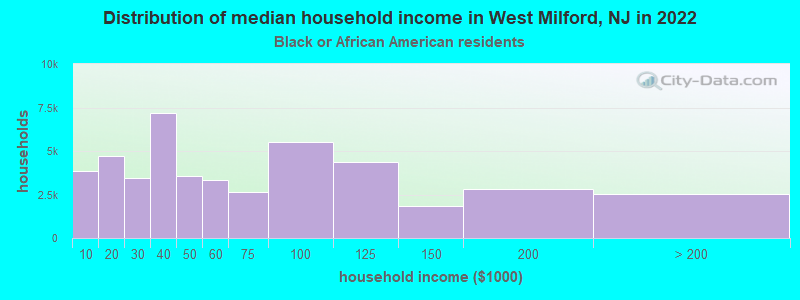
- $121,189Black householders
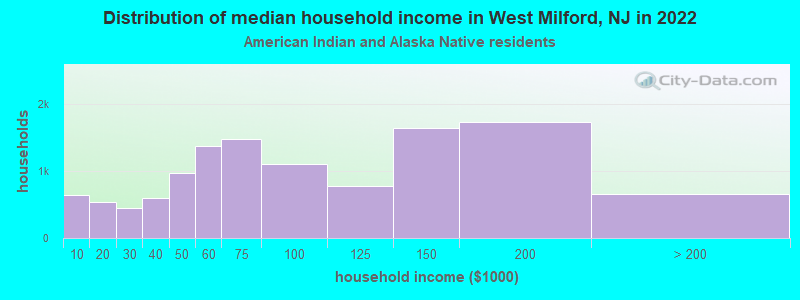
- $67,878American Indian and Alaska Native householders
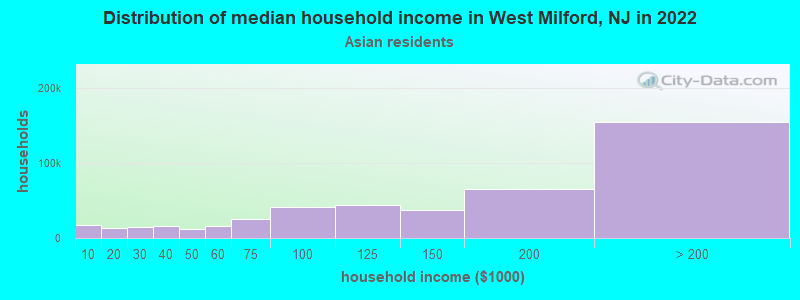
- over $200,000Asian householders
- $105,665Some other race householders
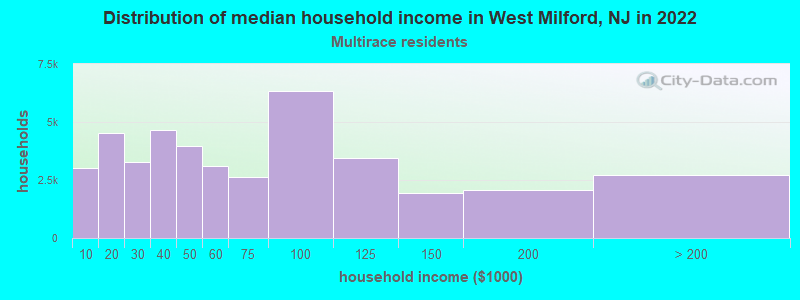
- $58,514Two or more races householders
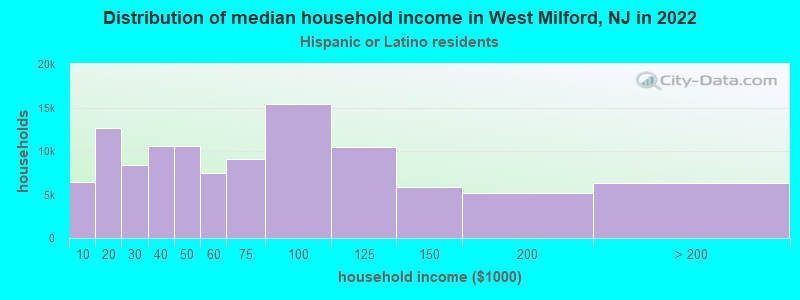
- $89,235Hispanic or Latino race householders
- Median 2022 house value
- $401,295White Non-Hispanic householders
- $371,274Black or African American householders
- $293,173American Indian or Alaska Native householders
- $408,097Asian householders
- $527,711Some other race householders
- $439,759Two or more races householders
- $420,293Hispanic or Latino householders
Household income for White non-Hispanic householders
Household income for Black householders
Household income for American Indian and Alaska Native householders
Household income for Asian householders
Household income for Two or more races householders
Household income for Hispanic or Latino race householders
Foreign-born residents in West Milford
1,528 residents are foreign born (3.7% Europe, 1.0% Latin America, 0.8% Asia).
| This city: | 5.8% |
| New Jersey: | 17.5% |
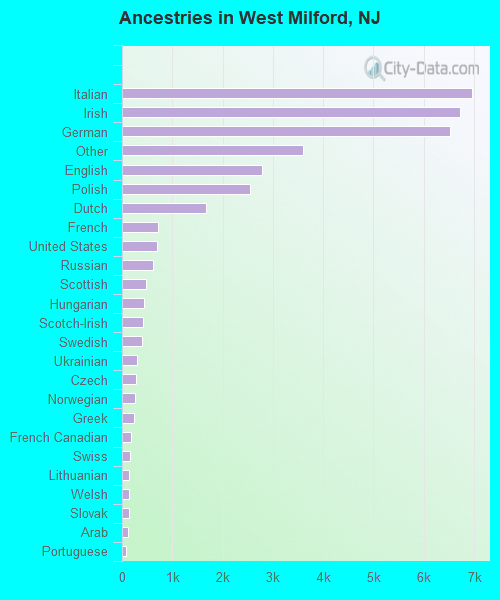
Ancestries in West Milford

- 6,95019.0%Italian
- 6,71718.3%Irish
- 6,51417.8%German
- 3,5999.8%Other
- 2,7797.6%English
- 2,5557.0%Polish
- 1,6684.6%Dutch
- 7071.9%French
- 6901.9%United States
- 6091.7%Russian
- 4711.3%Scottish
- 4431.2%Hungarian
- 4171.1%Scotch-Irish
- 3961.1%Swedish
- 3040.8%Ukrainian
- 2810.8%Czech
- 2510.7%Norwegian
- 2290.6%Greek
- 1750.5%French Canadian
- 1680.5%Swiss
- 1480.4%Lithuanian
- 1410.4%Welsh
- 1400.4%Slovak
- 1200.3%Arab
- 700.2%Portuguese
- 650.2%Danish
- 200.05%Subsaharan African
- 60.02%West Indian
Zip codes: 07480.