Races in West Little River, Florida (FL) Detailed Stats
Data:
Races - White alone (%)
Races - White alone (% change since 2000)
Races - Black alone (%)
Races - Black alone (% change since 2000)
Races - American Indian alone (%)
Races - American Indian alone (% change since 2000)
Races - Asian alone (%)
Races - Asian alone (% change since 2000)
Races - Hispanic (%)
Races - Hispanic (% change since 2000)
Races - Native Hawaiian and Other Pacific Islander alone (%)
Races - Native Hawaiian and Other Pacific Islander alone (% change since 2000)
Races - Two or more races(%)
Races - Two or more races(% change since 2000)
Races - Other race alone (%)
Races - Other race alone (% change since 2000)
Racial diversity
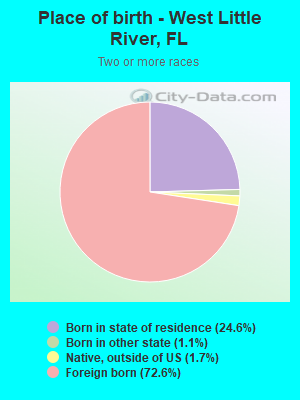
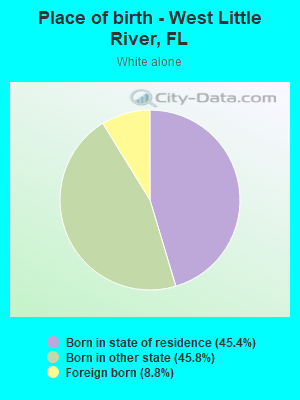
Place of birth - Born in state of residence (%)
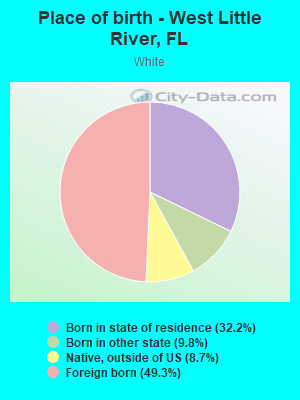
Place of birth - Born in state of residence (%) - White
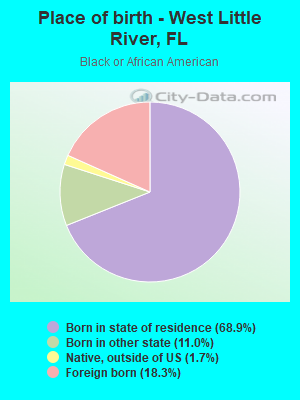
Place of birth - Born in state of residence (%) - Black or African American
Place of birth - Born in state of residence (%) - Asian
Place of birth - Born in state of residence (%) - Hispanic or Latino
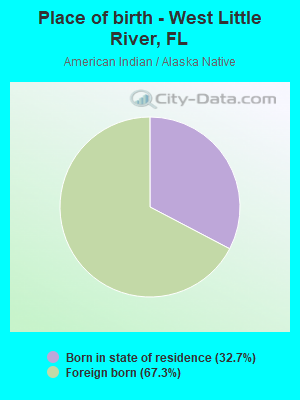
Place of birth - Born in state of residence (%) - American Indian and Alaska Native
Place of birth - Born in state of residence (%) - Multirace
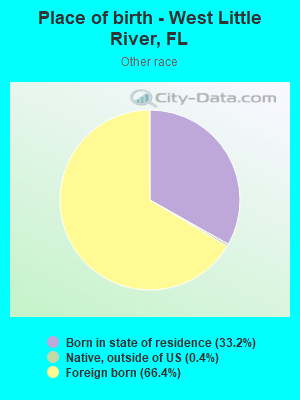
Place of birth - Born in state of residence (%) - Other Race
Place of birth - Born in other state (%)
Place of birth - Born in other state (%) - White
Place of birth - Born in other state (%) - Black or African American
Place of birth - Born in other state (%) - Asian
Place of birth - Born in other state (%) - Hispanic or Latino
Place of birth - Born in other state (%) - American Indian and Alaska Native
Place of birth - Born in other state (%) - Multirace
Place of birth - Born in other state (%) - Other Race
Place of birth - Native, outside of US (%)
Place of birth - Native, outside of US (%) - White
Place of birth - Native, outside of US (%) - Black or African American
Place of birth - Native, outside of US (%) - Asian
Place of birth - Native, outside of US (%) - Hispanic or Latino
Place of birth - Native, outside of US (%) - American Indian and Alaska Native
Place of birth - Native, outside of US (%) - Multirace
Place of birth - Native, outside of US (%) - Other Race
Place of birth - Foreign born (%)
Place of birth - Foreign born (%) - White
Place of birth - Foreign born (%) - Black or African American
Place of birth - Foreign born (%) - Asian
Place of birth - Foreign born (%) - Hispanic or Latino
Place of birth - Foreign born (%) - American Indian and Alaska Native
Place of birth - Foreign born (%) - Multirace
Place of birth - Foreign born (%) - Other Race
Residents speaking English at home (%)
Residents speaking English at home - Born in the United States (%)
Residents speaking English at home - Native, born elsewhere (%)
Residents speaking English at home - Foreign born (%)
Residents speaking Spanish at home (%)
Residents speaking Spanish at home - Born in the United States (%)
Residents speaking Spanish at home - Native, born elsewhere (%)
Residents speaking Spanish at home - Foreign born (%)
Residents speaking other language at home (%)
Residents speaking other language at home - Born in the United States (%)
Residents speaking other language at home - Native, born elsewhere (%)
Residents speaking other language at home - Foreign born (%)
Marital status - Never married (%)
Marital status - Now married (%)
Marital status - Separated (%)
Marital status - Widowed (%)
Marital status - Divorced (%)
Ancestries Reported - Arab (%)
Ancestries Reported - Czech (%)
Ancestries Reported - Danish (%)
Ancestries Reported - Dutch (%)
Ancestries Reported - English (%)
Ancestries Reported - French (%)
Ancestries Reported - French Canadian (%)
Ancestries Reported - German (%)
Ancestries Reported - Greek (%)
Ancestries Reported - Hungarian (%)
Ancestries Reported - Irish (%)
Ancestries Reported - Italian (%)
Ancestries Reported - Lithuanian (%)
Ancestries Reported - Norwegian (%)
Ancestries Reported - Polish (%)
Ancestries Reported - Portuguese (%)
Ancestries Reported - Russian (%)
Ancestries Reported - Scotch-Irish (%)
Ancestries Reported - Scottish (%)
Ancestries Reported - Slovak (%)
Ancestries Reported - Subsaharan African (%)
Ancestries Reported - Swedish (%)
Ancestries Reported - Swiss (%)
Ancestries Reported - Ukrainian (%)
Ancestries Reported - United States (%)
Ancestries Reported - Welsh (%)
Ancestries Reported - West Indian (%)
Ancestries Reported - Other (%)
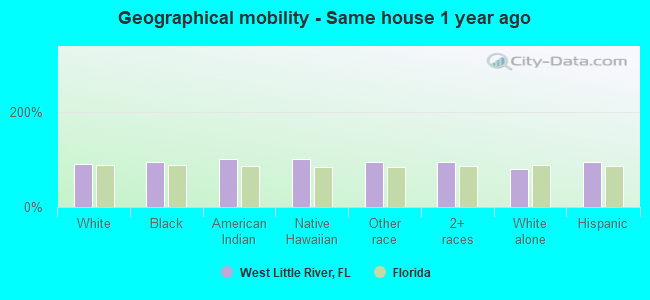
Geographical mobility - Same house 1 year ago (%)
Geographical mobility - Same house 1 year ago (%) - White
Geographical mobility - Same house 1 year ago (%) - Black or African American
Geographical mobility - Same house 1 year ago (%) - Asian
Geographical mobility - Same house 1 year ago (%) - Hispanic or Latino
Geographical mobility - Same house 1 year ago (%) - American Indian and Alaska Native
Geographical mobility - Same house 1 year ago (%) - Multirace
Geographical mobility - Same house 1 year ago (%) - Other Race
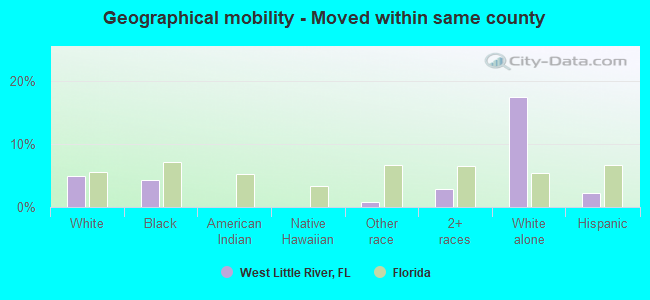
Geographical mobility - Moved within same county (%)
Geographical mobility - Moved within same county (%) - White
Geographical mobility - Moved within same county (%) - Black or African American
Geographical mobility - Moved within same county (%) - Asian
Geographical mobility - Moved within same county (%) - Hispanic or Latino
Geographical mobility - Moved within same county (%) - American Indian and Alaska Native
Geographical mobility - Moved within same county (%) - Multirace
Geographical mobility - Moved within same county (%) - Other Race
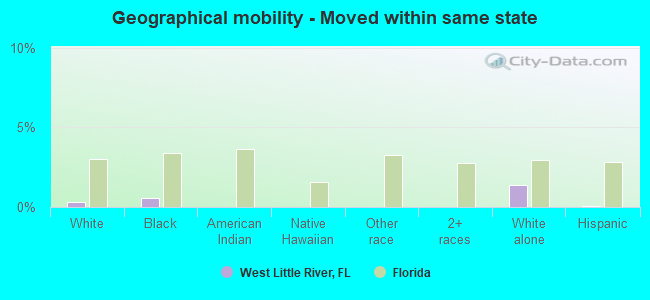
Geographical mobility - Moved from different county within same state (%)
Geographical mobility - Moved from different county within same state (%) - White
Geographical mobility - Moved from different county within same state (%) - Black or African American
Geographical mobility - Moved from different county within same state (%) - Asian
Geographical mobility - Moved from different county within same state (%) - Hispanic or Latino
Geographical mobility - Moved from different county within same state (%) - American Indian and Alaska Native
Geographical mobility - Moved from different county within same state (%) - Multirace
Geographical mobility - Moved from different county within same state (%) - Other Race
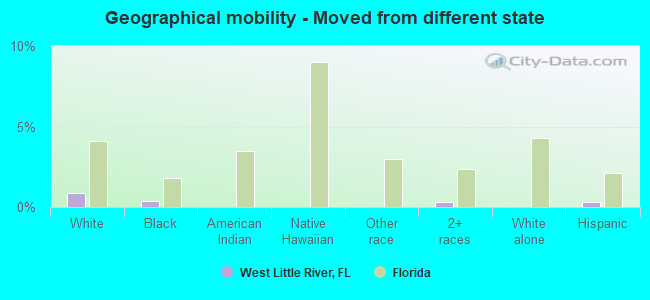
Geographical mobility - Moved from different state (%)
Geographical mobility - Moved from different state (%) - White
Geographical mobility - Moved from different state (%) - Black or African American
Geographical mobility - Moved from different state (%) - Asian
Geographical mobility - Moved from different state (%) - Hispanic or Latino
Geographical mobility - Moved from different state (%) - American Indian and Alaska Native
Geographical mobility - Moved from different state (%) - Multirace
Geographical mobility - Moved from different state (%) - Other Race
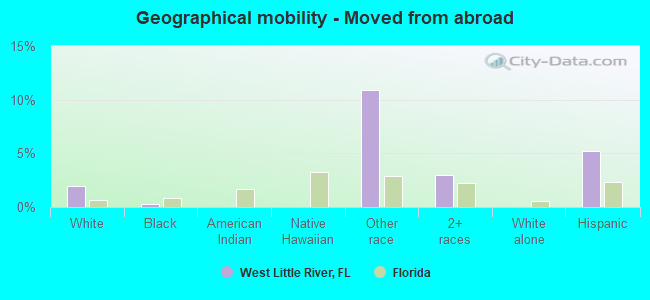
Geographical mobility - Moved from abroad (%)
Geographical mobility - Moved from abroad (%) - White
Geographical mobility - Moved from abroad (%) - Black or African American
Geographical mobility - Moved from abroad (%) - Asian
Geographical mobility - Moved from abroad (%) - Hispanic or Latino
Geographical mobility - Moved from abroad (%) - American Indian and Alaska Native
Geographical mobility - Moved from abroad (%) - Multirace
Geographical mobility - Moved from abroad (%) - Other Race
Place of birth for the foreign-born population - Ireland (%)
Place of birth for the foreign-born population - Denmark (%)
Place of birth for the foreign-born population - Norway (%)
Place of birth for the foreign-born population - Sweden (%)
Place of birth for the foreign-born population - United Kingdom (%)
Place of birth for the foreign-born population - England (%)
Place of birth for the foreign-born population - Scotland (%)
Place of birth for the foreign-born population - Other Northern Europe (%)
Place of birth for the foreign-born population - Austria (%)
Place of birth for the foreign-born population - Belgium (%)
Place of birth for the foreign-born population - France (%)
Place of birth for the foreign-born population - Germany (%)
Place of birth for the foreign-born population - Netherlands (%)
Place of birth for the foreign-born population - Switzerland (%)
Place of birth for the foreign-born population - Other Western Europe (%)
Place of birth for the foreign-born population - Greece (%)
Place of birth for the foreign-born population - Italy (%)
Place of birth for the foreign-born population - Portugal (%)
Place of birth for the foreign-born population - Spain (%)
Place of birth for the foreign-born population - Other Southern Europe (%)
Place of birth for the foreign-born population - Albania (%)
Place of birth for the foreign-born population - Belarus (%)
Place of birth for the foreign-born population - Bosnia and Herzegovina (%)
Place of birth for the foreign-born population - Bulgaria (%)
Place of birth for the foreign-born population - Croatia (%)
Place of birth for the foreign-born population - Czechoslovakia (%)
Place of birth for the foreign-born population - Hungary (%)
Place of birth for the foreign-born population - Latvia (%)
Place of birth for the foreign-born population - Lithuania (%)
Place of birth for the foreign-born population - North Macedonia (Macedonia) (%)
Place of birth for the foreign-born population - Moldova (%)
Place of birth for the foreign-born population - Poland (%)
Place of birth for the foreign-born population - Romania (%)
Place of birth for the foreign-born population - Russia (%)
Place of birth for the foreign-born population - Serbia (%)
Place of birth for the foreign-born population - Ukraine (%)
Place of birth for the foreign-born population - Other Eastern Europe (%)
Place of birth for the foreign-born population - China (%)
Place of birth for the foreign-born population - Hong Kong (%)
Place of birth for the foreign-born population - Taiwan (%)
Place of birth for the foreign-born population - Japan (%)
Place of birth for the foreign-born population - Korea (%)
Place of birth for the foreign-born population - Other Eastern Asia (%)
Place of birth for the foreign-born population - Afghanistan (%)
Place of birth for the foreign-born population - Bangladesh (%)
Place of birth for the foreign-born population - India (%)
Place of birth for the foreign-born population - Iran (%)
Place of birth for the foreign-born population - Kazakhstan (%)
Place of birth for the foreign-born population - Nepal (%)
Place of birth for the foreign-born population - Pakistan (%)
Place of birth for the foreign-born population - Sri Lanka (%)
Place of birth for the foreign-born population - Uzbekistan (%)
Place of birth for the foreign-born population - Other South Central Asia (%)
Place of birth for the foreign-born population - Burma (%)
Place of birth for the foreign-born population - Cambodia (%)
Place of birth for the foreign-born population - Indonesia (%)
Place of birth for the foreign-born population - Laos (%)
Place of birth for the foreign-born population - Malaysia (%)
Place of birth for the foreign-born population - Philippines (%)
Place of birth for the foreign-born population - Singapore (%)
Place of birth for the foreign-born population - Thailand (%)
Place of birth for the foreign-born population - Vietnam (%)
Place of birth for the foreign-born population - Other South Eastern Asia (%)
Place of birth for the foreign-born population - Armenia (%)
Place of birth for the foreign-born population - Iraq (%)
Place of birth for the foreign-born population - Israel (%)
Place of birth for the foreign-born population - Jordan (%)
Place of birth for the foreign-born population - Kuwait (%)
Place of birth for the foreign-born population - Lebanon (%)
Place of birth for the foreign-born population - Saudi Arabia (%)
Place of birth for the foreign-born population - Syria (%)
Place of birth for the foreign-born population - Turkey (%)
Place of birth for the foreign-born population - Yemen (%)
Place of birth for the foreign-born population - Other Western Asia (%)
Place of birth for the foreign-born population - Eritrea (%)
Place of birth for the foreign-born population - Ethiopia (%)
Place of birth for the foreign-born population - Kenya (%)
Place of birth for the foreign-born population - Somalia (%)
Place of birth for the foreign-born population - Uganda (%)
Place of birth for the foreign-born population - Zimbabwe (%)
Place of birth for the foreign-born population - Other Eastern Africa (%)
Place of birth for the foreign-born population - Cameroon (%)
Place of birth for the foreign-born population - Congo (%)
Place of birth for the foreign-born population - Democratic Republic of Congo (Zaire) (%)
Place of birth for the foreign-born population - Other Middle Africa (%)
Place of birth for the foreign-born population - Egypt (%)
Place of birth for the foreign-born population - Morocco (%)
Place of birth for the foreign-born population - Sudan (%)
Place of birth for the foreign-born population - Other Northern Africa (%)
Place of birth for the foreign-born population - South Africa (%)
Place of birth for the foreign-born population - Other Southern Africa (%)
Place of birth for the foreign-born population - Cabo Verde (%)
Place of birth for the foreign-born population - Ghana (%)
Place of birth for the foreign-born population - Liberia (%)
Place of birth for the foreign-born population - Nigeria (%)
Place of birth for the foreign-born population - Senegal (%)
Place of birth for the foreign-born population - Sierra Leone (%)
Place of birth for the foreign-born population - Other Western Africa (%)
Place of birth for the foreign-born population - Australia (%)
Place of birth for the foreign-born population - New Zealand (%)
Place of birth for the foreign-born population - Fiji (%)
Place of birth for the foreign-born population - Micronesia (%)
Place of birth for the foreign-born population - Bahamas (%)
Place of birth for the foreign-born population - Barbados (%)
Place of birth for the foreign-born population - Cuba (%)
Place of birth for the foreign-born population - Dominica (%)
Place of birth for the foreign-born population - Dominican Republic (%)
Place of birth for the foreign-born population - Grenada (%)
Place of birth for the foreign-born population - Haiti (%)
Place of birth for the foreign-born population - Jamaica (%)
Place of birth for the foreign-born population - St. Vincent and the Grenadines (%)
Place of birth for the foreign-born population - Trinidad and Tobago (%)
Place of birth for the foreign-born population - West Indies (%)
Place of birth for the foreign-born population - Other Caribbean (%)
Place of birth for the foreign-born population - Belize (%)
Place of birth for the foreign-born population - Costa Rica (%)
Place of birth for the foreign-born population - El Salvador (%)
Place of birth for the foreign-born population - Guatemala (%)
Place of birth for the foreign-born population - Honduras (%)
Place of birth for the foreign-born population - Mexico (%)
Place of birth for the foreign-born population - Nicaragua (%)
Place of birth for the foreign-born population - Panama (%)
Place of birth for the foreign-born population - Other Central America (%)
Place of birth for the foreign-born population - Argentina (%)
Place of birth for the foreign-born population - Bolivia (%)
Place of birth for the foreign-born population - Brazil (%)
Place of birth for the foreign-born population - Chile (%)
Place of birth for the foreign-born population - Colombia (%)
Place of birth for the foreign-born population - Ecuador (%)
Place of birth for the foreign-born population - Guyana (%)
Place of birth for the foreign-born population - Peru (%)
Place of birth for the foreign-born population - Uruguay (%)
Place of birth for the foreign-born population - Venezuela (%)
Place of birth for the foreign-born population - Other South America (%)
Place of birth for the foreign-born population - Canada (%)
Place of birth for the foreign-born population - Other Northern America (%)
Place of birth for the foreign-born population - Other (%)
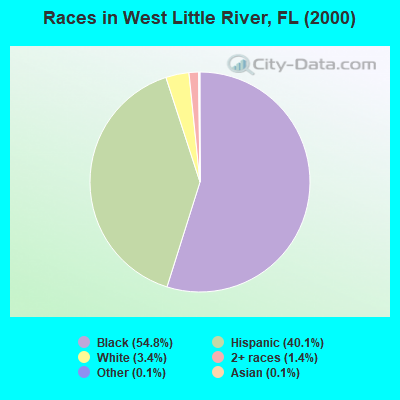
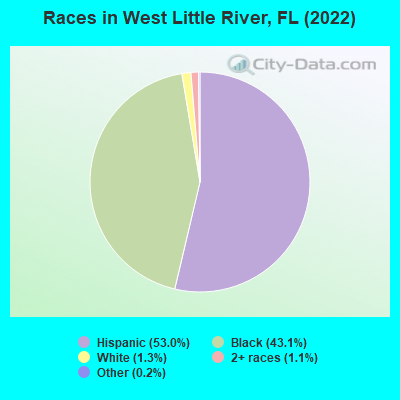
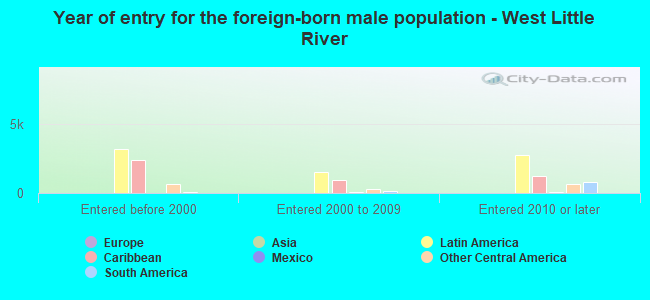
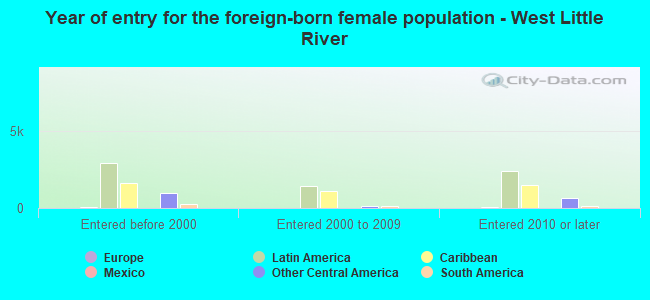
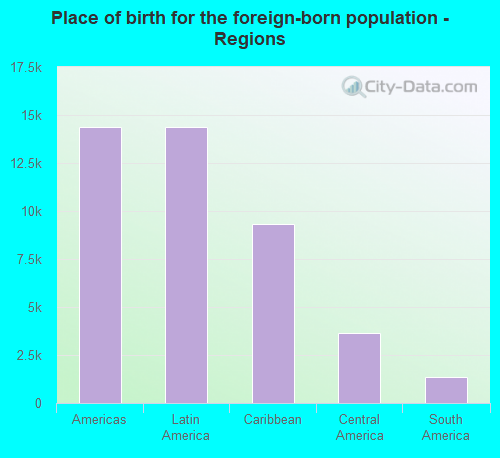
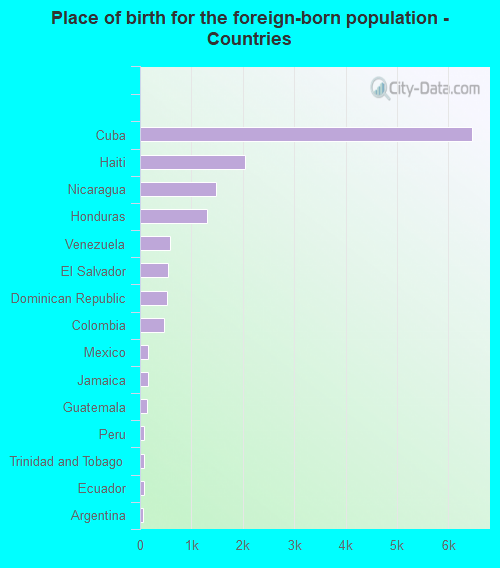
According to 2022 data, the most numerous races in West Little River, FL are White alone (437 residents), Hispanic (17,655 residents), and Black alone (14,348 residents). 40.3% of West Little River residents speak English at home. 43.6% of West Little River, FL residents are foreign-born (43.0% born in Latin America), which is 51.8% greater than the foreign-born rate of 21.0% across the entire state of Florida.
Race distribution in West Little River
2000 2022
10,458,509 65.4% White alone 2,682,715 16.8% Hispanic 2,264,268 14.2% Black alone 261,693 1.6% Asian alone 236,954 1.5% Two or more races 42,358 0.3% American Indian alone 28,994 0.2% Other race alone 6,887 0.04% Native Hawaiian and Other
11,309,403 50.8% White alone 6,025,039 27.1% Hispanic 3,241,015 14.6% Black alone 861,630 3.9% Two or more races 623,692 2.8% Asian alone 152,054 0.7% Other race alone 22,504 0.1% American Indian alone 9,486 0.04% Native Hawaiian and Other
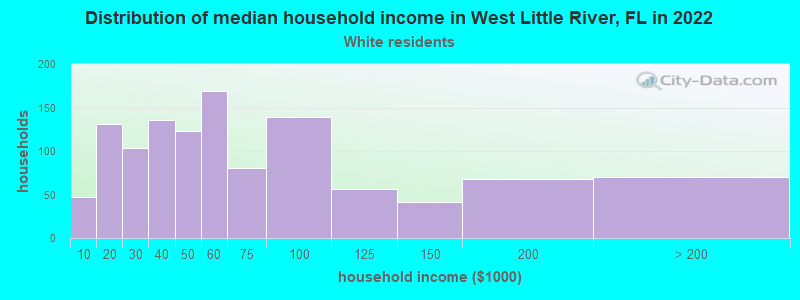
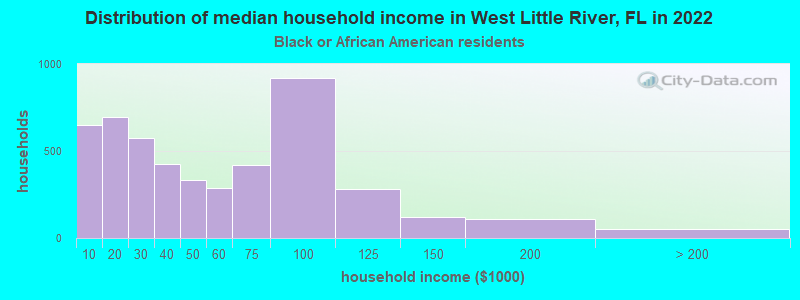
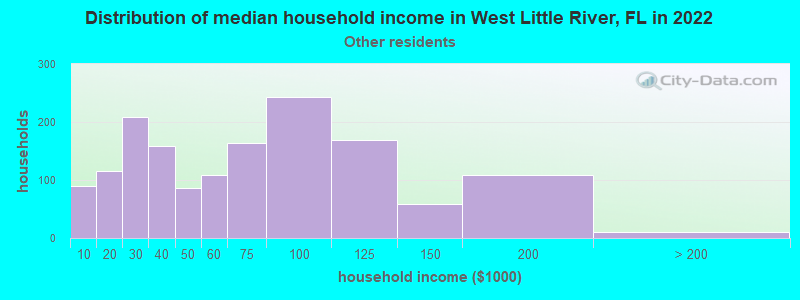
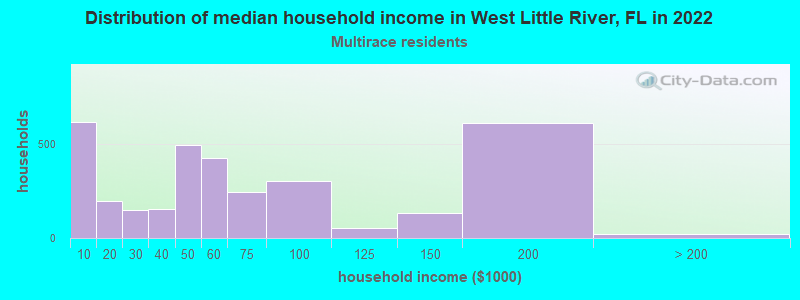
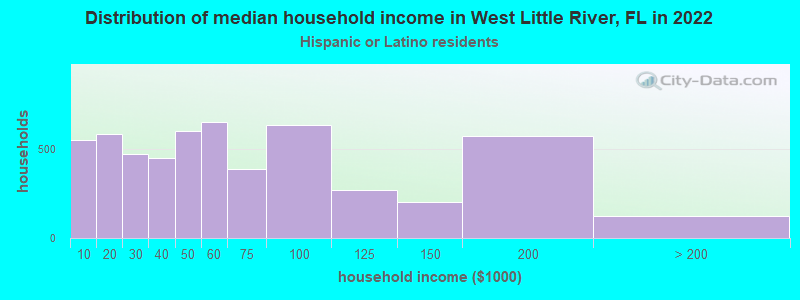
Income and house value in West Little River Median household income in 2022 $49,392 White non-Hispanic householders$44,830 Black householders$59,626 Some other race householders$51,761 Two or more races householders$51,835 Hispanic or Latino race householdersMedian 2022 house value $241,436 White Non-Hispanic householders$270,222 Black or African American householders $341,825 Asian householders$288,932 Some other race householders$316,998 Two or more races householders$301,166 Hispanic or Latino householders
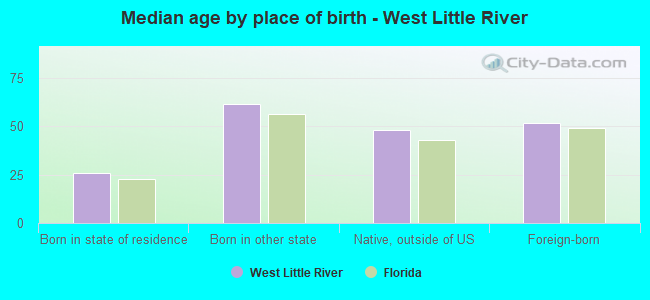
Median age by race in West Little River
43.4 Median age for White residents42.8 43.6 40.5 Median age for Black or African American residents38.2 42.7 -653,446,647.1 Median age for American Indian / Alaska Native residents-543,352,600.6 -762,696,213.5 -673,333,332.7 Median age for Asian residents-697,674,417.9 -653,626,731.2 -679,849,340.2 Median age for Native Hawaiian / Pacific Islander residents-858,307,848.3 -443,298,968.6 39.9 Median age for Other race residents40.0 41.2 41.9 Median age for Two or more races residents41.8 42.6 46.3 Median age for White alone residents57.2 12.8 44.5 Median age for Hispanic or Latino residents42.7 46.5
Owner/renter occupied households by race in West Little River
House owners and renters - White residents 813 64.0% Owner occupied457 36.0% Renter occupiedHouse owners and renters - Black or African American residents 2,900 60.1% Owner occupied1,927 39.9% Renter occupiedHouse owners and renters - Other race residents 711 44.6% Owner occupied883 55.4% Renter occupiedHouse owners and renters - Two or more races residents 1,672 49.8% Owner occupied1,684 50.2% Renter occupiedHouse owners and renters - White alone residents 120 67.2% Owner occupied59 32.8% Renter occupiedHouse owners and renters - Hispanic or Latino residents 3,023 55.0% Owner occupied2,478 45.0% Renter occupied
Language usage in West Little River
English speakers - Total 40.3% of residents of West Little River speak English at home.
50.6% of residents speak Spanish at home 7,743 49.3% Speak English very well7,977 50.7% Speak English less than very well9.3% of residents speak other language at home 1,796 62.4% Speak English very well1,082 37.6% Speak English less than very well
English speakers - Born in the United States 91.3% of residents of West Little River speak English at home.
6.1% of residents speak Spanish at home 127 90.1% Speak English very well14 9.9% Speak English less than very well2.8% of residents speak other language at home 49 76.6% Speak English very well15 23.4% Speak English less than very well
English speakers - Native, born elsewhere 22.3% of residents of West Little River speak English at home.
65.3% of residents speak Spanish at home 449 85.5% Speak English very well76 14.5% Speak English less than very well10.6% of residents speak other language at home 85 100.0% Speak English very well
English speakers - Foreign-born 6.9% of residents of West Little River speak English at home.
79.5% of residents speak Spanish at home 3,849 33.6% Speak English very well7,603 66.4% Speak English less than very well13.4% of residents speak other language at home 947 48.9% Speak English very well988 51.1% Speak English less than very well
White (Caucasian) - Speak only English Native:
29.2% (488)Foreign-born:
6.9% (118)
White (Caucasian) - Speak another language Native:
61.7% (1,030)Foreign-born:
92.1% (1,565)
Black or African American - Speak only English Native:
90.2% (9,834)Foreign-born:
16.2% (436)
Black or African American - Speak another language Native:
9.8% (1,067)Foreign-born:
82.5% (2,225)
American Indian / Alaska Native - Speak only English Native:
72.4% (10)Foreign-born:
100.0% (21)
Other race - Speak only English Native:
25.1% (433)Foreign-born:
2.9% (110)
Other race - Speak another language Native:
74.9% (1,291)Foreign-born:
97.1% (3,643)
Two or more races - Speak only English Native:
11.6% (285)Foreign-born:
5.7% (445)
Two or more races - Speak another language Native:
88.6% (2,183)Foreign-born:
94.5% (7,336)
White alone - Speak only English Native:
79.6% (278)Foreign-born:
77.5% (30)
White alone - Speak another language Native:
20.6% (72)Foreign-born:
35.1% (13)
Hispanic or Latino - Speak only English Native:
14.3% (697)Foreign-born:
4.4% (523)
Hispanic or Latino - Speak another language Native:
85.6% (4,181)Foreign-born:
95.6% (11,400)
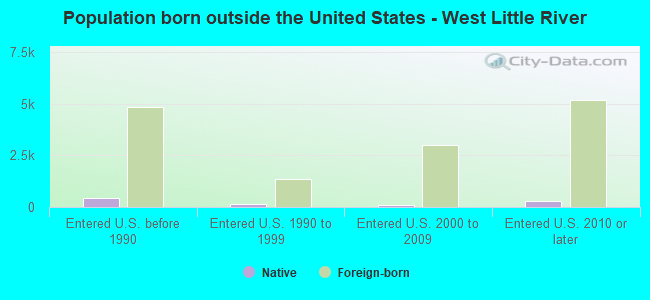
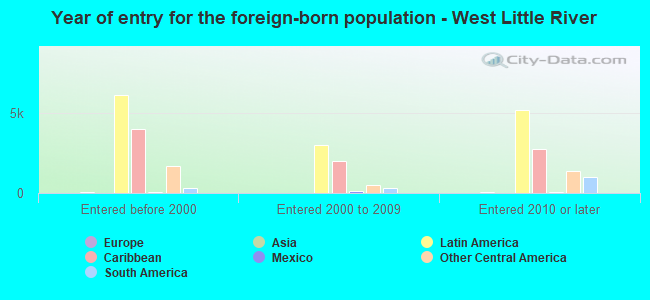
Foreign-born residents in West Little River 14,498 residents are foreign born (43.0% Latin America ).
This city:
43.6%Florida:
21.1%
Marital status for residents in West Little River Marital status - White (Caucasian) population 15 years and over
Males 44.4% Never married38.4% Now married0.8% Separated0.0% Widowed16.4% DivorcedFemales 33.2% Never married36.5% Now married8.3% Separated8.4% Widowed13.6% DivorcedWomen who gave birth in the past 12 months Now married:
100.0% (35)Unmarried:
0.0% (0)
Women who did not give birth in the past 12 months Now married:
33.6% (235)Unmarried:
66.4% (464)
Marital status - Black or African American population 15 years and over
Males 46.6% Never married32.9% Now married3.4% Separated4.1% Widowed13.0% DivorcedFemales 52.9% Never married21.4% Now married2.1% Separated12.8% Widowed10.8% DivorcedWomen who gave birth in the past 12 months Now married:
0.0% (0)Unmarried:
100.0% (142)
Women who did not give birth in the past 12 months Now married:
15.4% (463)Unmarried:
84.6% (2,536)
Marital status - Other race population 15 years and over
Males 23.9% Never married47.1% Now married12.0% Separated2.0% Widowed15.1% DivorcedFemales 20.8% Never married25.1% Now married12.6% Separated19.6% Widowed21.9% DivorcedWomen who gave birth in the past 12 months Now married:
0.0% (0)Unmarried:
100.0% (68)
Women who did not give birth in the past 12 months Now married:
70.0% (527)Unmarried:
30.0% (226)
Marital status - Two or more races population 15 years and over
Males 35.0% Never married54.3% Now married3.4% Separated0.8% Widowed6.5% DivorcedFemales 32.9% Never married45.2% Now married2.1% Separated5.2% Widowed14.7% DivorcedWomen who gave birth in the past 12 months Now married:
100.0% (148)Unmarried:
0.0% (0)
Women who did not give birth in the past 12 months Now married:
49.5% (1,134)Unmarried:
50.5% (1,154)
Marital status - White alone, not Hispanic / Latino population 15 years and over
Males 61.1% Never married28.8% Now married0.0% Separated0.0% Widowed10.1% DivorcedFemales 12.3% Never married45.2% Now married0.0% Separated28.8% Widowed13.7% DivorcedWomen who did not give birth in the past 12 months Now married:
80.0% (8)Unmarried:
20.0% (2)
Marital status - Hispanic or Latino population 15 years and over
Males 35.1% Never married47.5% Now married4.4% Separated0.5% Widowed12.5% DivorcedFemales 33.0% Never married35.0% Now married6.3% Separated9.8% Widowed15.9% DivorcedWomen who gave birth in the past 12 months Now married:
76.2% (153)Unmarried:
23.8% (48)
Women who did not give birth in the past 12 months Now married:
43.1% (1,424)Unmarried:
56.9% (1,883)
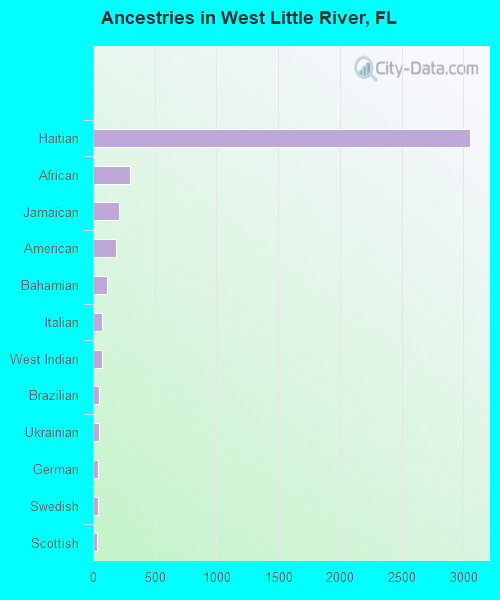
Ancestries in West Little River
3,054 12.1% Haitian301 1.2% African211 0.8% Jamaican189 0.7% American111 0.4% Bahamian75 0.3% Italian71 0.3% West Indian51 0.2% Brazilian51 0.2% Ukrainian41 0.2% German39 0.2% Swedish30 0.1% Scottish24 0.09% Trinidadian and Tobagonian22 0.09% English16 0.06% British West Indian12 0.05% French10 0.04% Iranian5 0.02% Belizean
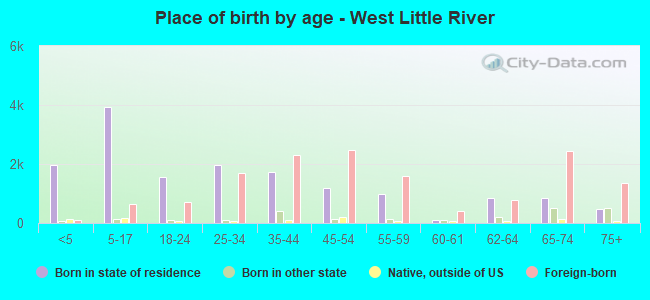
Children Nativity (place of birth) in West Little River
Children under 6 years - Living with two parents Both parents native 175 100.0% NativeBoth parents foreign-born 413 88.6% Native53 11.4% Foreign-bornOne native, one foreign-born parent 28 100.0% NativeChildren under 6 years - Living with one parent Native parent 1,335 99.7% Native5 0.3% Foreign-bornForeign-born parent 250 71.9% Native98 28.1% Foreign-bornChildren 6 to 17 years - Living with two parents Both parents native 254 98.4% Native4 1.6% Foreign-bornBoth parents foreign-born 672 80.0% Native168 20.0% Foreign-bornOne native, one foreign-born parent 317 100.0% NativeChildren 6 to 17 years - Living with one parent Native parent 1,189 100.0% NativeForeign-born parent 1,317 60.6% Native858 39.4% Foreign-born
Grandparents responsible for own grandchildren in West Little River
Grandparents (30 to 59 years) White / Caucasian 14 21.0% Responsible for grandchildren52 79.0% Not responsible for grandchildrenBlack or African American 188 78.4% Responsible for grandchildren52 21.6% Not responsible for grandchildrenOther race 96 100.0% Not responsible for grandchildrenTwo or more races 119 100.0% Not responsible for grandchildrenHispanic or Latino 24 9.4% Responsible for grandchildren228 90.6% Not responsible for grandchildrenGrandparents (60 years and over) White / Caucasian 9 8.6% Responsible for grandchildren92 91.4% Not responsible for grandchildrenBlack or African American 114 36.2% Responsible for grandchildren200 63.8% Not responsible for grandchildrenOther race 134 61.2% Responsible for grandchildren85 38.8% Not responsible for grandchildrenTwo or more races 48 9.1% Responsible for grandchildren475 90.9% Not responsible for grandchildrenHispanic or Latino 210 31.0% Responsible for grandchildren467 69.0% Not responsible for grandchildren