Races in West Linn, Oregon (OR) Detailed Stats
Data:
Races - White alone (%)
Races - White alone (% change since 2000)
Races - Black alone (%)
Races - Black alone (% change since 2000)
Races - American Indian alone (%)
Races - American Indian alone (% change since 2000)
Races - Asian alone (%)
Races - Asian alone (% change since 2000)
Races - Hispanic (%)
Races - Hispanic (% change since 2000)
Races - Native Hawaiian and Other Pacific Islander alone (%)
Races - Native Hawaiian and Other Pacific Islander alone (% change since 2000)
Races - Two or more races(%)
Races - Two or more races(% change since 2000)
Races - Other race alone (%)
Races - Other race alone (% change since 2000)
Racial diversity
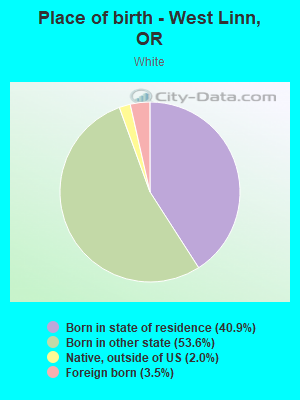
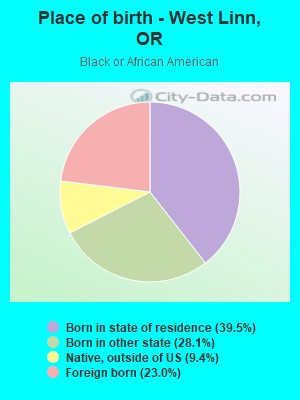
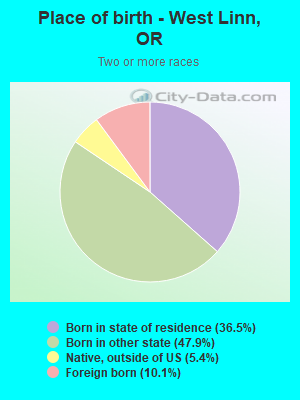
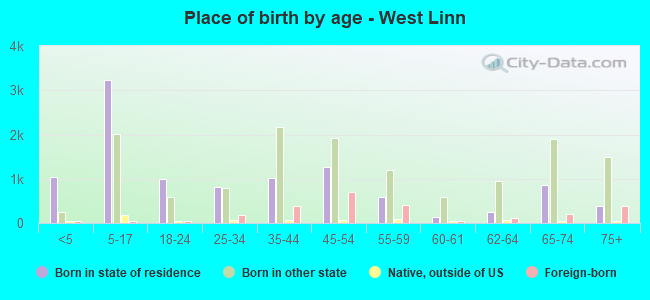
Place of birth - Born in state of residence (%)
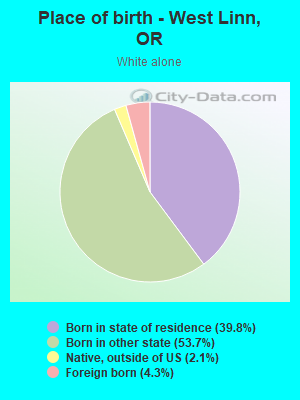
Place of birth - Born in state of residence (%) - White
Place of birth - Born in state of residence (%) - Black or African American
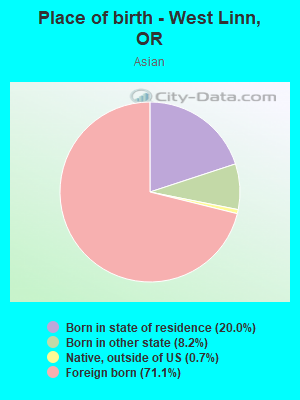
Place of birth - Born in state of residence (%) - Asian
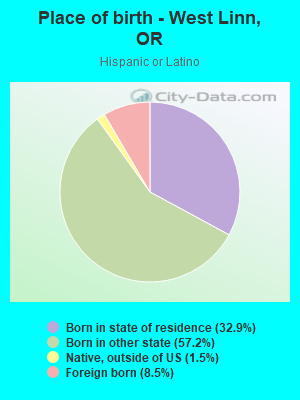
Place of birth - Born in state of residence (%) - Hispanic or Latino
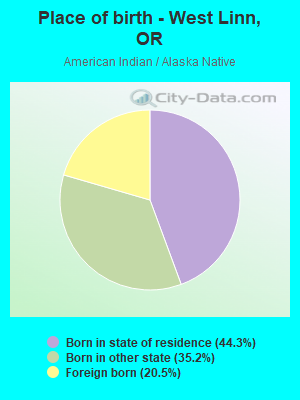
Place of birth - Born in state of residence (%) - American Indian and Alaska Native
Place of birth - Born in state of residence (%) - Multirace
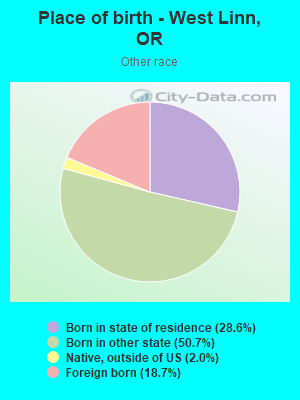
Place of birth - Born in state of residence (%) - Other Race
Place of birth - Born in other state (%)
Place of birth - Born in other state (%) - White
Place of birth - Born in other state (%) - Black or African American
Place of birth - Born in other state (%) - Asian
Place of birth - Born in other state (%) - Hispanic or Latino
Place of birth - Born in other state (%) - American Indian and Alaska Native
Place of birth - Born in other state (%) - Multirace
Place of birth - Born in other state (%) - Other Race
Place of birth - Native, outside of US (%)
Place of birth - Native, outside of US (%) - White
Place of birth - Native, outside of US (%) - Black or African American
Place of birth - Native, outside of US (%) - Asian
Place of birth - Native, outside of US (%) - Hispanic or Latino
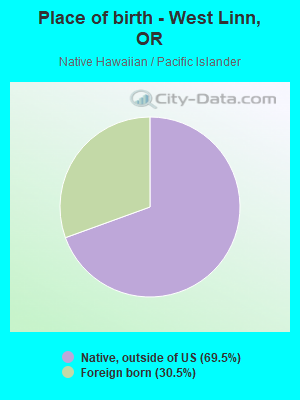
Place of birth - Native, outside of US (%) - American Indian and Alaska Native
Place of birth - Native, outside of US (%) - Multirace
Place of birth - Native, outside of US (%) - Other Race
Place of birth - Foreign born (%)
Place of birth - Foreign born (%) - White
Place of birth - Foreign born (%) - Black or African American
Place of birth - Foreign born (%) - Asian
Place of birth - Foreign born (%) - Hispanic or Latino
Place of birth - Foreign born (%) - American Indian and Alaska Native
Place of birth - Foreign born (%) - Multirace
Place of birth - Foreign born (%) - Other Race
Residents speaking English at home (%)
Residents speaking English at home - Born in the United States (%)
Residents speaking English at home - Native, born elsewhere (%)
Residents speaking English at home - Foreign born (%)
Residents speaking Spanish at home (%)
Residents speaking Spanish at home - Born in the United States (%)
Residents speaking Spanish at home - Native, born elsewhere (%)
Residents speaking Spanish at home - Foreign born (%)
Residents speaking other language at home (%)
Residents speaking other language at home - Born in the United States (%)
Residents speaking other language at home - Native, born elsewhere (%)
Residents speaking other language at home - Foreign born (%)
Marital status - Never married (%)
Marital status - Now married (%)
Marital status - Separated (%)
Marital status - Widowed (%)
Marital status - Divorced (%)
Ancestries Reported - Arab (%)
Ancestries Reported - Czech (%)
Ancestries Reported - Danish (%)
Ancestries Reported - Dutch (%)
Ancestries Reported - English (%)
Ancestries Reported - French (%)
Ancestries Reported - French Canadian (%)
Ancestries Reported - German (%)
Ancestries Reported - Greek (%)
Ancestries Reported - Hungarian (%)
Ancestries Reported - Irish (%)
Ancestries Reported - Italian (%)
Ancestries Reported - Lithuanian (%)
Ancestries Reported - Norwegian (%)
Ancestries Reported - Polish (%)
Ancestries Reported - Portuguese (%)
Ancestries Reported - Russian (%)
Ancestries Reported - Scotch-Irish (%)
Ancestries Reported - Scottish (%)
Ancestries Reported - Slovak (%)
Ancestries Reported - Subsaharan African (%)
Ancestries Reported - Swedish (%)
Ancestries Reported - Swiss (%)
Ancestries Reported - Ukrainian (%)
Ancestries Reported - United States (%)
Ancestries Reported - Welsh (%)
Ancestries Reported - West Indian (%)
Ancestries Reported - Other (%)
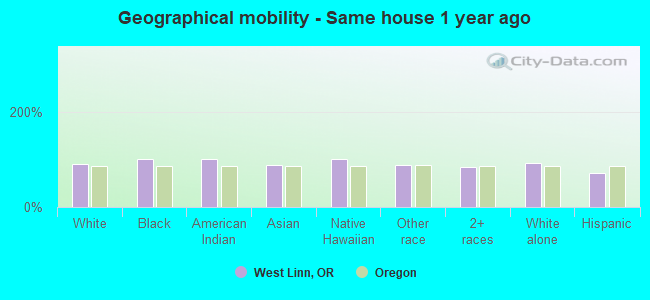
Geographical mobility - Same house 1 year ago (%)
Geographical mobility - Same house 1 year ago (%) - White
Geographical mobility - Same house 1 year ago (%) - Black or African American
Geographical mobility - Same house 1 year ago (%) - Asian
Geographical mobility - Same house 1 year ago (%) - Hispanic or Latino
Geographical mobility - Same house 1 year ago (%) - American Indian and Alaska Native
Geographical mobility - Same house 1 year ago (%) - Multirace
Geographical mobility - Same house 1 year ago (%) - Other Race
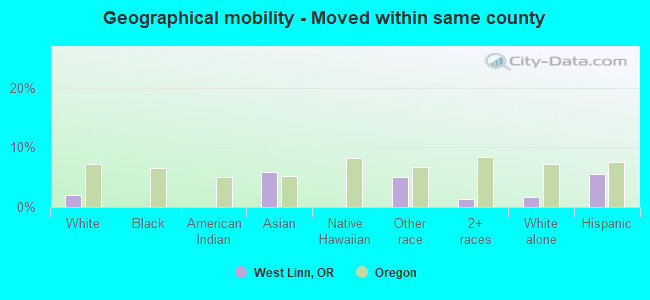
Geographical mobility - Moved within same county (%)
Geographical mobility - Moved within same county (%) - White
Geographical mobility - Moved within same county (%) - Black or African American
Geographical mobility - Moved within same county (%) - Asian
Geographical mobility - Moved within same county (%) - Hispanic or Latino
Geographical mobility - Moved within same county (%) - American Indian and Alaska Native
Geographical mobility - Moved within same county (%) - Multirace
Geographical mobility - Moved within same county (%) - Other Race
Geographical mobility - Moved from different county within same state (%)
Geographical mobility - Moved from different county within same state (%) - White
Geographical mobility - Moved from different county within same state (%) - Black or African American
Geographical mobility - Moved from different county within same state (%) - Asian
Geographical mobility - Moved from different county within same state (%) - Hispanic or Latino
Geographical mobility - Moved from different county within same state (%) - American Indian and Alaska Native
Geographical mobility - Moved from different county within same state (%) - Multirace
Geographical mobility - Moved from different county within same state (%) - Other Race
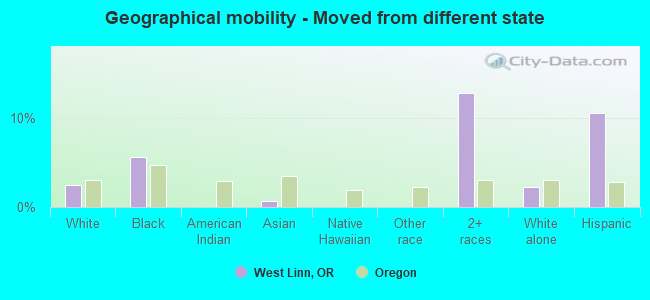
Geographical mobility - Moved from different state (%)
Geographical mobility - Moved from different state (%) - White
Geographical mobility - Moved from different state (%) - Black or African American
Geographical mobility - Moved from different state (%) - Asian
Geographical mobility - Moved from different state (%) - Hispanic or Latino
Geographical mobility - Moved from different state (%) - American Indian and Alaska Native
Geographical mobility - Moved from different state (%) - Multirace
Geographical mobility - Moved from different state (%) - Other Race
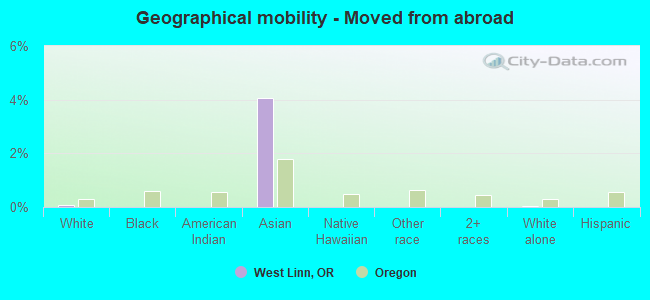
Geographical mobility - Moved from abroad (%)
Geographical mobility - Moved from abroad (%) - White
Geographical mobility - Moved from abroad (%) - Black or African American
Geographical mobility - Moved from abroad (%) - Asian
Geographical mobility - Moved from abroad (%) - Hispanic or Latino
Geographical mobility - Moved from abroad (%) - American Indian and Alaska Native
Geographical mobility - Moved from abroad (%) - Multirace
Geographical mobility - Moved from abroad (%) - Other Race
Place of birth for the foreign-born population - Ireland (%)
Place of birth for the foreign-born population - Denmark (%)
Place of birth for the foreign-born population - Norway (%)
Place of birth for the foreign-born population - Sweden (%)
Place of birth for the foreign-born population - United Kingdom (%)
Place of birth for the foreign-born population - England (%)
Place of birth for the foreign-born population - Scotland (%)
Place of birth for the foreign-born population - Other Northern Europe (%)
Place of birth for the foreign-born population - Austria (%)
Place of birth for the foreign-born population - Belgium (%)
Place of birth for the foreign-born population - France (%)
Place of birth for the foreign-born population - Germany (%)
Place of birth for the foreign-born population - Netherlands (%)
Place of birth for the foreign-born population - Switzerland (%)
Place of birth for the foreign-born population - Other Western Europe (%)
Place of birth for the foreign-born population - Greece (%)
Place of birth for the foreign-born population - Italy (%)
Place of birth for the foreign-born population - Portugal (%)
Place of birth for the foreign-born population - Spain (%)
Place of birth for the foreign-born population - Other Southern Europe (%)
Place of birth for the foreign-born population - Albania (%)
Place of birth for the foreign-born population - Belarus (%)
Place of birth for the foreign-born population - Bosnia and Herzegovina (%)
Place of birth for the foreign-born population - Bulgaria (%)
Place of birth for the foreign-born population - Croatia (%)
Place of birth for the foreign-born population - Czechoslovakia (%)
Place of birth for the foreign-born population - Hungary (%)
Place of birth for the foreign-born population - Latvia (%)
Place of birth for the foreign-born population - Lithuania (%)
Place of birth for the foreign-born population - North Macedonia (Macedonia) (%)
Place of birth for the foreign-born population - Moldova (%)
Place of birth for the foreign-born population - Poland (%)
Place of birth for the foreign-born population - Romania (%)
Place of birth for the foreign-born population - Russia (%)
Place of birth for the foreign-born population - Serbia (%)
Place of birth for the foreign-born population - Ukraine (%)
Place of birth for the foreign-born population - Other Eastern Europe (%)
Place of birth for the foreign-born population - China (%)
Place of birth for the foreign-born population - Hong Kong (%)
Place of birth for the foreign-born population - Taiwan (%)
Place of birth for the foreign-born population - Japan (%)
Place of birth for the foreign-born population - Korea (%)
Place of birth for the foreign-born population - Other Eastern Asia (%)
Place of birth for the foreign-born population - Afghanistan (%)
Place of birth for the foreign-born population - Bangladesh (%)
Place of birth for the foreign-born population - India (%)
Place of birth for the foreign-born population - Iran (%)
Place of birth for the foreign-born population - Kazakhstan (%)
Place of birth for the foreign-born population - Nepal (%)
Place of birth for the foreign-born population - Pakistan (%)
Place of birth for the foreign-born population - Sri Lanka (%)
Place of birth for the foreign-born population - Uzbekistan (%)
Place of birth for the foreign-born population - Other South Central Asia (%)
Place of birth for the foreign-born population - Burma (%)
Place of birth for the foreign-born population - Cambodia (%)
Place of birth for the foreign-born population - Indonesia (%)
Place of birth for the foreign-born population - Laos (%)
Place of birth for the foreign-born population - Malaysia (%)
Place of birth for the foreign-born population - Philippines (%)
Place of birth for the foreign-born population - Singapore (%)
Place of birth for the foreign-born population - Thailand (%)
Place of birth for the foreign-born population - Vietnam (%)
Place of birth for the foreign-born population - Other South Eastern Asia (%)
Place of birth for the foreign-born population - Armenia (%)
Place of birth for the foreign-born population - Iraq (%)
Place of birth for the foreign-born population - Israel (%)
Place of birth for the foreign-born population - Jordan (%)
Place of birth for the foreign-born population - Kuwait (%)
Place of birth for the foreign-born population - Lebanon (%)
Place of birth for the foreign-born population - Saudi Arabia (%)
Place of birth for the foreign-born population - Syria (%)
Place of birth for the foreign-born population - Turkey (%)
Place of birth for the foreign-born population - Yemen (%)
Place of birth for the foreign-born population - Other Western Asia (%)
Place of birth for the foreign-born population - Eritrea (%)
Place of birth for the foreign-born population - Ethiopia (%)
Place of birth for the foreign-born population - Kenya (%)
Place of birth for the foreign-born population - Somalia (%)
Place of birth for the foreign-born population - Uganda (%)
Place of birth for the foreign-born population - Zimbabwe (%)
Place of birth for the foreign-born population - Other Eastern Africa (%)
Place of birth for the foreign-born population - Cameroon (%)
Place of birth for the foreign-born population - Congo (%)
Place of birth for the foreign-born population - Democratic Republic of Congo (Zaire) (%)
Place of birth for the foreign-born population - Other Middle Africa (%)
Place of birth for the foreign-born population - Egypt (%)
Place of birth for the foreign-born population - Morocco (%)
Place of birth for the foreign-born population - Sudan (%)
Place of birth for the foreign-born population - Other Northern Africa (%)
Place of birth for the foreign-born population - South Africa (%)
Place of birth for the foreign-born population - Other Southern Africa (%)
Place of birth for the foreign-born population - Cabo Verde (%)
Place of birth for the foreign-born population - Ghana (%)
Place of birth for the foreign-born population - Liberia (%)
Place of birth for the foreign-born population - Nigeria (%)
Place of birth for the foreign-born population - Senegal (%)
Place of birth for the foreign-born population - Sierra Leone (%)
Place of birth for the foreign-born population - Other Western Africa (%)
Place of birth for the foreign-born population - Australia (%)
Place of birth for the foreign-born population - New Zealand (%)
Place of birth for the foreign-born population - Fiji (%)
Place of birth for the foreign-born population - Micronesia (%)
Place of birth for the foreign-born population - Bahamas (%)
Place of birth for the foreign-born population - Barbados (%)
Place of birth for the foreign-born population - Cuba (%)
Place of birth for the foreign-born population - Dominica (%)
Place of birth for the foreign-born population - Dominican Republic (%)
Place of birth for the foreign-born population - Grenada (%)
Place of birth for the foreign-born population - Haiti (%)
Place of birth for the foreign-born population - Jamaica (%)
Place of birth for the foreign-born population - St. Vincent and the Grenadines (%)
Place of birth for the foreign-born population - Trinidad and Tobago (%)
Place of birth for the foreign-born population - West Indies (%)
Place of birth for the foreign-born population - Other Caribbean (%)
Place of birth for the foreign-born population - Belize (%)
Place of birth for the foreign-born population - Costa Rica (%)
Place of birth for the foreign-born population - El Salvador (%)
Place of birth for the foreign-born population - Guatemala (%)
Place of birth for the foreign-born population - Honduras (%)
Place of birth for the foreign-born population - Mexico (%)
Place of birth for the foreign-born population - Nicaragua (%)
Place of birth for the foreign-born population - Panama (%)
Place of birth for the foreign-born population - Other Central America (%)
Place of birth for the foreign-born population - Argentina (%)
Place of birth for the foreign-born population - Bolivia (%)
Place of birth for the foreign-born population - Brazil (%)
Place of birth for the foreign-born population - Chile (%)
Place of birth for the foreign-born population - Colombia (%)
Place of birth for the foreign-born population - Ecuador (%)
Place of birth for the foreign-born population - Guyana (%)
Place of birth for the foreign-born population - Peru (%)
Place of birth for the foreign-born population - Uruguay (%)
Place of birth for the foreign-born population - Venezuela (%)
Place of birth for the foreign-born population - Other South America (%)
Place of birth for the foreign-born population - Canada (%)
Place of birth for the foreign-born population - Other Northern America (%)
Place of birth for the foreign-born population - Other (%)
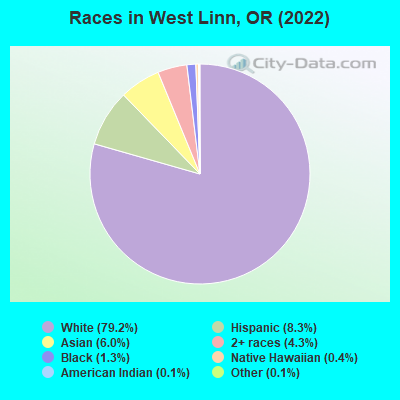
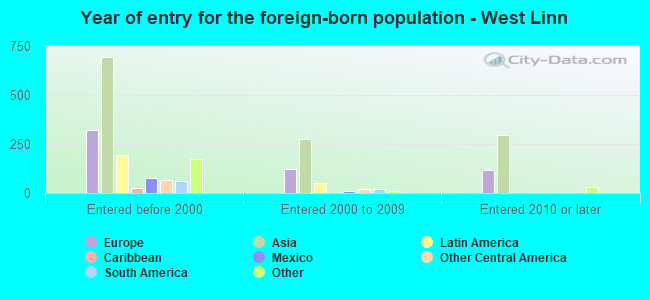
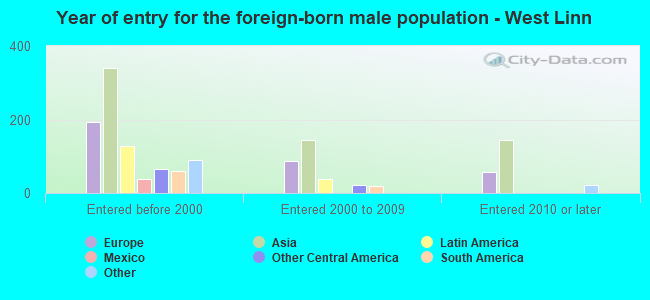
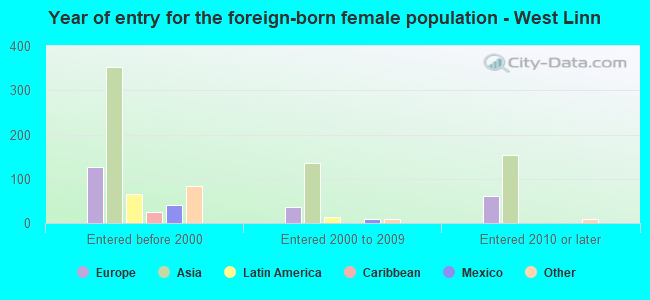
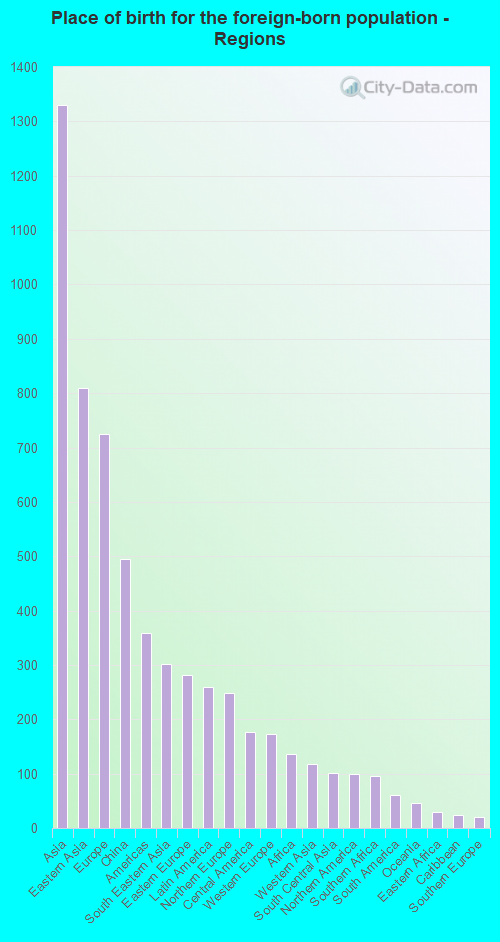
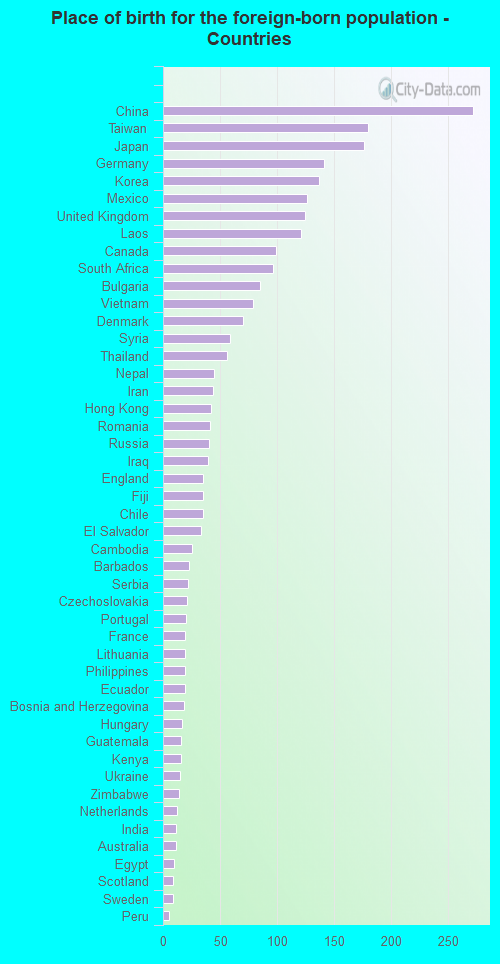
According to 2022 data, the most numerous races in West Linn, OR are White alone (21,620 residents), Hispanic (2,258 residents), and Two or more races (1,171 residents). 90.5% of West Linn residents speak English at home. 9.5% of West Linn, OR residents are foreign-born (4.8% born in Asia, 2.6% born in Europe), which is 5.5% greater than the foreign-born rate of 9.0% across the entire state of Oregon.
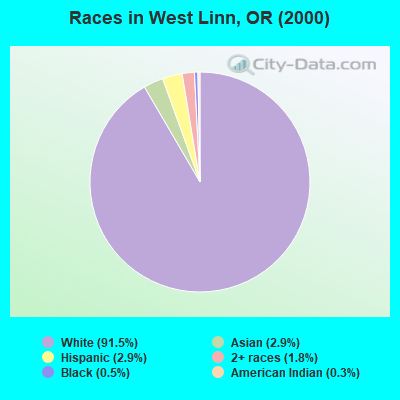
Race distribution in West Linn
2000 2022
2,857,616 83.5% White alone 275,314 8.0% Hispanic 100,333 2.9% Asian alone 82,733 2.4% Two or more races 53,325 1.6% Black alone 40,130 1.2% American Indian alone 7,398 0.2% Native Hawaiian and Other 4,550 0.1% Other race alone
3,037,571 71.6% White alone 609,538 14.4% Hispanic 252,744 6.0% Two or more races 191,283 4.5% Asian alone 78,228 1.8% Black alone 29,399 0.7% American Indian alone 25,731 0.6% Other race alone 15,643 0.4% Native Hawaiian and Other
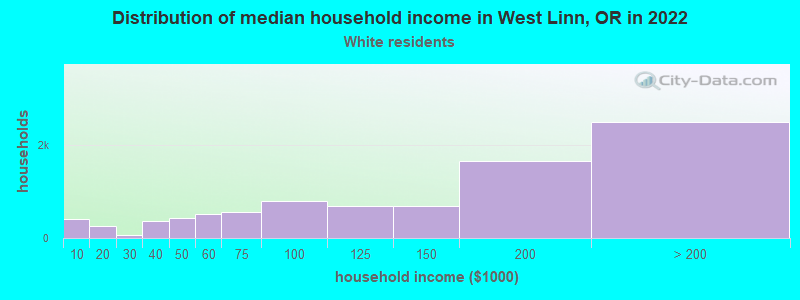
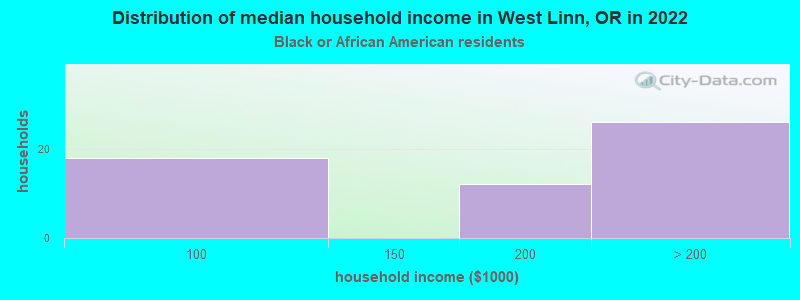
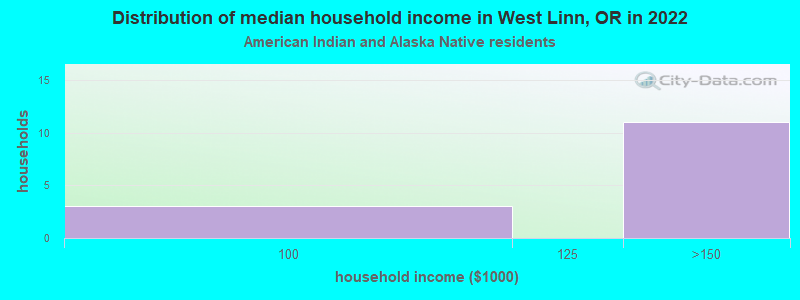
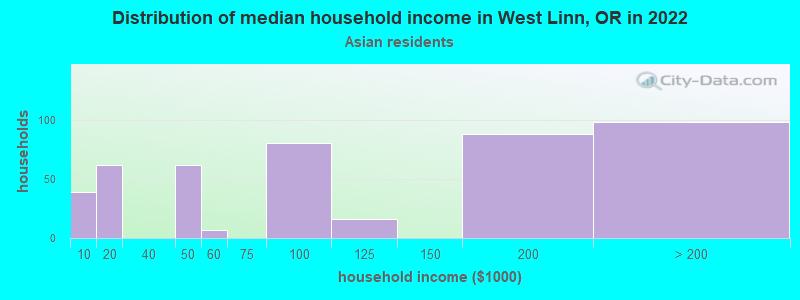
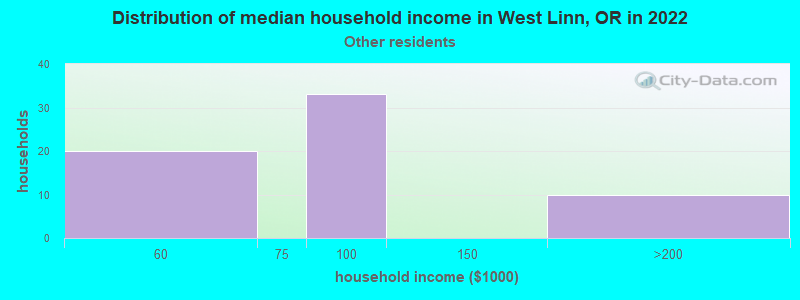
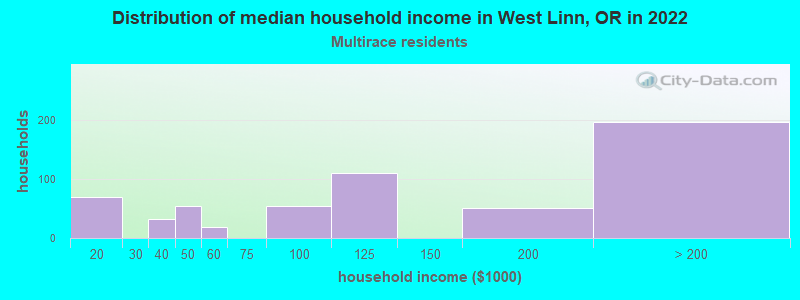
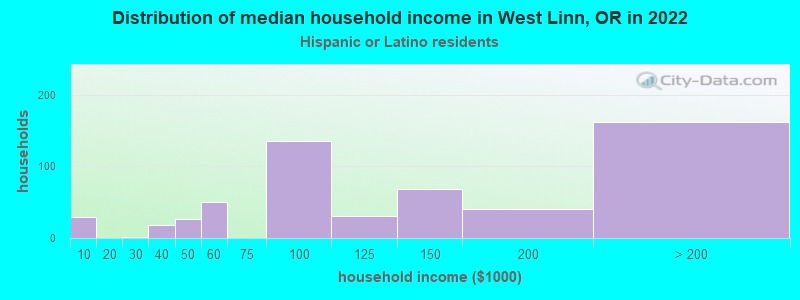
Income and house value in West Linn Median household income in 2022 $135,287 White non-Hispanic householders$93,539 Some other race householders$129,692 Two or more races householders$111,167 Hispanic or Latino race householdersMedian 2022 house value $782,719 White Non-Hispanic householdersover $1,000,000 Black or African American householdersover $1,000,000 American Indian or Alaska Native householders $841,455 Asian householders$540,753 Native Hawaiian and other Pacific Islander householders$897,957 Some other race householders$824,537 Two or more races householders$843,690 Hispanic or Latino householders
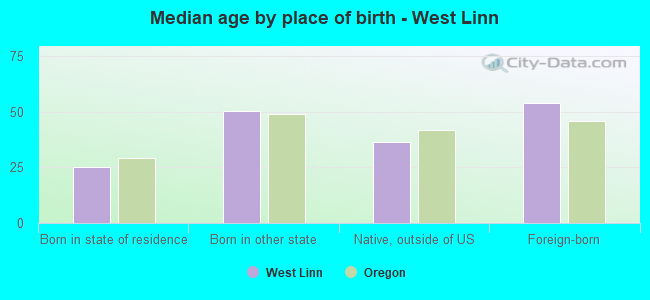
Median age by race in West Linn
47.3 Median age for White residents45.3 49.2 42.3 Median age for Black or African American residents26.7 52.5 51.0 Median age for American Indian / Alaska Native residents-600,368,323.5 57.3 44.0 Median age for Asian residents35.5 46.5 20.6 Median age for Native Hawaiian / Pacific Islander residents-764,119,600.6 20.3 30.8 Median age for Other race residents19.0 36.5 16.8 Median age for Two or more races residents18.3 17.3 47.8 Median age for White alone residents46.1 49.6 20.7 Median age for Hispanic or Latino residents18.6 26.4
Owner/renter occupied households by race in West Linn
House owners and renters - White residents 7,454 84.5% Owner occupied1,364 15.5% Renter occupiedHouse owners and renters - Black or African American residents 53 100.0% Owner occupiedHouse owners and renters - American Indian / Alaska Native residents 17 100.0% Owner occupiedHouse owners and renters - Asian residents 414 81.8% Owner occupied92 18.2% Renter occupiedHouse owners and renters - Native Hawaiian / Pacific Islander residents 14 100.0% Owner occupiedHouse owners and renters - Other race residents 37 53.5% Owner occupied32 46.5% Renter occupiedHouse owners and renters - Two or more races residents 444 72.9% Owner occupied165 27.1% Renter occupiedHouse owners and renters - White alone residents 7,230 84.0% Owner occupied1,376 16.0% Renter occupiedHouse owners and renters - Hispanic or Latino residents 458 79.5% Owner occupied118 20.5% Renter occupied
Language usage in West Linn
English speakers - Total 90.5% of residents of West Linn speak English at home.
1.6% of residents speak Spanish at home 343 84.1% Speak English very well65 15.9% Speak English less than very well8.5% of residents speak other language at home 1,309 58.9% Speak English very well915 41.1% Speak English less than very well
English speakers - Born in the United States 96.4% of residents of West Linn speak English at home.
1.9% of residents speak Spanish at home 255 98.1% Speak English very well5 1.9% Speak English less than very well1.3% of residents speak other language at home 172 95.6% Speak English very well8 4.4% Speak English less than very well
English speakers - Native, born elsewhere 83.7% of residents of West Linn speak English at home.
1.3% of residents speak Spanish at home 8 100.0% Speak English less than very well11.9% of residents speak other language at home 73 100.0% Speak English very well
English speakers - Foreign-born 30.5% of residents of West Linn speak English at home.
4.1% of residents speak Spanish at home 56 56.6% Speak English very well43 43.4% Speak English less than very well70.6% of residents speak other language at home 721 42.8% Speak English very well965 57.2% Speak English less than very well
White (Caucasian) - Speak only English Native:
98.4% (20,286)Foreign-born:
49.9% (389)
White (Caucasian) - Speak another language Native:
1.8% (379)Foreign-born:
51.7% (404)
Black or African American - Speak only English Native:
99.5% (175)Foreign-born:
74.6% (41)
Asian - Speak only English Native:
53.5% (234)Foreign-born:
7.8% (88)
Asian - Speak another language Native:
43.0% (188)Foreign-born:
95.5% (1,084)
Other race - Speak only English Native:
40.8% (104)Foreign-born:
38.7% (30)
Other race - Speak another language Native:
58.7% (149)Foreign-born:
71.1% (55)
Two or more races - Speak only English Native:
93.9% (1,685)Foreign-born:
89.4% (218)
Two or more races - Speak another language Native:
6.1% (110)Foreign-born:
29.4% (72)
White alone - Speak only English Native:
98.1% (19,495)Foreign-born:
41.3% (384)
White alone - Speak another language Native:
1.9% (376)Foreign-born:
58.4% (543)
Hispanic or Latino - Speak only English Native:
94.5% (1,823)Foreign-born:
73.4% (149)
Hispanic or Latino - Speak another language Native:
12.0% (231)Foreign-born:
53.5% (109)
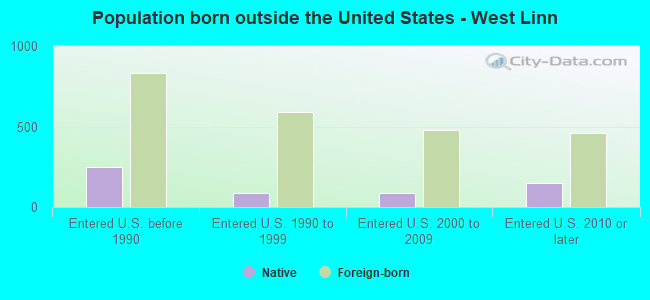
Foreign-born residents in West Linn 2,600 residents are foreign born (4.8% Asia , 2.6% Europe ).
This city:
9.5%Oregon:
9.8%
Marital status for residents in West Linn Marital status - White (Caucasian) population 15 years and over
Males 24.1% Never married65.4% Now married0.3% Separated1.5% Widowed8.7% DivorcedFemales 17.9% Never married59.6% Now married1.1% Separated8.5% Widowed12.9% DivorcedWomen who gave birth in the past 12 months Now married:
100.0% (193)Unmarried:
0.0% (0)
Women who did not give birth in the past 12 months Now married:
57.6% (2,374)Unmarried:
42.4% (1,748)
Marital status - Black or African American population 15 years and over
Males 80.9% Never married19.1% Now married0.0% Separated0.0% Widowed0.0% DivorcedFemales 0.0% Never married48.6% Now married0.0% Separated0.0% Widowed51.4% DivorcedMarital status - American Indian / Alaska Native population 15 years and over
Males 0.0% Never married100.0% Now married0.0% Separated0.0% Widowed0.0% DivorcedFemales 16.7% Never married83.3% Now married0.0% Separated0.0% Widowed0.0% DivorcedWomen who did not give birth in the past 12 months Now married:
0.0% (0)Unmarried:
100.0% (4)
Marital status - Asian population 15 years and over
Males 20.8% Never married75.9% Now married0.0% Separated0.0% Widowed3.3% DivorcedFemales 22.6% Never married59.7% Now married3.9% Separated10.2% Widowed3.6% DivorcedWomen who gave birth in the past 12 months Now married:
100.0% (5)Unmarried:
0.0% (0)
Women who did not give birth in the past 12 months Now married:
72.7% (290)Unmarried:
27.3% (109)
Marital status - Native Hawaiian / Pacific Islander population 15 years and over
Males 0.0% Never married100.0% Now married0.0% Separated0.0% Widowed0.0% DivorcedFemales 51.4% Never married48.6% Now married0.0% Separated0.0% Widowed0.0% DivorcedWomen who did not give birth in the past 12 months Now married:
0.0% (0)Unmarried:
100.0% (19)
Marital status - Other race population 15 years and over
Males 50.0% Never married50.0% Now married0.0% Separated0.0% Widowed0.0% DivorcedFemales 28.8% Never married55.8% Now married0.0% Separated5.1% Widowed10.3% DivorcedWomen who gave birth in the past 12 months Now married:
100.0% (57)Unmarried:
0.0% (0)
Women who did not give birth in the past 12 months Now married:
30.8% (27)Unmarried:
69.2% (61)
Marital status - Two or more races population 15 years and over
Males 24.5% Never married75.5% Now married0.0% Separated0.0% Widowed0.0% DivorcedFemales 30.1% Never married56.7% Now married2.7% Separated0.0% Widowed10.4% DivorcedWomen who did not give birth in the past 12 months Now married:
58.1% (292)Unmarried:
41.9% (211)
Marital status - White alone, not Hispanic / Latino population 15 years and over
Males 23.0% Never married66.4% Now married0.3% Separated1.6% Widowed8.7% DivorcedFemales 17.4% Never married60.5% Now married1.2% Separated7.7% Widowed13.2% DivorcedWomen who gave birth in the past 12 months Now married:
100.0% (196)Unmarried:
0.0% (0)
Women who did not give birth in the past 12 months Now married:
58.6% (2,346)Unmarried:
41.4% (1,657)
Marital status - Hispanic or Latino population 15 years and over
Males 41.0% Never married54.4% Now married0.0% Separated0.0% Widowed4.6% DivorcedFemales 33.3% Never married47.3% Now married0.1% Separated15.2% Widowed4.1% DivorcedWomen who gave birth in the past 12 months Now married:
100.0% (44)Unmarried:
0.0% (0)
Women who did not give birth in the past 12 months Now married:
42.3% (204)Unmarried:
57.7% (278)
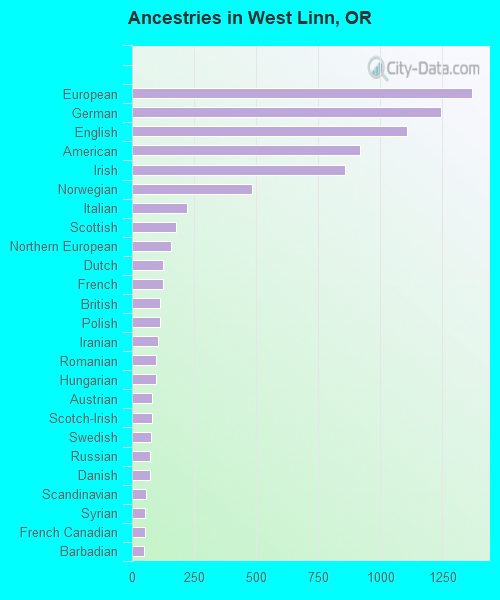
Ancestries in West Linn
1,369 11.9% European1,245 10.8% German1,106 9.6% English920 8.0% American857 7.5% Irish485 4.2% Norwegian220 1.9% Italian176 1.5% Scottish157 1.4% Northern European126 1.1% Dutch124 1.1% French112 1.0% British112 1.0% Polish105 0.9% Iranian97 0.8% Romanian96 0.8% Hungarian82 0.7% Austrian81 0.7% Scotch-Irish77 0.7% Swedish74 0.6% Russian71 0.6% Danish58 0.5% Scandinavian53 0.5% Syrian51 0.4% French Canadian48 0.4% Barbadian46 0.4% Lithuanian42 0.4% Welsh33 0.3% Greek30 0.3% Lebanese29 0.3% South African25 0.2% Canadian25 0.2% Swiss21 0.2% Serbian19 0.2% Cypriot18 0.2% Latvian17 0.1% Czech16 0.1% Portuguese15 0.1% Ukrainian14 0.1% Zimbabwean13 0.1% Palestinian12 0.1% Croatian12 0.1% Slovak10 0.09% Yugoslavian7 0.06% Kenyan6 0.05% Belgian5 0.04% Bulgarian3 0.03% Eastern European
Geographical mobility in West Linn Same house 1 year ago 20,059 90.3% White (Caucasian)238 99.9% Black or African American35 100.0% American Indian / Alaska Native1,468 88.7% Asian75 100.0% Native Hawaiian / Pacific Islander370 88.7% Other race1,929 83.9% Two or more races19,748 91.6% White alone, not Hispanic / Latino1,602 71.4% Hispanic or LatinoMoved within same county 448 2.0% White / Caucasian97 5.9% Asian21 5.0% Other race30 1.3% Two or more races367 1.7% White alone, not Hispanic / Latino122 5.5% Hispanic or LatinoMoved within same state 1,346 6.1% White / Caucasian6 0.3% Asian25 5.9% Other race113 4.9% Two or more races1,098 5.1% White alone, not Hispanic / Latino235 10.5% Hispanic or LatinoMoved from different state 550 2.5% White / Caucasian13 5.6% Black or African American12 0.7% Asian293 12.8% Two or more races478 2.2% White alone, not Hispanic / Latino235 10.5% Hispanic or LatinoMoved from abroad 13 0.1% White67 4.1% Asian5 0.0% White alone, not Hispanic / Latino
Children Nativity (place of birth) in West Linn
Children under 6 years - Living with two parents Both parents native 1,344 100.0% NativeBoth parents foreign-born 55 100.0% NativeOne native, one foreign-born parent 193 100.0% NativeChildren under 6 years - Living with one parent Native parent 52 100.0% NativeChildren 6 to 17 years - Living with two parents Both parents native 3,586 99.7% Native11 0.3% Foreign-bornBoth parents foreign-born 194 82.4% Native41 17.6% Foreign-bornOne native, one foreign-born parent 231 100.0% NativeChildren 6 to 17 years - Living with one parent Native parent 718 100.0% NativeForeign-born parent 4 47.4% Native4 52.6% Foreign-born
Grandparents responsible for own grandchildren in West Linn
Grandparents (30 to 59 years) White / Caucasian 26 100.0% Not responsible for grandchildrenOther race 24 100.0% Responsible for grandchildrenWhite alone, not Hispanic / Latino 14 100.0% Not responsible for grandchildrenHispanic or Latino 16 100.0% Responsible for grandchildrenGrandparents (60 years and over) White / Caucasian 73 32.9% Responsible for grandchildren149 67.1% Not responsible for grandchildrenOther race 10 100.0% Not responsible for grandchildrenWhite alone, not Hispanic / Latino 73 31.6% Responsible for grandchildren158 68.4% Not responsible for grandchildrenHispanic or Latino 9 100.0% Not responsible for grandchildren