Races in West Jordan, Utah (UT) Detailed Stats
Data:
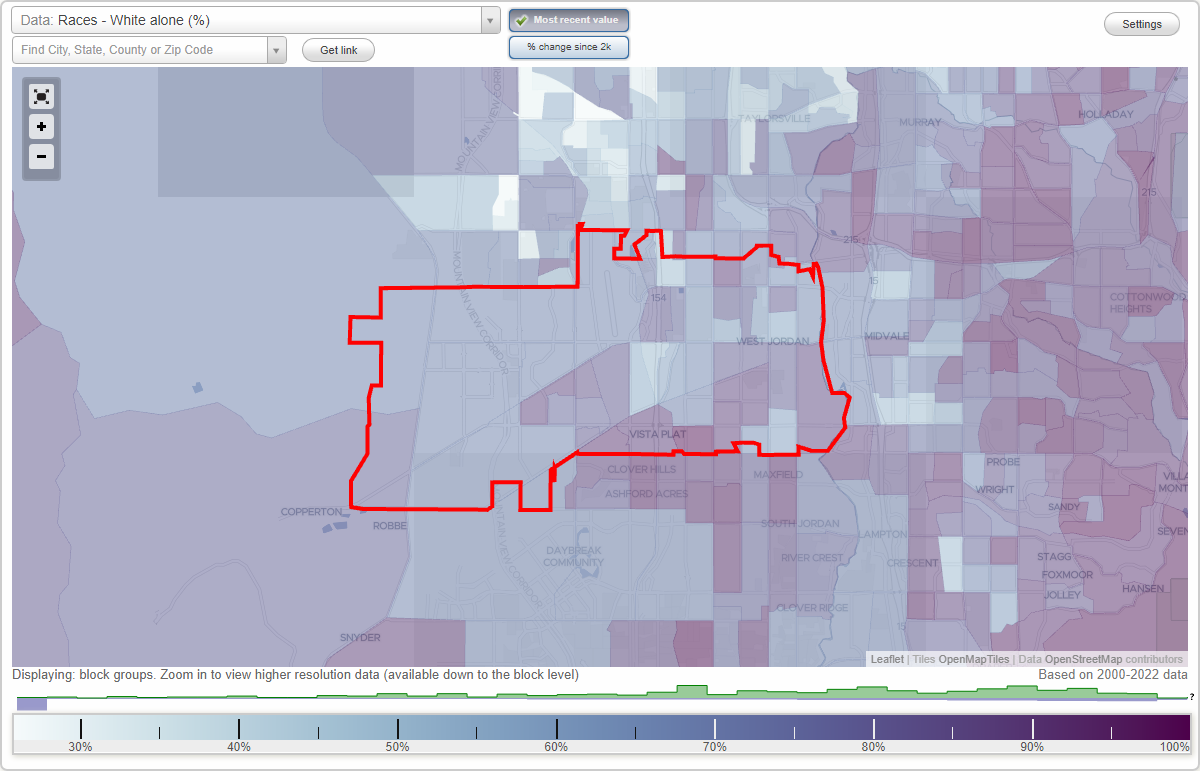
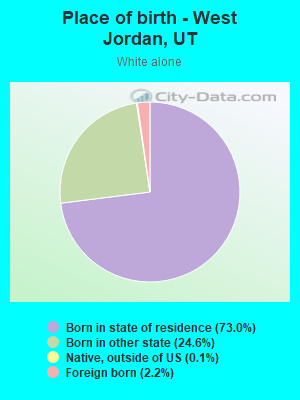
Races - White alone (%)
Races - White alone (% change since 2000)
Races - Black alone (%)
Races - Black alone (% change since 2000)
Races - American Indian alone (%)
Races - American Indian alone (% change since 2000)
Races - Asian alone (%)
Races - Asian alone (% change since 2000)
Races - Hispanic (%)
Races - Hispanic (% change since 2000)
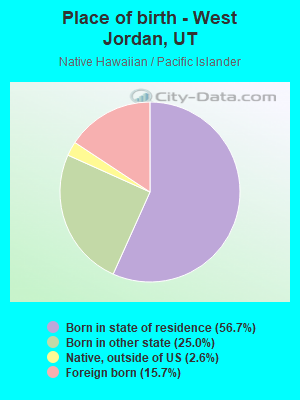
Races - Native Hawaiian and Other Pacific Islander alone (%)
Races - Native Hawaiian and Other Pacific Islander alone (% change since 2000)
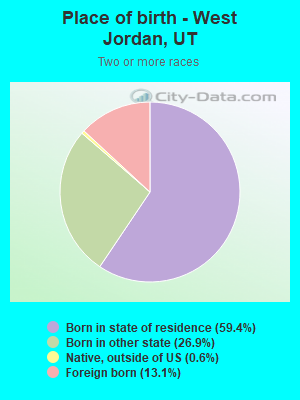
Races - Two or more races(%)
Races - Two or more races(% change since 2000)
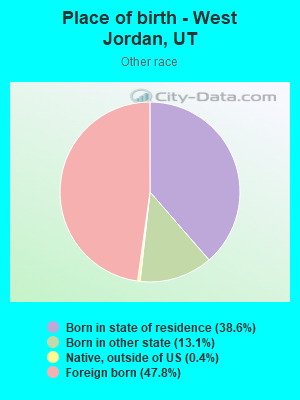
Races - Other race alone (%)
Races - Other race alone (% change since 2000)
Racial diversity
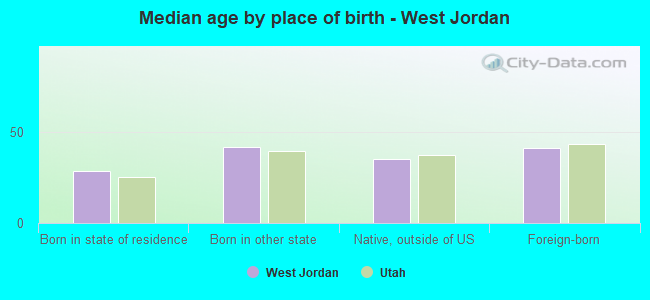
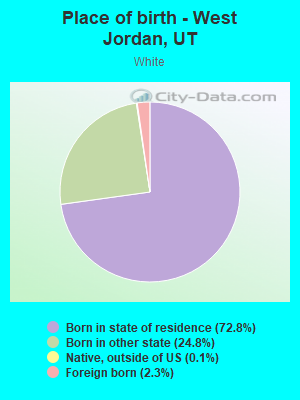
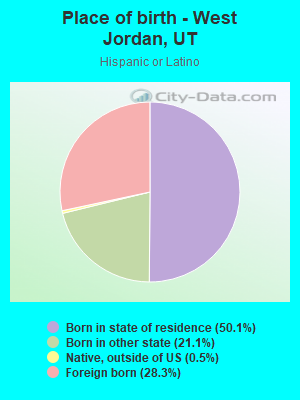
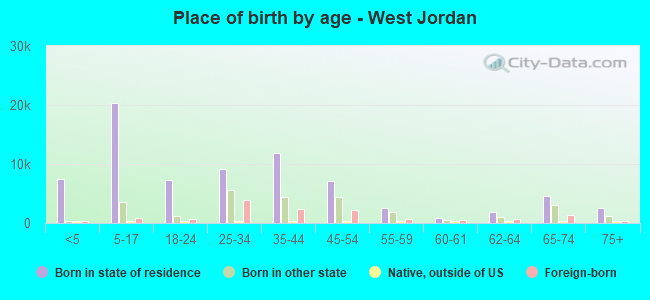
Place of birth - Born in state of residence (%)
Place of birth - Born in state of residence (%) - White
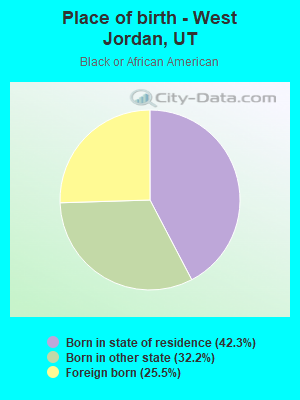
Place of birth - Born in state of residence (%) - Black or African American
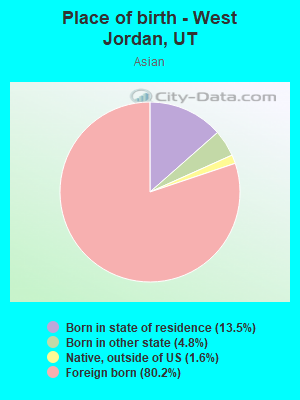
Place of birth - Born in state of residence (%) - Asian
Place of birth - Born in state of residence (%) - Hispanic or Latino
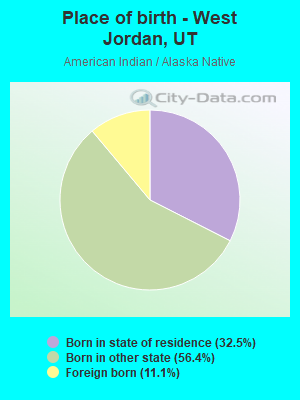
Place of birth - Born in state of residence (%) - American Indian and Alaska Native
Place of birth - Born in state of residence (%) - Multirace
Place of birth - Born in state of residence (%) - Other Race
Place of birth - Born in other state (%)
Place of birth - Born in other state (%) - White
Place of birth - Born in other state (%) - Black or African American
Place of birth - Born in other state (%) - Asian
Place of birth - Born in other state (%) - Hispanic or Latino
Place of birth - Born in other state (%) - American Indian and Alaska Native
Place of birth - Born in other state (%) - Multirace
Place of birth - Born in other state (%) - Other Race
Place of birth - Native, outside of US (%)
Place of birth - Native, outside of US (%) - White
Place of birth - Native, outside of US (%) - Black or African American
Place of birth - Native, outside of US (%) - Asian
Place of birth - Native, outside of US (%) - Hispanic or Latino
Place of birth - Native, outside of US (%) - American Indian and Alaska Native
Place of birth - Native, outside of US (%) - Multirace
Place of birth - Native, outside of US (%) - Other Race
Place of birth - Foreign born (%)
Place of birth - Foreign born (%) - White
Place of birth - Foreign born (%) - Black or African American
Place of birth - Foreign born (%) - Asian
Place of birth - Foreign born (%) - Hispanic or Latino
Place of birth - Foreign born (%) - American Indian and Alaska Native
Place of birth - Foreign born (%) - Multirace
Place of birth - Foreign born (%) - Other Race
Residents speaking English at home (%)
Residents speaking English at home - Born in the United States (%)
Residents speaking English at home - Native, born elsewhere (%)
Residents speaking English at home - Foreign born (%)
Residents speaking Spanish at home (%)
Residents speaking Spanish at home - Born in the United States (%)
Residents speaking Spanish at home - Native, born elsewhere (%)
Residents speaking Spanish at home - Foreign born (%)
Residents speaking other language at home (%)
Residents speaking other language at home - Born in the United States (%)
Residents speaking other language at home - Native, born elsewhere (%)
Residents speaking other language at home - Foreign born (%)
Marital status - Never married (%)
Marital status - Now married (%)
Marital status - Separated (%)
Marital status - Widowed (%)
Marital status - Divorced (%)
Ancestries Reported - Arab (%)
Ancestries Reported - Czech (%)
Ancestries Reported - Danish (%)
Ancestries Reported - Dutch (%)
Ancestries Reported - English (%)
Ancestries Reported - French (%)
Ancestries Reported - French Canadian (%)
Ancestries Reported - German (%)
Ancestries Reported - Greek (%)
Ancestries Reported - Hungarian (%)
Ancestries Reported - Irish (%)
Ancestries Reported - Italian (%)
Ancestries Reported - Lithuanian (%)
Ancestries Reported - Norwegian (%)
Ancestries Reported - Polish (%)
Ancestries Reported - Portuguese (%)
Ancestries Reported - Russian (%)
Ancestries Reported - Scotch-Irish (%)
Ancestries Reported - Scottish (%)
Ancestries Reported - Slovak (%)
Ancestries Reported - Subsaharan African (%)
Ancestries Reported - Swedish (%)
Ancestries Reported - Swiss (%)
Ancestries Reported - Ukrainian (%)
Ancestries Reported - United States (%)
Ancestries Reported - Welsh (%)
Ancestries Reported - West Indian (%)
Ancestries Reported - Other (%)
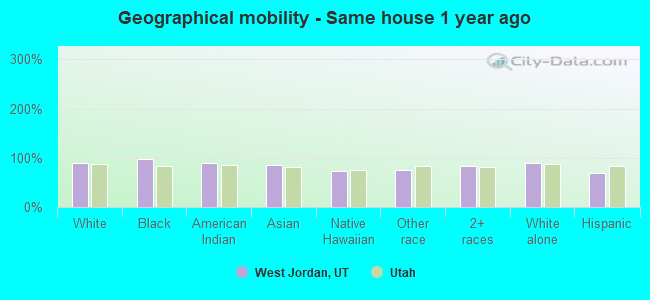
Geographical mobility - Same house 1 year ago (%)
Geographical mobility - Same house 1 year ago (%) - White
Geographical mobility - Same house 1 year ago (%) - Black or African American
Geographical mobility - Same house 1 year ago (%) - Asian
Geographical mobility - Same house 1 year ago (%) - Hispanic or Latino
Geographical mobility - Same house 1 year ago (%) - American Indian and Alaska Native
Geographical mobility - Same house 1 year ago (%) - Multirace
Geographical mobility - Same house 1 year ago (%) - Other Race
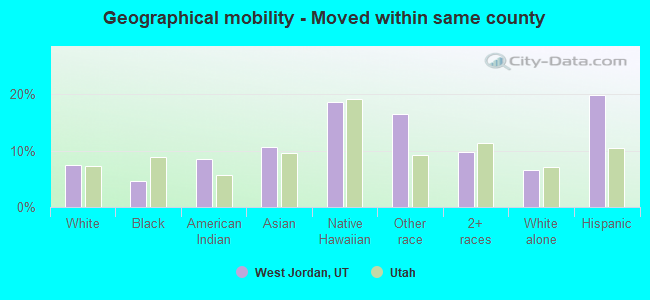
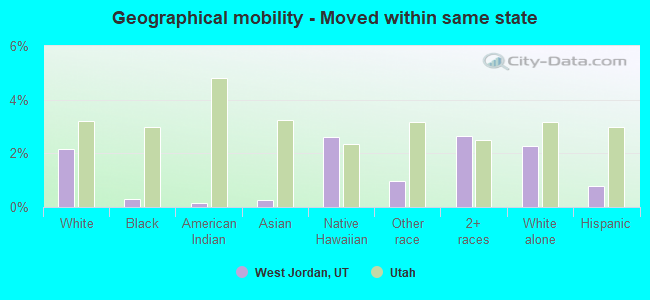
Geographical mobility - Moved within same county (%)
Geographical mobility - Moved within same county (%) - White
Geographical mobility - Moved within same county (%) - Black or African American
Geographical mobility - Moved within same county (%) - Asian
Geographical mobility - Moved within same county (%) - Hispanic or Latino
Geographical mobility - Moved within same county (%) - American Indian and Alaska Native
Geographical mobility - Moved within same county (%) - Multirace
Geographical mobility - Moved within same county (%) - Other Race
Geographical mobility - Moved from different county within same state (%)
Geographical mobility - Moved from different county within same state (%) - White
Geographical mobility - Moved from different county within same state (%) - Black or African American
Geographical mobility - Moved from different county within same state (%) - Asian
Geographical mobility - Moved from different county within same state (%) - Hispanic or Latino
Geographical mobility - Moved from different county within same state (%) - American Indian and Alaska Native
Geographical mobility - Moved from different county within same state (%) - Multirace
Geographical mobility - Moved from different county within same state (%) - Other Race
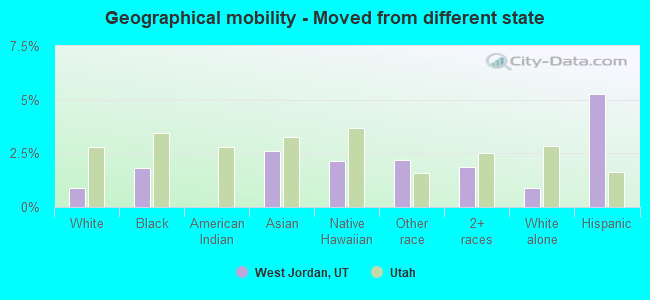
Geographical mobility - Moved from different state (%)
Geographical mobility - Moved from different state (%) - White
Geographical mobility - Moved from different state (%) - Black or African American
Geographical mobility - Moved from different state (%) - Asian
Geographical mobility - Moved from different state (%) - Hispanic or Latino
Geographical mobility - Moved from different state (%) - American Indian and Alaska Native
Geographical mobility - Moved from different state (%) - Multirace
Geographical mobility - Moved from different state (%) - Other Race
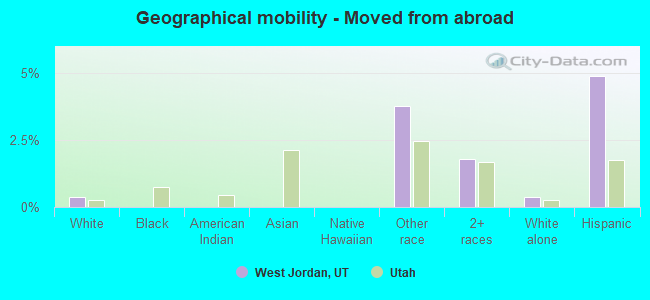
Geographical mobility - Moved from abroad (%)
Geographical mobility - Moved from abroad (%) - White
Geographical mobility - Moved from abroad (%) - Black or African American
Geographical mobility - Moved from abroad (%) - Asian
Geographical mobility - Moved from abroad (%) - Hispanic or Latino
Geographical mobility - Moved from abroad (%) - American Indian and Alaska Native
Geographical mobility - Moved from abroad (%) - Multirace
Geographical mobility - Moved from abroad (%) - Other Race
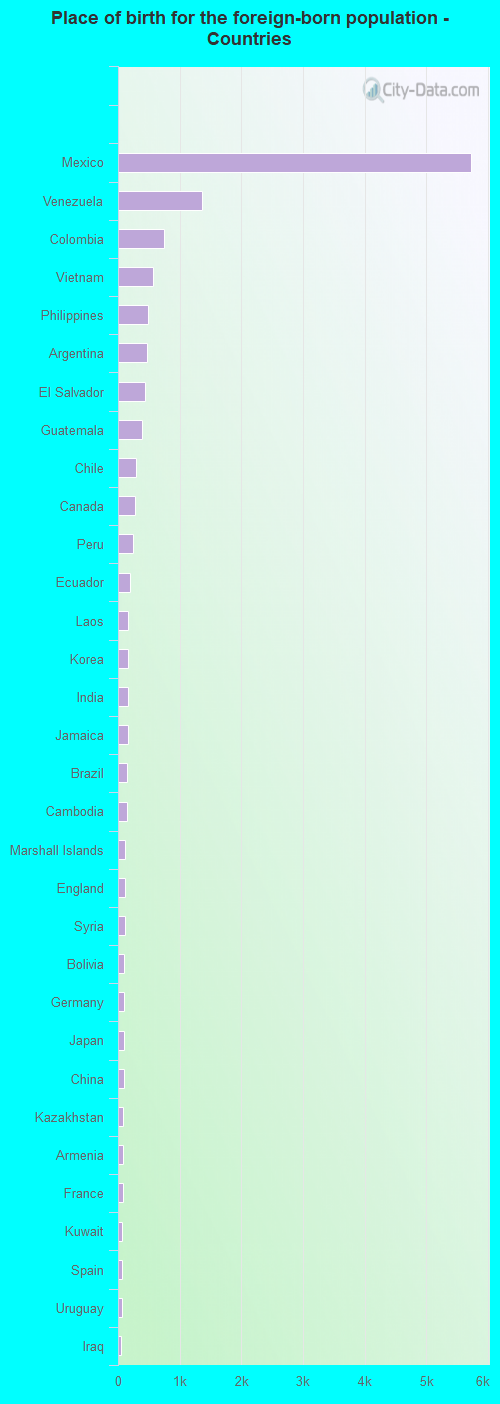
Place of birth for the foreign-born population - Ireland (%)
Place of birth for the foreign-born population - Denmark (%)
Place of birth for the foreign-born population - Norway (%)
Place of birth for the foreign-born population - Sweden (%)
Place of birth for the foreign-born population - United Kingdom (%)
Place of birth for the foreign-born population - England (%)
Place of birth for the foreign-born population - Scotland (%)
Place of birth for the foreign-born population - Other Northern Europe (%)
Place of birth for the foreign-born population - Austria (%)
Place of birth for the foreign-born population - Belgium (%)
Place of birth for the foreign-born population - France (%)
Place of birth for the foreign-born population - Germany (%)
Place of birth for the foreign-born population - Netherlands (%)
Place of birth for the foreign-born population - Switzerland (%)
Place of birth for the foreign-born population - Other Western Europe (%)
Place of birth for the foreign-born population - Greece (%)
Place of birth for the foreign-born population - Italy (%)
Place of birth for the foreign-born population - Portugal (%)
Place of birth for the foreign-born population - Spain (%)
Place of birth for the foreign-born population - Other Southern Europe (%)
Place of birth for the foreign-born population - Albania (%)
Place of birth for the foreign-born population - Belarus (%)
Place of birth for the foreign-born population - Bosnia and Herzegovina (%)
Place of birth for the foreign-born population - Bulgaria (%)
Place of birth for the foreign-born population - Croatia (%)
Place of birth for the foreign-born population - Czechoslovakia (%)
Place of birth for the foreign-born population - Hungary (%)
Place of birth for the foreign-born population - Latvia (%)
Place of birth for the foreign-born population - Lithuania (%)
Place of birth for the foreign-born population - North Macedonia (Macedonia) (%)
Place of birth for the foreign-born population - Moldova (%)
Place of birth for the foreign-born population - Poland (%)
Place of birth for the foreign-born population - Romania (%)
Place of birth for the foreign-born population - Russia (%)
Place of birth for the foreign-born population - Serbia (%)
Place of birth for the foreign-born population - Ukraine (%)
Place of birth for the foreign-born population - Other Eastern Europe (%)
Place of birth for the foreign-born population - China (%)
Place of birth for the foreign-born population - Hong Kong (%)
Place of birth for the foreign-born population - Taiwan (%)
Place of birth for the foreign-born population - Japan (%)
Place of birth for the foreign-born population - Korea (%)
Place of birth for the foreign-born population - Other Eastern Asia (%)
Place of birth for the foreign-born population - Afghanistan (%)
Place of birth for the foreign-born population - Bangladesh (%)
Place of birth for the foreign-born population - India (%)
Place of birth for the foreign-born population - Iran (%)
Place of birth for the foreign-born population - Kazakhstan (%)
Place of birth for the foreign-born population - Nepal (%)
Place of birth for the foreign-born population - Pakistan (%)
Place of birth for the foreign-born population - Sri Lanka (%)
Place of birth for the foreign-born population - Uzbekistan (%)
Place of birth for the foreign-born population - Other South Central Asia (%)
Place of birth for the foreign-born population - Burma (%)
Place of birth for the foreign-born population - Cambodia (%)
Place of birth for the foreign-born population - Indonesia (%)
Place of birth for the foreign-born population - Laos (%)
Place of birth for the foreign-born population - Malaysia (%)
Place of birth for the foreign-born population - Philippines (%)
Place of birth for the foreign-born population - Singapore (%)
Place of birth for the foreign-born population - Thailand (%)
Place of birth for the foreign-born population - Vietnam (%)
Place of birth for the foreign-born population - Other South Eastern Asia (%)
Place of birth for the foreign-born population - Armenia (%)
Place of birth for the foreign-born population - Iraq (%)
Place of birth for the foreign-born population - Israel (%)
Place of birth for the foreign-born population - Jordan (%)
Place of birth for the foreign-born population - Kuwait (%)
Place of birth for the foreign-born population - Lebanon (%)
Place of birth for the foreign-born population - Saudi Arabia (%)
Place of birth for the foreign-born population - Syria (%)
Place of birth for the foreign-born population - Turkey (%)
Place of birth for the foreign-born population - Yemen (%)
Place of birth for the foreign-born population - Other Western Asia (%)
Place of birth for the foreign-born population - Eritrea (%)
Place of birth for the foreign-born population - Ethiopia (%)
Place of birth for the foreign-born population - Kenya (%)
Place of birth for the foreign-born population - Somalia (%)
Place of birth for the foreign-born population - Uganda (%)
Place of birth for the foreign-born population - Zimbabwe (%)
Place of birth for the foreign-born population - Other Eastern Africa (%)
Place of birth for the foreign-born population - Cameroon (%)
Place of birth for the foreign-born population - Congo (%)
Place of birth for the foreign-born population - Democratic Republic of Congo (Zaire) (%)
Place of birth for the foreign-born population - Other Middle Africa (%)
Place of birth for the foreign-born population - Egypt (%)
Place of birth for the foreign-born population - Morocco (%)
Place of birth for the foreign-born population - Sudan (%)
Place of birth for the foreign-born population - Other Northern Africa (%)
Place of birth for the foreign-born population - South Africa (%)
Place of birth for the foreign-born population - Other Southern Africa (%)
Place of birth for the foreign-born population - Cabo Verde (%)
Place of birth for the foreign-born population - Ghana (%)
Place of birth for the foreign-born population - Liberia (%)
Place of birth for the foreign-born population - Nigeria (%)
Place of birth for the foreign-born population - Senegal (%)
Place of birth for the foreign-born population - Sierra Leone (%)
Place of birth for the foreign-born population - Other Western Africa (%)
Place of birth for the foreign-born population - Australia (%)
Place of birth for the foreign-born population - New Zealand (%)
Place of birth for the foreign-born population - Fiji (%)
Place of birth for the foreign-born population - Micronesia (%)
Place of birth for the foreign-born population - Bahamas (%)
Place of birth for the foreign-born population - Barbados (%)
Place of birth for the foreign-born population - Cuba (%)
Place of birth for the foreign-born population - Dominica (%)
Place of birth for the foreign-born population - Dominican Republic (%)
Place of birth for the foreign-born population - Grenada (%)
Place of birth for the foreign-born population - Haiti (%)
Place of birth for the foreign-born population - Jamaica (%)
Place of birth for the foreign-born population - St. Vincent and the Grenadines (%)
Place of birth for the foreign-born population - Trinidad and Tobago (%)
Place of birth for the foreign-born population - West Indies (%)
Place of birth for the foreign-born population - Other Caribbean (%)
Place of birth for the foreign-born population - Belize (%)
Place of birth for the foreign-born population - Costa Rica (%)
Place of birth for the foreign-born population - El Salvador (%)
Place of birth for the foreign-born population - Guatemala (%)
Place of birth for the foreign-born population - Honduras (%)
Place of birth for the foreign-born population - Mexico (%)
Place of birth for the foreign-born population - Nicaragua (%)
Place of birth for the foreign-born population - Panama (%)
Place of birth for the foreign-born population - Other Central America (%)
Place of birth for the foreign-born population - Argentina (%)
Place of birth for the foreign-born population - Bolivia (%)
Place of birth for the foreign-born population - Brazil (%)
Place of birth for the foreign-born population - Chile (%)
Place of birth for the foreign-born population - Colombia (%)
Place of birth for the foreign-born population - Ecuador (%)
Place of birth for the foreign-born population - Guyana (%)
Place of birth for the foreign-born population - Peru (%)
Place of birth for the foreign-born population - Uruguay (%)
Place of birth for the foreign-born population - Venezuela (%)
Place of birth for the foreign-born population - Other South America (%)
Place of birth for the foreign-born population - Canada (%)
Place of birth for the foreign-born population - Other Northern America (%)
Place of birth for the foreign-born population - Other (%)
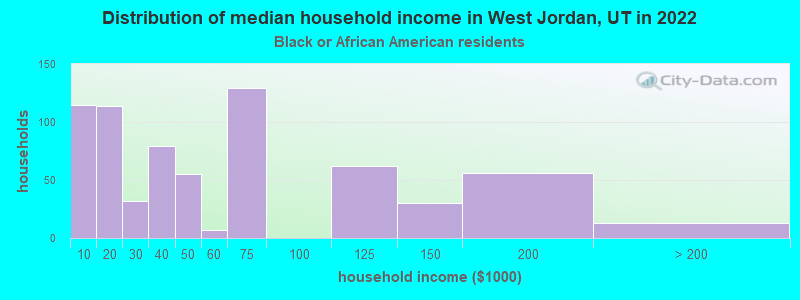
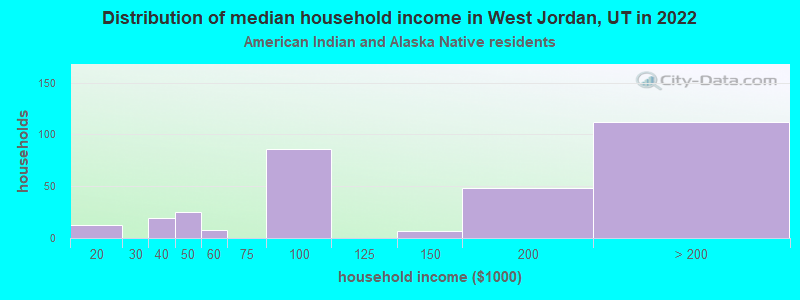
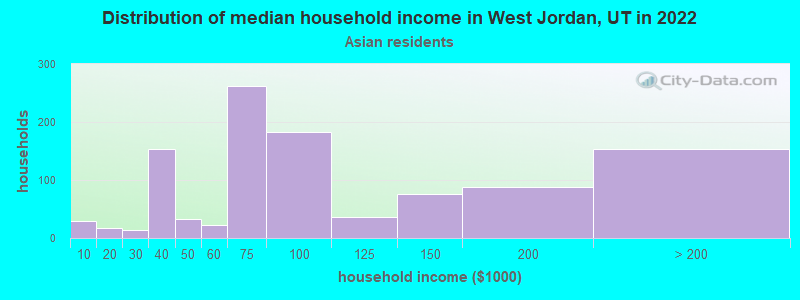
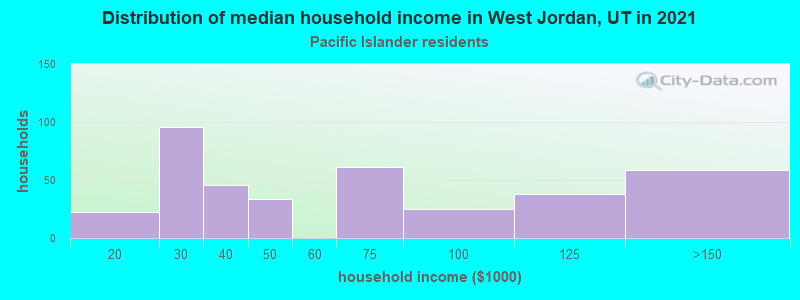
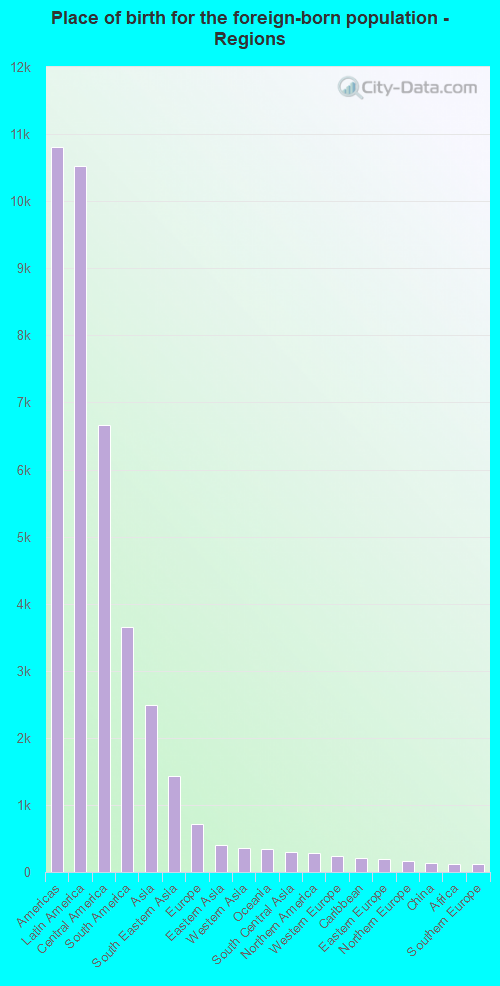
According to 2022 data, the most numerous races in West Jordan, UT are White alone (82,237 residents), Hispanic (23,803 residents), and Two or more races (2,680 residents). 80.9% of West Jordan residents speak English at home. 12.4% of West Jordan, UT residents are foreign-born (8.5% born in Latin America, 2.0% born in Asia), which is 35.3% greater than the foreign-born rate of 8.0% across the entire state of Utah.
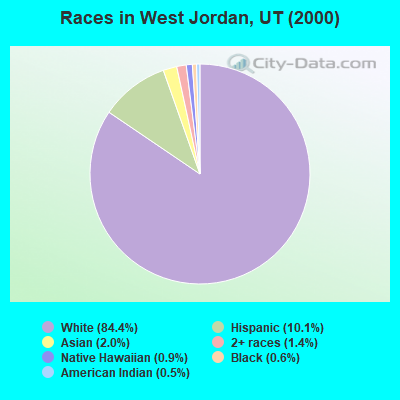
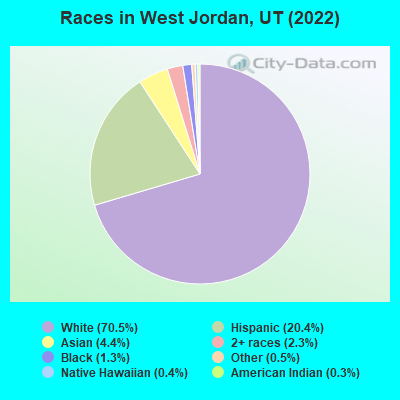
Race distribution in West Jordan
2000 2022
1,904,265 85.3% White alone 201,559 9.0% Hispanic 36,483 1.6% Asian alone 31,308 1.4% Two or more races 26,663 1.2% American Indian alone 14,806 0.7% Native Hawaiian and Other 16,137 0.7% Black alone 1,948 0.09% Other race alone
2,557,466 75.6% White alone 512,086 15.1% Hispanic 119,308 3.5% Two or more races 82,388 2.4% Asian alone 36,978 1.1% Native Hawaiian and Other 34,873 1.0% Black alone 22,803 0.7% American Indian alone 14,898 0.4% Other race alone
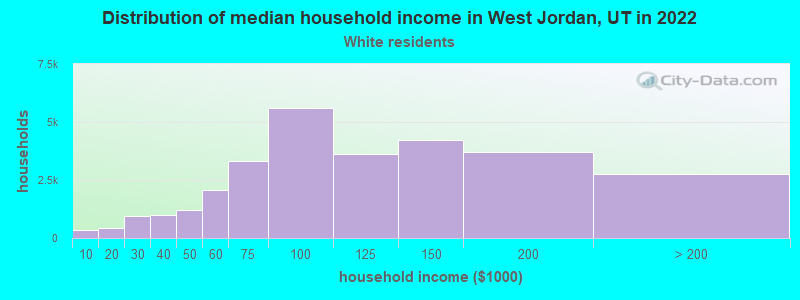
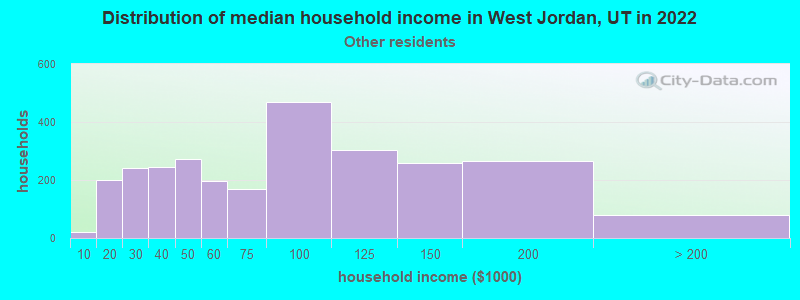
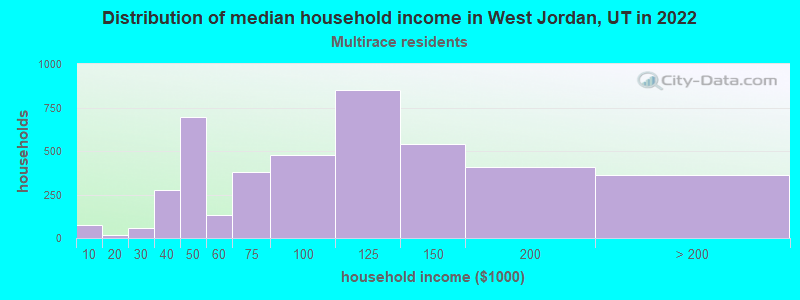
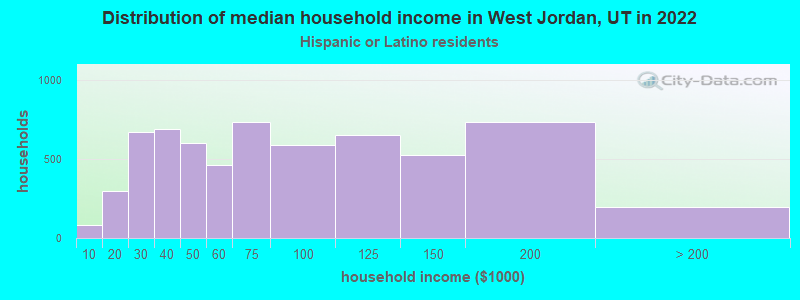
Income and house value in West Jordan Median household income in 2022 $100,477 White non-Hispanic householders$93,189 American Indian and Alaska Native householders$84,545 Asian householders$54,244 Some other race householders$100,230 Two or more races householders$70,960 Hispanic or Latino race householdersMedian 2022 house value $511,425 White Non-Hispanic householders$840,713 Black or African American householders$686,697 American Indian or Alaska Native householders $501,288 Asian householders$432,292 Native Hawaiian and other Pacific Islander householders$508,155 Some other race householders$408,094 Two or more races householders$472,840 Hispanic or Latino householders
Median age by race in West Jordan
36.1 Median age for White residents35.7 37.1 30.5 Median age for Black or African American residents21.4 33.1 58.4 Median age for American Indian / Alaska Native residents-666,666,666.0 47.5 40.8 Median age for Asian residents40.6 44.8 47.3 Median age for Native Hawaiian / Pacific Islander residents-666,666,666.0 47.7 28.3 Median age for Other race residents28.7 26.9 24.0 Median age for Two or more races residents16.4 27.9 37.0 Median age for White alone residents35.8 38.1 27.5 Median age for Hispanic or Latino residents27.9 27.0
Owner/renter occupied households by race in West Jordan
House owners and renters - White residents 24,296 83.2% Owner occupied4,890 16.8% Renter occupiedHouse owners and renters - Black or African American residents 374 45.0% Owner occupied457 55.0% Renter occupiedHouse owners and renters - American Indian / Alaska Native residents 278 77.7% Owner occupied79 22.3% Renter occupiedHouse owners and renters - Asian residents 841 80.4% Owner occupied205 19.6% Renter occupiedHouse owners and renters - Native Hawaiian / Pacific Islander residents 234 59.3% Owner occupied161 40.7% Renter occupiedHouse owners and renters - Other race residents 1,273 48.7% Owner occupied1,342 51.3% Renter occupiedHouse owners and renters - Two or more races residents 1,700 62.6% Owner occupied1,014 37.4% Renter occupiedHouse owners and renters - White alone residents 23,292 84.2% Owner occupied4,372 15.8% Renter occupiedHouse owners and renters - Hispanic or Latino residents 3,590 57.7% Owner occupied2,634 42.3% Renter occupied
Language usage in West Jordan
English speakers - Total 80.9% of residents of West Jordan speak English at home.
12.6% of residents speak Spanish at home 8,757 64.0% Speak English very well4,926 36.0% Speak English less than very well6.6% of residents speak other language at home 4,303 60.2% Speak English very well2,845 39.8% Speak English less than very well
English speakers - Born in the United States 88.0% of residents of West Jordan speak English at home.
10.4% of residents speak Spanish at home 2,576 91.7% Speak English very well232 8.3% Speak English less than very well1.5% of residents speak other language at home 260 63.6% Speak English very well149 36.4% Speak English less than very well
English speakers - Native, born elsewhere 57.5% of residents of West Jordan speak English at home.
16.0% of residents speak Spanish at home 50 100.0% Speak English very well26.5% of residents speak other language at home 83 100.0% Speak English very well
English speakers - Foreign-born 17.1% of residents of West Jordan speak English at home.
44.6% of residents speak Spanish at home 2,314 38.1% Speak English very well3,754 61.9% Speak English less than very well38.3% of residents speak other language at home 2,507 48.2% Speak English very well2,696 51.8% Speak English less than very well
White (Caucasian) - Speak only English Native:
96.2% (76,482)Foreign-born:
36.3% (714)
White (Caucasian) - Speak another language Native:
3.8% (3,024)Foreign-born:
63.7% (1,254)
Black or African American - Speak only English Native:
82.4% (884)Foreign-born:
59.4% (202)
Black or African American - Speak another language Native:
4.8% (52)Foreign-born:
50.6% (172)
American Indian / Alaska Native - Speak another language Native:
50.8% (501)Foreign-born:
94.0% (117)
Asian - Speak only English Native:
49.3% (519)Foreign-born:
13.1% (556)
Asian - Speak another language Native:
50.7% (533)Foreign-born:
86.9% (3,692)
Native Hawaiian / Pacific Islander - Speak another language Native:
27.3% (472)Foreign-born:
100.0% (334)
Other race - Speak only English Native:
13.7% (635)Foreign-born:
7.4% (388)
Other race - Speak another language Native:
86.3% (3,995)Foreign-born:
92.6% (4,875)
Two or more races - Speak only English Native:
78.5% (6,868)Foreign-born:
22.0% (324)
Two or more races - Speak another language Native:
21.5% (1,881)Foreign-born:
78.0% (1,148)
White alone - Speak only English Native:
96.7% (73,301)Foreign-born:
37.0% (679)
White alone - Speak another language Native:
3.3% (2,482)Foreign-born:
63.0% (1,156)
Hispanic or Latino - Speak only English Native:
59.2% (8,641)Foreign-born:
10.5% (700)
Hispanic or Latino - Speak another language Native:
40.8% (5,945)Foreign-born:
89.5% (5,976)
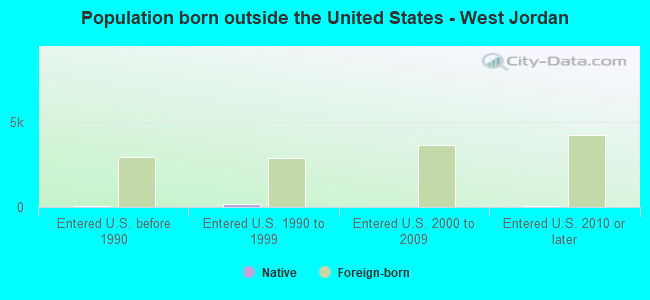
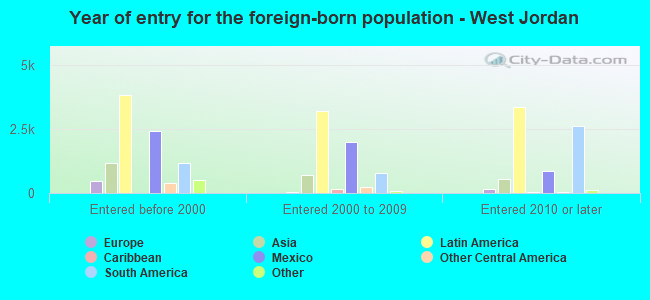
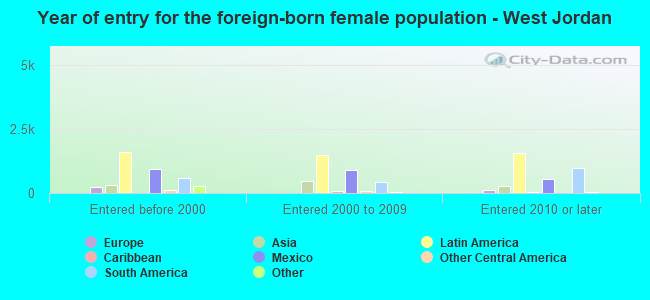
Foreign-born residents in West Jordan 14,461 residents are foreign born (8.5% Latin America , 2.0% Asia ).
Marital status for residents in West Jordan Marital status - White (Caucasian) population 15 years and over
Males 30.1% Never married57.1% Now married0.2% Separated2.2% Widowed10.4% DivorcedFemales 25.3% Never married56.6% Now married1.3% Separated5.1% Widowed11.7% DivorcedWomen who gave birth in the past 12 months Now married:
84.2% (877)Unmarried:
15.8% (165)
Women who did not give birth in the past 12 months Now married:
52.0% (11,285)Unmarried:
48.0% (10,434)
Marital status - Black or African American population 15 years and over
Males 56.2% Never married31.1% Now married1.1% Separated0.0% Widowed11.6% DivorcedFemales 44.9% Never married48.3% Now married0.0% Separated6.8% Widowed0.0% DivorcedWomen who gave birth in the past 12 months Now married:
93.3% (13)Unmarried:
6.7% (1)
Women who did not give birth in the past 12 months Now married:
60.2% (213)Unmarried:
39.8% (141)
Marital status - American Indian / Alaska Native population 15 years and over
Males 51.1% Never married39.8% Now married0.8% Separated2.8% Widowed5.6% DivorcedFemales 38.0% Never married55.5% Now married1.5% Separated5.1% Widowed0.0% DivorcedWomen who gave birth in the past 12 months Now married:
100.0% (17)Unmarried:
0.0% (0)
Women who did not give birth in the past 12 months Now married:
47.3% (71)Unmarried:
52.7% (79)
Marital status - Asian population 15 years and over
Males 38.3% Never married50.7% Now married0.9% Separated4.3% Widowed5.9% DivorcedFemales 34.6% Never married43.2% Now married2.1% Separated14.5% Widowed5.6% DivorcedWomen who gave birth in the past 12 months Now married:
100.0% (25)Unmarried:
0.0% (0)
Women who did not give birth in the past 12 months Now married:
41.6% (346)Unmarried:
58.4% (485)
Marital status - Native Hawaiian / Pacific Islander population 15 years and over
Males 42.1% Never married56.2% Now married0.0% Separated0.0% Widowed1.7% DivorcedFemales 42.0% Never married45.9% Now married7.4% Separated0.8% Widowed3.9% DivorcedWomen who gave birth in the past 12 months Now married:
0.0% (0)Unmarried:
100.0% (20)
Women who did not give birth in the past 12 months Now married:
45.8% (255)Unmarried:
54.2% (302)
Marital status - Other race population 15 years and over
Males 37.9% Never married52.1% Now married3.6% Separated0.3% Widowed6.0% DivorcedFemales 34.0% Never married47.9% Now married1.7% Separated10.2% Widowed6.1% DivorcedWomen who gave birth in the past 12 months Now married:
100.0% (361)Unmarried:
0.0% (0)
Women who did not give birth in the past 12 months Now married:
44.3% (1,219)Unmarried:
55.7% (1,533)
Marital status - Two or more races population 15 years and over
Males 41.9% Never married55.2% Now married0.4% Separated0.0% Widowed2.5% DivorcedFemales 35.4% Never married49.9% Now married5.6% Separated3.0% Widowed6.0% DivorcedWomen who gave birth in the past 12 months Now married:
100.0% (151)Unmarried:
0.0% (0)
Women who did not give birth in the past 12 months Now married:
47.1% (1,511)Unmarried:
52.9% (1,700)
Marital status - White alone, not Hispanic / Latino population 15 years and over
Males 29.3% Never married58.4% Now married0.2% Separated1.7% Widowed10.4% DivorcedFemales 24.0% Never married58.1% Now married1.2% Separated5.2% Widowed11.5% DivorcedWomen who gave birth in the past 12 months Now married:
82.7% (789)Unmarried:
17.3% (165)
Women who did not give birth in the past 12 months Now married:
53.5% (11,038)Unmarried:
46.5% (9,575)
Marital status - Hispanic or Latino population 15 years and over
Males 45.2% Never married47.2% Now married0.6% Separated2.6% Widowed4.5% DivorcedFemales 40.9% Never married42.8% Now married5.4% Separated2.0% Widowed8.9% DivorcedWomen who gave birth in the past 12 months Now married:
100.0% (569)Unmarried:
0.0% (0)
Women who did not give birth in the past 12 months Now married:
40.3% (2,510)Unmarried:
59.7% (3,713)
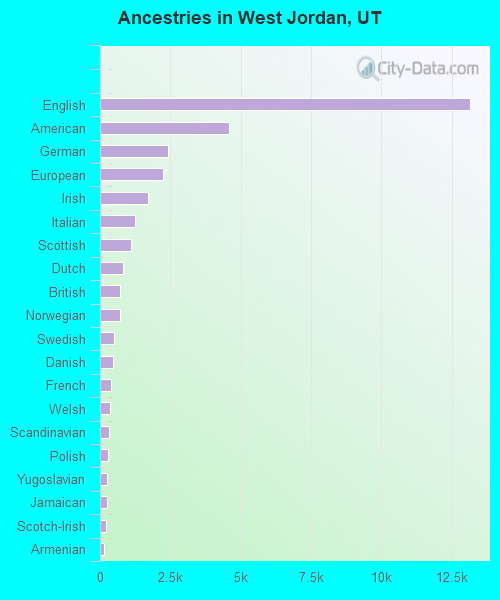
Ancestries in West Jordan
13,166 22.4% English4,586 7.8% American2,417 4.1% German2,248 3.8% European1,693 2.9% Irish1,255 2.1% Italian1,085 1.8% Scottish815 1.4% Dutch725 1.2% British718 1.2% Norwegian502 0.9% Swedish471 0.8% Danish400 0.7% French363 0.6% Welsh321 0.5% Scandinavian290 0.5% Polish239 0.4% Yugoslavian239 0.4% Jamaican202 0.3% Scotch-Irish137 0.2% Armenian113 0.2% Northern European104 0.2% Greek90 0.2% Swiss73 0.1% Belgian70 0.1% Syrian69 0.1% Brazilian64 0.1% Czech63 0.1% Slovak59 0.1% Iranian52 0.09% French Canadian49 0.08% Croatian49 0.08% Trinidadian and Tobagonian45 0.08% Latvian44 0.07% Lebanese39 0.07% Canadian35 0.06% Romanian34 0.06% Turkish34 0.06% Slavic32 0.05% Portuguese32 0.05% Russian27 0.05% African25 0.04% Ukrainian23 0.04% Iraqi21 0.04% Eastern European21 0.04% Israeli18 0.03% Egyptian17 0.03% Basque14 0.02% Hungarian12 0.02% Lithuanian9 0.02% Maltese9 0.02% Ghanaian8 0.01% Sudanese6 0.01% Australian4 0.01% Albanian
Geographical mobility in West Jordan Same house 1 year ago 76,308 89.1% White (Caucasian)1,491 97.7% Black or African American872 88.7% American Indian / Alaska Native2,679 86.0% Asian1,534 73.2% Native Hawaiian / Pacific Islander8,125 74.9% Other race12,612 83.9% Two or more races73,232 89.9% White alone, not Hispanic / Latino16,168 69.2% Hispanic or LatinoMoved within same county 6,421 7.5% White / Caucasian69 4.5% Black or African American84 8.6% American Indian / Alaska Native333 10.7% Asian388 18.5% Native Hawaiian / Pacific Islander1,777 16.4% Other race1,458 9.7% Two or more races5,369 6.6% White alone, not Hispanic / Latino4,651 19.9% Hispanic or LatinoMoved within same state 1,856 2.2% White / Caucasian5 0.3% Black or African American1 0.1% American Indian / Alaska Native8 0.3% Asian54 2.6% Native Hawaiian / Pacific Islander107 1.0% Other race398 2.7% Two or more races1,856 2.3% White alone, not Hispanic / Latino179 0.8% Hispanic or LatinoMoved from different state 763 0.9% White / Caucasian28 1.8% Black or African American81 2.6% Asian45 2.1% Native Hawaiian / Pacific Islander237 2.2% Other race283 1.9% Two or more races713 0.9% White alone, not Hispanic / Latino1,232 5.3% Hispanic or LatinoMoved from abroad 313 0.4% White410 3.8% Other race271 1.8% Two or more races313 0.4% White alone, not Hispanic / Latino1,142 4.9% Hispanic or Latino
Children Nativity (place of birth) in West Jordan
Children under 6 years - Living with two parents Both parents native 4,937 99.8% Native9 0.2% Foreign-bornBoth parents foreign-born 449 96.5% Native16 3.5% Foreign-bornOne native, one foreign-born parent 804 100.0% NativeChildren under 6 years - Living with one parent Native parent 1,353 100.0% NativeForeign-born parent 431 100.0% NativeChildren 6 to 17 years - Living with two parents Both parents native 13,993 100.0% NativeBoth parents foreign-born 2,252 82.6% Native475 17.4% Foreign-bornOne native, one foreign-born parent 1,617 100.0% NativeChildren 6 to 17 years - Living with one parent Native parent 3,964 100.0% NativeForeign-born parent 802 53.9% Native685 46.1% Foreign-born
Grandparents responsible for own grandchildren in West Jordan
Grandparents (30 to 59 years) White / Caucasian 258 25.4% Responsible for grandchildren756 74.6% Not responsible for grandchildrenBlack or African American 2 100.0% Responsible for grandchildrenAsian 8 100.0% Not responsible for grandchildrenNative Hawaiian / Pacific Islander 33 100.0% Not responsible for grandchildrenOther race 173 100.0% Not responsible for grandchildrenTwo or more races 45 100.0% Not responsible for grandchildrenWhite alone, not Hispanic / Latino 258 25.4% Responsible for grandchildren756 74.6% Not responsible for grandchildrenHispanic or Latino 304 100.0% Not responsible for grandchildrenGrandparents (60 years and over) White / Caucasian 737 32.1% Responsible for grandchildren1,558 67.9% Not responsible for grandchildrenBlack or African American 33 100.0% Responsible for grandchildrenAsian 7 13.0% Responsible for grandchildren46 87.0% Not responsible for grandchildrenNative Hawaiian / Pacific Islander 10 100.0% Not responsible for grandchildrenOther race 238 100.0% Not responsible for grandchildrenTwo or more races 345 100.0% Not responsible for grandchildrenWhite alone, not Hispanic / Latino 737 32.8% Responsible for grandchildren1,509 67.2% Not responsible for grandchildrenHispanic or Latino 436 100.0% Not responsible for grandchildren