Races in West Haven, Connecticut (CT) Detailed Stats
Data:
Races - White alone (%)
Races - White alone (% change since 2000)
Races - Black alone (%)
Races - Black alone (% change since 2000)
Races - American Indian alone (%)
Races - American Indian alone (% change since 2000)
Races - Asian alone (%)
Races - Asian alone (% change since 2000)
Races - Hispanic (%)
Races - Hispanic (% change since 2000)
Races - Native Hawaiian and Other Pacific Islander alone (%)
Races - Native Hawaiian and Other Pacific Islander alone (% change since 2000)
Races - Two or more races(%)
Races - Two or more races(% change since 2000)
Races - Other race alone (%)
Races - Other race alone (% change since 2000)
Racial diversity
Place of birth - Born in state of residence (%)
Place of birth - Born in state of residence (%) - White
Place of birth - Born in state of residence (%) - Black or African American
Place of birth - Born in state of residence (%) - Asian
Place of birth - Born in state of residence (%) - Hispanic or Latino
Place of birth - Born in state of residence (%) - American Indian and Alaska Native
Place of birth - Born in state of residence (%) - Multirace
Place of birth - Born in state of residence (%) - Other Race
Place of birth - Born in other state (%)
Place of birth - Born in other state (%) - White
Place of birth - Born in other state (%) - Black or African American
Place of birth - Born in other state (%) - Asian
Place of birth - Born in other state (%) - Hispanic or Latino
Place of birth - Born in other state (%) - American Indian and Alaska Native
Place of birth - Born in other state (%) - Multirace
Place of birth - Born in other state (%) - Other Race
Place of birth - Native, outside of US (%)
Place of birth - Native, outside of US (%) - White
Place of birth - Native, outside of US (%) - Black or African American
Place of birth - Native, outside of US (%) - Asian
Place of birth - Native, outside of US (%) - Hispanic or Latino
Place of birth - Native, outside of US (%) - American Indian and Alaska Native
Place of birth - Native, outside of US (%) - Multirace
Place of birth - Native, outside of US (%) - Other Race
Place of birth - Foreign born (%)
Place of birth - Foreign born (%) - White
Place of birth - Foreign born (%) - Black or African American
Place of birth - Foreign born (%) - Asian
Place of birth - Foreign born (%) - Hispanic or Latino
Place of birth - Foreign born (%) - American Indian and Alaska Native
Place of birth - Foreign born (%) - Multirace
Place of birth - Foreign born (%) - Other Race
Residents speaking English at home (%)
Residents speaking English at home - Born in the United States (%)
Residents speaking English at home - Native, born elsewhere (%)
Residents speaking English at home - Foreign born (%)
Residents speaking Spanish at home (%)
Residents speaking Spanish at home - Born in the United States (%)
Residents speaking Spanish at home - Native, born elsewhere (%)
Residents speaking Spanish at home - Foreign born (%)
Residents speaking other language at home (%)
Residents speaking other language at home - Born in the United States (%)
Residents speaking other language at home - Native, born elsewhere (%)
Residents speaking other language at home - Foreign born (%)
Marital status - Never married (%)
Marital status - Now married (%)
Marital status - Separated (%)
Marital status - Widowed (%)
Marital status - Divorced (%)
Ancestries Reported - Arab (%)
Ancestries Reported - Czech (%)
Ancestries Reported - Danish (%)
Ancestries Reported - Dutch (%)
Ancestries Reported - English (%)
Ancestries Reported - French (%)
Ancestries Reported - French Canadian (%)
Ancestries Reported - German (%)
Ancestries Reported - Greek (%)
Ancestries Reported - Hungarian (%)
Ancestries Reported - Irish (%)
Ancestries Reported - Italian (%)
Ancestries Reported - Lithuanian (%)
Ancestries Reported - Norwegian (%)
Ancestries Reported - Polish (%)
Ancestries Reported - Portuguese (%)
Ancestries Reported - Russian (%)
Ancestries Reported - Scotch-Irish (%)
Ancestries Reported - Scottish (%)
Ancestries Reported - Slovak (%)
Ancestries Reported - Subsaharan African (%)
Ancestries Reported - Swedish (%)
Ancestries Reported - Swiss (%)
Ancestries Reported - Ukrainian (%)
Ancestries Reported - United States (%)
Ancestries Reported - Welsh (%)
Ancestries Reported - West Indian (%)
Ancestries Reported - Other (%)
Geographical mobility - Same house 1 year ago (%)
Geographical mobility - Same house 1 year ago (%) - White
Geographical mobility - Same house 1 year ago (%) - Black or African American
Geographical mobility - Same house 1 year ago (%) - Asian
Geographical mobility - Same house 1 year ago (%) - Hispanic or Latino
Geographical mobility - Same house 1 year ago (%) - American Indian and Alaska Native
Geographical mobility - Same house 1 year ago (%) - Multirace
Geographical mobility - Same house 1 year ago (%) - Other Race
Geographical mobility - Moved within same county (%)
Geographical mobility - Moved within same county (%) - White
Geographical mobility - Moved within same county (%) - Black or African American
Geographical mobility - Moved within same county (%) - Asian
Geographical mobility - Moved within same county (%) - Hispanic or Latino
Geographical mobility - Moved within same county (%) - American Indian and Alaska Native
Geographical mobility - Moved within same county (%) - Multirace
Geographical mobility - Moved within same county (%) - Other Race
Geographical mobility - Moved from different county within same state (%)
Geographical mobility - Moved from different county within same state (%) - White
Geographical mobility - Moved from different county within same state (%) - Black or African American
Geographical mobility - Moved from different county within same state (%) - Asian
Geographical mobility - Moved from different county within same state (%) - Hispanic or Latino
Geographical mobility - Moved from different county within same state (%) - American Indian and Alaska Native
Geographical mobility - Moved from different county within same state (%) - Multirace
Geographical mobility - Moved from different county within same state (%) - Other Race
Geographical mobility - Moved from different state (%)
Geographical mobility - Moved from different state (%) - White
Geographical mobility - Moved from different state (%) - Black or African American
Geographical mobility - Moved from different state (%) - Asian
Geographical mobility - Moved from different state (%) - Hispanic or Latino
Geographical mobility - Moved from different state (%) - American Indian and Alaska Native
Geographical mobility - Moved from different state (%) - Multirace
Geographical mobility - Moved from different state (%) - Other Race
Geographical mobility - Moved from abroad (%)
Geographical mobility - Moved from abroad (%) - White
Geographical mobility - Moved from abroad (%) - Black or African American
Geographical mobility - Moved from abroad (%) - Asian
Geographical mobility - Moved from abroad (%) - Hispanic or Latino
Geographical mobility - Moved from abroad (%) - American Indian and Alaska Native
Geographical mobility - Moved from abroad (%) - Multirace
Geographical mobility - Moved from abroad (%) - Other Race
Place of birth for the foreign-born population - Ireland (%)
Place of birth for the foreign-born population - Denmark (%)
Place of birth for the foreign-born population - Norway (%)
Place of birth for the foreign-born population - Sweden (%)
Place of birth for the foreign-born population - United Kingdom (%)
Place of birth for the foreign-born population - England (%)
Place of birth for the foreign-born population - Scotland (%)
Place of birth for the foreign-born population - Other Northern Europe (%)
Place of birth for the foreign-born population - Austria (%)
Place of birth for the foreign-born population - Belgium (%)
Place of birth for the foreign-born population - France (%)
Place of birth for the foreign-born population - Germany (%)
Place of birth for the foreign-born population - Netherlands (%)
Place of birth for the foreign-born population - Switzerland (%)
Place of birth for the foreign-born population - Other Western Europe (%)
Place of birth for the foreign-born population - Greece (%)
Place of birth for the foreign-born population - Italy (%)
Place of birth for the foreign-born population - Portugal (%)
Place of birth for the foreign-born population - Spain (%)
Place of birth for the foreign-born population - Other Southern Europe (%)
Place of birth for the foreign-born population - Albania (%)
Place of birth for the foreign-born population - Belarus (%)
Place of birth for the foreign-born population - Bosnia and Herzegovina (%)
Place of birth for the foreign-born population - Bulgaria (%)
Place of birth for the foreign-born population - Croatia (%)
Place of birth for the foreign-born population - Czechoslovakia (%)
Place of birth for the foreign-born population - Hungary (%)
Place of birth for the foreign-born population - Latvia (%)
Place of birth for the foreign-born population - Lithuania (%)
Place of birth for the foreign-born population - North Macedonia (Macedonia) (%)
Place of birth for the foreign-born population - Moldova (%)
Place of birth for the foreign-born population - Poland (%)
Place of birth for the foreign-born population - Romania (%)
Place of birth for the foreign-born population - Russia (%)
Place of birth for the foreign-born population - Serbia (%)
Place of birth for the foreign-born population - Ukraine (%)
Place of birth for the foreign-born population - Other Eastern Europe (%)
Place of birth for the foreign-born population - China (%)
Place of birth for the foreign-born population - Hong Kong (%)
Place of birth for the foreign-born population - Taiwan (%)
Place of birth for the foreign-born population - Japan (%)
Place of birth for the foreign-born population - Korea (%)
Place of birth for the foreign-born population - Other Eastern Asia (%)
Place of birth for the foreign-born population - Afghanistan (%)
Place of birth for the foreign-born population - Bangladesh (%)
Place of birth for the foreign-born population - India (%)
Place of birth for the foreign-born population - Iran (%)
Place of birth for the foreign-born population - Kazakhstan (%)
Place of birth for the foreign-born population - Nepal (%)
Place of birth for the foreign-born population - Pakistan (%)
Place of birth for the foreign-born population - Sri Lanka (%)
Place of birth for the foreign-born population - Uzbekistan (%)
Place of birth for the foreign-born population - Other South Central Asia (%)
Place of birth for the foreign-born population - Burma (%)
Place of birth for the foreign-born population - Cambodia (%)
Place of birth for the foreign-born population - Indonesia (%)
Place of birth for the foreign-born population - Laos (%)
Place of birth for the foreign-born population - Malaysia (%)
Place of birth for the foreign-born population - Philippines (%)
Place of birth for the foreign-born population - Singapore (%)
Place of birth for the foreign-born population - Thailand (%)
Place of birth for the foreign-born population - Vietnam (%)
Place of birth for the foreign-born population - Other South Eastern Asia (%)
Place of birth for the foreign-born population - Armenia (%)
Place of birth for the foreign-born population - Iraq (%)
Place of birth for the foreign-born population - Israel (%)
Place of birth for the foreign-born population - Jordan (%)
Place of birth for the foreign-born population - Kuwait (%)
Place of birth for the foreign-born population - Lebanon (%)
Place of birth for the foreign-born population - Saudi Arabia (%)
Place of birth for the foreign-born population - Syria (%)
Place of birth for the foreign-born population - Turkey (%)
Place of birth for the foreign-born population - Yemen (%)
Place of birth for the foreign-born population - Other Western Asia (%)
Place of birth for the foreign-born population - Eritrea (%)
Place of birth for the foreign-born population - Ethiopia (%)
Place of birth for the foreign-born population - Kenya (%)
Place of birth for the foreign-born population - Somalia (%)
Place of birth for the foreign-born population - Uganda (%)
Place of birth for the foreign-born population - Zimbabwe (%)
Place of birth for the foreign-born population - Other Eastern Africa (%)
Place of birth for the foreign-born population - Cameroon (%)
Place of birth for the foreign-born population - Congo (%)
Place of birth for the foreign-born population - Democratic Republic of Congo (Zaire) (%)
Place of birth for the foreign-born population - Other Middle Africa (%)
Place of birth for the foreign-born population - Egypt (%)
Place of birth for the foreign-born population - Morocco (%)
Place of birth for the foreign-born population - Sudan (%)
Place of birth for the foreign-born population - Other Northern Africa (%)
Place of birth for the foreign-born population - South Africa (%)
Place of birth for the foreign-born population - Other Southern Africa (%)
Place of birth for the foreign-born population - Cabo Verde (%)
Place of birth for the foreign-born population - Ghana (%)
Place of birth for the foreign-born population - Liberia (%)
Place of birth for the foreign-born population - Nigeria (%)
Place of birth for the foreign-born population - Senegal (%)
Place of birth for the foreign-born population - Sierra Leone (%)
Place of birth for the foreign-born population - Other Western Africa (%)
Place of birth for the foreign-born population - Australia (%)
Place of birth for the foreign-born population - New Zealand (%)
Place of birth for the foreign-born population - Fiji (%)
Place of birth for the foreign-born population - Micronesia (%)
Place of birth for the foreign-born population - Bahamas (%)
Place of birth for the foreign-born population - Barbados (%)
Place of birth for the foreign-born population - Cuba (%)
Place of birth for the foreign-born population - Dominica (%)
Place of birth for the foreign-born population - Dominican Republic (%)
Place of birth for the foreign-born population - Grenada (%)
Place of birth for the foreign-born population - Haiti (%)
Place of birth for the foreign-born population - Jamaica (%)
Place of birth for the foreign-born population - St. Vincent and the Grenadines (%)
Place of birth for the foreign-born population - Trinidad and Tobago (%)
Place of birth for the foreign-born population - West Indies (%)
Place of birth for the foreign-born population - Other Caribbean (%)
Place of birth for the foreign-born population - Belize (%)
Place of birth for the foreign-born population - Costa Rica (%)
Place of birth for the foreign-born population - El Salvador (%)
Place of birth for the foreign-born population - Guatemala (%)
Place of birth for the foreign-born population - Honduras (%)
Place of birth for the foreign-born population - Mexico (%)
Place of birth for the foreign-born population - Nicaragua (%)
Place of birth for the foreign-born population - Panama (%)
Place of birth for the foreign-born population - Other Central America (%)
Place of birth for the foreign-born population - Argentina (%)
Place of birth for the foreign-born population - Bolivia (%)
Place of birth for the foreign-born population - Brazil (%)
Place of birth for the foreign-born population - Chile (%)
Place of birth for the foreign-born population - Colombia (%)
Place of birth for the foreign-born population - Ecuador (%)
Place of birth for the foreign-born population - Guyana (%)
Place of birth for the foreign-born population - Peru (%)
Place of birth for the foreign-born population - Uruguay (%)
Place of birth for the foreign-born population - Venezuela (%)
Place of birth for the foreign-born population - Other South America (%)
Place of birth for the foreign-born population - Canada (%)
Place of birth for the foreign-born population - Other Northern America (%)
Place of birth for the foreign-born population - Other (%)
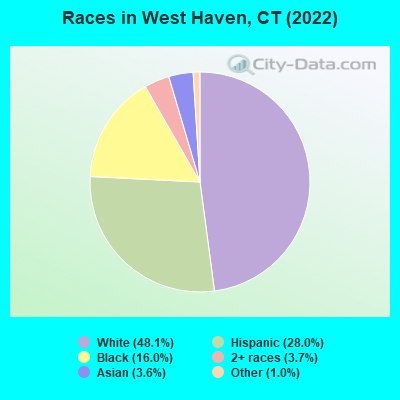
According to 2022 data, the most numerous races in West Haven, CT are White alone (26,742 residents), Hispanic (15,545 residents), and Black alone (8,893 residents). 70.0% of West Haven residents speak English at home. 19.9% of West Haven, CT residents are foreign-born (9.7% born in Latin America, 4.1% born in Asia, 3.2% born in Africa), which is 24.7% greater than the foreign-born rate of 15.0% across the entire state of Connecticut.
Race distribution in West Haven
2000 2022
36,521 69.7% White alone 8,257 15.8% Black alone 4,757 9.1% Hispanic 1,512 2.9% Asian alone 1,097 2.1% Two or more races 105 0.2% Other race alone 97 0.2% American Indian alone 14 0.03% Native Hawaiian and Other
26,742 48.1% White alone 15,545 28.0% Hispanic 8,893 16.0% Black alone 2,064 3.7% Two or more races 2,015 3.6% Asian alone 570 1.0% Other race alone 55 0.10% Native Hawaiian and Other 50 0.09% American Indian alone
2000 2022
2,638,845 77.5% White alone 320,323 9.4% Hispanic 295,571 8.7% Black alone 81,564 2.4% Asian alone 52,896 1.6% Two or more races 8,141 0.2% Other race alone 7,267 0.2% American Indian alone 958 0.03% Native Hawaiian and Other
2,246,913 62.0% White alone 658,978 18.2% Hispanic 353,973 9.8% Black alone 172,929 4.8% Asian alone 159,631 4.4% Two or more races 29,761 0.8% Other race alone 3,428 0.09% American Indian alone 592 0.02% Native Hawaiian and Other
Income and house value in West Haven Median household income in 2022 $74,434 White non-Hispanic householders$65,351 Black householders$59,934 American Indian and Alaska Native householders$75,433 Asian householders$80,882 Some other race householders$96,717 Two or more races householders$65,815 Hispanic or Latino race householdersMedian 2022 house value $272,604 White Non-Hispanic householders$244,435 Black or African American householders$172,876 American Indian or Alaska Native householders $322,355 Asian householders$795,097 Native Hawaiian and other Pacific Islander householders$268,288 Some other race householders$295,549 Two or more races householders$258,974 Hispanic or Latino householders
Median age by race in West Haven
43.5 Median age for White residents43.6 43.7 35.4 Median age for Black or African American residents34.9 37.9 22.5 Median age for American Indian / Alaska Native residents20.4 21.8 28.5 Median age for Asian residents27.8 29.1 26.6 Median age for Native Hawaiian / Pacific Islander residents-414,239,481.8 -691,588,784.4 33.6 Median age for Other race residents32.5 35.3 24.9 Median age for Two or more races residents26.7 24.0 46.1 Median age for White alone residents45.5 46.8 27.2 Median age for Hispanic or Latino residents27.6 26.8
Owner/renter occupied households by race in West Haven
House owners and renters - White residents 7,479 62.2% Owner occupied4,554 37.8% Renter occupiedHouse owners and renters - Black or African American residents 1,648 47.6% Owner occupied1,813 52.4% Renter occupiedHouse owners and renters - American Indian / Alaska Native residents 30 35.9% Owner occupied54 64.1% Renter occupiedHouse owners and renters - Asian residents 181 28.9% Owner occupied446 71.1% Renter occupiedHouse owners and renters - Native Hawaiian / Pacific Islander residents 170 100.0% Renter occupiedHouse owners and renters - Other race residents 693 27.1% Owner occupied1,866 72.9% Renter occupiedHouse owners and renters - Two or more races residents 1,088 48.9% Owner occupied1,135 51.1% Renter occupiedHouse owners and renters - White alone residents 7,104 62.1% Owner occupied4,339 37.9% Renter occupiedHouse owners and renters - Hispanic or Latino residents 1,760 36.7% Owner occupied3,040 63.3% Renter occupied
Language usage in West Haven
English speakers - Total 70.0% of residents of West Haven speak English at home.
18.3% of residents speak Spanish at home 5,904 60.8% Speak English very well3,805 39.2% Speak English less than very well11.9% of residents speak other language at home 3,639 57.9% Speak English very well2,651 42.1% Speak English less than very well
English speakers - Born in the United States 80.6% of residents of West Haven speak English at home.
15.2% of residents speak Spanish at home 1,411 83.1% Speak English very well287 16.9% Speak English less than very well5.3% of residents speak other language at home 537 89.8% Speak English very well61 10.2% Speak English less than very well
English speakers - Native, born elsewhere 29.4% of residents of West Haven speak English at home.
66.5% of residents speak Spanish at home 910 67.5% Speak English very well438 32.5% Speak English less than very well4.6% of residents speak other language at home 94 100.0% Speak English very well
English speakers - Foreign-born 20.2% of residents of West Haven speak English at home.
36.3% of residents speak Spanish at home 1,110 27.8% Speak English very well2,888 72.2% Speak English less than very well43.3% of residents speak other language at home 2,302 48.3% Speak English very well2,468 51.7% Speak English less than very well
White (Caucasian) - Speak only English Native:
92.1% (23,356)Foreign-born:
19.4% (484)
White (Caucasian) - Speak another language Native:
7.3% (1,864)Foreign-born:
78.6% (1,960)
Black or African American - Speak only English Native:
92.1% (6,190)Foreign-born:
53.8% (1,315)
Black or African American - Speak another language Native:
7.8% (524)Foreign-born:
43.2% (1,056)
American Indian / Alaska Native - Speak another language Native:
80.0% (146)Foreign-born:
92.6% (104)
Asian - Speak only English Native:
55.2% (238)Foreign-born:
19.9% (338)
Asian - Speak another language Native:
44.9% (194)Foreign-born:
79.8% (1,355)
Other race - Speak only English Native:
38.1% (1,707)Foreign-born:
4.3% (122)
Other race - Speak another language Native:
62.3% (2,786)Foreign-born:
96.2% (2,733)
Two or more races - Speak only English Native:
64.0% (3,607)Foreign-born:
2.9% (53)
Two or more races - Speak another language Native:
35.7% (2,014)Foreign-born:
100.0% (1,833)
White alone - Speak only English Native:
95.4% (22,471)Foreign-born:
16.7% (363)
White alone - Speak another language Native:
4.6% (1,086)Foreign-born:
82.8% (1,802)
Hispanic or Latino - Speak only English Native:
46.6% (4,676)Foreign-born:
6.3% (271)
Hispanic or Latino - Speak another language Native:
53.7% (5,389)Foreign-born:
93.7% (4,051)
Foreign-born residents in West Haven 11,064 residents are foreign born (9.7% Latin America , 4.1% Asia , 3.2% Africa ).
This city:
19.9%Connecticut:
15.0%
Marital status for residents in West Haven Marital status - White (Caucasian) population 15 years and over
Males 40.4% Never married47.8% Now married0.4% Separated4.0% Widowed7.4% DivorcedFemales 36.2% Never married42.6% Now married0.8% Separated8.5% Widowed11.9% DivorcedWomen who gave birth in the past 12 months Now married:
66.2% (118)Unmarried:
33.8% (61)
Women who did not give birth in the past 12 months Now married:
32.2% (2,025)Unmarried:
67.8% (4,260)
Marital status - Black or African American population 15 years and over
Males 53.3% Never married38.5% Now married1.0% Separated2.6% Widowed4.6% DivorcedFemales 51.5% Never married28.9% Now married2.8% Separated5.4% Widowed11.4% DivorcedWomen who gave birth in the past 12 months Now married:
1.4% (1)Unmarried:
98.6% (67)
Women who did not give birth in the past 12 months Now married:
26.1% (610)Unmarried:
73.9% (1,728)
Marital status - American Indian / Alaska Native population 15 years and over
Males 83.3% Never married16.7% Now married0.0% Separated0.0% Widowed0.0% DivorcedFemales 79.3% Never married0.0% Now married0.0% Separated0.0% Widowed20.7% DivorcedWomen who did not give birth in the past 12 months Now married:
0.0% (0)Unmarried:
100.0% (73)
Marital status - Asian population 15 years and over
Males 64.8% Never married32.6% Now married0.0% Separated0.0% Widowed2.6% DivorcedFemales 51.4% Never married41.8% Now married1.0% Separated3.9% Widowed1.8% DivorcedWomen who did not give birth in the past 12 months Now married:
35.1% (293)Unmarried:
64.9% (542)
Marital status - Native Hawaiian / Pacific Islander population 15 years and over
Males 0.0% Never married0.0% Now married0.0% Separated0.0% Widowed100.0% DivorcedFemales 90.8% Never married9.2% Now married0.0% Separated0.0% Widowed0.0% DivorcedWomen who did not give birth in the past 12 months Now married:
9.2% (6)Unmarried:
90.8% (62)
Marital status - Other race population 15 years and over
Males 57.4% Never married25.1% Now married9.2% Separated0.0% Widowed8.2% DivorcedFemales 55.5% Never married29.0% Now married4.4% Separated0.0% Widowed11.1% DivorcedWomen who gave birth in the past 12 months Now married:
44.2% (23)Unmarried:
55.8% (29)
Women who did not give birth in the past 12 months Now married:
25.8% (574)Unmarried:
74.2% (1,650)
Marital status - Two or more races population 15 years and over
Males 51.0% Never married38.2% Now married1.6% Separated0.6% Widowed8.5% DivorcedFemales 46.1% Never married31.3% Now married3.9% Separated1.1% Widowed17.7% DivorcedWomen who gave birth in the past 12 months Now married:
86.5% (118)Unmarried:
13.5% (18)
Women who did not give birth in the past 12 months Now married:
31.9% (692)Unmarried:
68.1% (1,475)
Marital status - White alone, not Hispanic / Latino population 15 years and over
Males 39.9% Never married48.0% Now married0.4% Separated4.4% Widowed7.3% DivorcedFemales 35.5% Never married42.9% Now married0.9% Separated9.3% Widowed11.4% DivorcedWomen who gave birth in the past 12 months Now married:
80.4% (72)Unmarried:
19.6% (17)
Women who did not give birth in the past 12 months Now married:
32.7% (1,897)Unmarried:
67.3% (3,907)
Marital status - Hispanic or Latino population 15 years and over
Males 51.6% Never married33.2% Now married4.0% Separated0.0% Widowed11.1% DivorcedFemales 50.4% Never married33.7% Now married3.3% Separated0.4% Widowed12.2% DivorcedWomen who gave birth in the past 12 months Now married:
61.7% (139)Unmarried:
38.3% (86)
Women who did not give birth in the past 12 months Now married:
29.7% (1,214)Unmarried:
70.3% (2,872)
Ancestries in West Haven
4,490 15.8% Italian1,433 5.1% Irish947 3.3% American909 3.2% Jamaican801 2.8% Ghanaian541 1.9% English468 1.7% Polish445 1.6% German397 1.4% Portuguese338 1.2% African320 1.1% Ethiopian292 1.0% Moroccan273 1.0% Brazilian223 0.8% Cape Verdean199 0.7% Senegalese180 0.6% Afghan153 0.5% Romanian143 0.5% Palestinian142 0.5% Egyptian124 0.4% Canadian114 0.4% French103 0.4% Nigerian102 0.4% Sudanese83 0.3% European74 0.3% Ukrainian73 0.3% Guyanese69 0.2% Greek68 0.2% Eastern European67 0.2% Hungarian61 0.2% Northern European60 0.2% Russian58 0.2% French Canadian48 0.2% British38 0.1% Slovak37 0.1% Croatian37 0.1% British West Indian34 0.1% Turkish34 0.1% Dutch30 0.1% Arab26 0.09% Lebanese25 0.09% Austrian25 0.09% Finnish25 0.09% Lithuanian24 0.08% Welsh21 0.07% Serbian21 0.07% Haitian19 0.07% Norwegian18 0.06% Czechoslovakian18 0.06% Carpatho Rusyn18 0.06% Yugoslavian16 0.06% Swedish12 0.04% Scotch-Irish11 0.04% Scottish10 0.04% Australian8 0.03% Armenian8 0.03% Czech6 0.02% Syrian6 0.02% Trinidadian and Tobagonian5 0.02% Iranian5 0.02% Belgian4 0.01% Liberian3 0.01% South African2 0.01% Kenyan
Geographical mobility in West Haven Same house 1 year ago 24,902 86.1% White (Caucasian)8,142 84.9% Black or African American197 66.1% American Indian / Alaska Native1,503 70.8% Asian6,772 91.2% Other race6,783 84.7% Two or more races22,940 86.3% White alone, not Hispanic / Latino13,209 86.7% Hispanic or LatinoMoved within same county 1,669 5.8% White / Caucasian450 4.7% Black or African American66 22.1% American Indian / Alaska Native153 7.2% Asian213 92.0% Native Hawaiian / Pacific Islander294 4.0% Other race604 7.5% Two or more races1,465 5.5% White alone, not Hispanic / Latino1,159 7.6% Hispanic or LatinoMoved within same state 628 2.2% White / Caucasian375 3.9% Black or African American52 2.5% Asian8 0.1% Other race292 3.6% Two or more races536 2.0% White alone, not Hispanic / Latino263 1.7% Hispanic or LatinoMoved from different state 1,270 4.4% White / Caucasian549 5.7% Black or African American280 13.2% Asian408 5.5% Other race275 3.4% Two or more races1,224 4.6% White alone, not Hispanic / Latino465 3.0% Hispanic or LatinoMoved from abroad 373 1.3% White129 1.3% Black or African American181 8.5% Asian5 1.9% Native Hawaiian / Pacific Islander143 1.9% Other race39 0.5% Two or more races400 1.5% White alone, not Hispanic / Latino100 0.7% Hispanic or Latino
Children Nativity (place of birth) in West Haven
Children under 6 years - Living with two parents Both parents native 970 100.0% NativeBoth parents foreign-born 344 82.7% Native72 17.3% Foreign-bornOne native, one foreign-born parent 364 100.0% NativeChildren under 6 years - Living with one parent Native parent 1,053 100.0% NativeForeign-born parent 298 100.0% NativeChildren 6 to 17 years - Living with two parents Both parents native 1,586 100.0% NativeBoth parents foreign-born 1,327 73.1% Native489 26.9% Foreign-bornOne native, one foreign-born parent 726 100.0% NativeChildren 6 to 17 years - Living with one parent Native parent 2,580 100.0% NativeForeign-born parent 345 53.8% Native296 46.2% Foreign-born
Place of birth for residents in West Haven 5,690 Americas5,639 Latin America2,381 South America2,373 Asia1,879 Africa1,769 Central America1,488 Caribbean1,094 South Central Asia1,064 Europe894 Northern Africa801 Western Africa664 Eastern Asia574 Southern Europe569 China422 South Eastern Asia325 Eastern Europe146 Western Asia145 Eastern Africa99 Northern Europe64 Western Europe55 Oceania51 Northern America49 Australia and New Zealand Subregion19 Southern Africa1,162 Mexico1,012 Jamaica834 Ecuador569 Colombia555 Morocco542 India506 Ghana504 China400 Philippines396 Guatemala366 Pakistan316 Dominican Republic314 Peru299 Brazil298 Portugal228 Italy226 Venezuela191 Sudan167 El Salvador165 Senegal139 Egypt139 Ethiopia136 Afghanistan111 Togo107 Cuba97 Hungary85 Poland82 Korea70 Chile55 Taiwan51 Canada50 Guyana49 New Zealand46 Turkey42 Jordan41 Romania41 Serbia41 Greece36 Iraq34 Russia30 Costa Rica28 Haiti28 Austria27 Nepal24 Sweden24 United Kingdom23 Bangladesh21 England21 Belgium17 South Africa17 Uruguay15 Bosnia and Herzegovina15 St. Lucia13 Saudi Arabia12 Nigeria12 Japan11 Vietnam11 Panama9 Hong Kong8 Azores Islands8 Laos8 Dominica8 Lithuania7 Germany7 France7 Israel6 Spain6 Kenya6 Marshall Islands5 Liberia2 Thailand1 Honduras
Grandparents responsible for own grandchildren in West Haven
Grandparents (30 to 59 years) White / Caucasian 116 82.7% Responsible for grandchildren24 17.3% Not responsible for grandchildrenAsian 30 100.0% Not responsible for grandchildrenOther race 14 6.7% Responsible for grandchildren190 93.3% Not responsible for grandchildrenWhite alone, not Hispanic / Latino 111 77.3% Responsible for grandchildren33 22.7% Not responsible for grandchildrenHispanic or Latino 52 27.8% Responsible for grandchildren135 72.2% Not responsible for grandchildrenGrandparents (60 years and over) White / Caucasian 21 4.7% Responsible for grandchildren418 95.3% Not responsible for grandchildrenAsian 34 100.0% Not responsible for grandchildrenOther race 36 100.0% Not responsible for grandchildrenWhite alone, not Hispanic / Latino 22 4.8% Responsible for grandchildren440 95.2% Not responsible for grandchildrenHispanic or Latino 17 13.9% Responsible for grandchildren103 86.1% Not responsible for grandchildren