Races in West Freehold, New Jersey (NJ) Detailed Stats
Data:
Races - White alone (%)
Races - White alone (% change since 2000)
Races - Black alone (%)
Races - Black alone (% change since 2000)
Races - American Indian alone (%)
Races - American Indian alone (% change since 2000)
Races - Asian alone (%)
Races - Asian alone (% change since 2000)
Races - Hispanic (%)
Races - Hispanic (% change since 2000)
Races - Native Hawaiian and Other Pacific Islander alone (%)
Races - Native Hawaiian and Other Pacific Islander alone (% change since 2000)
Races - Two or more races(%)
Races - Two or more races(% change since 2000)
Races - Other race alone (%)
Races - Other race alone (% change since 2000)
Racial diversity
Place of birth - Born in state of residence (%)
Place of birth - Born in state of residence (%) - White
Place of birth - Born in state of residence (%) - Black or African American
Place of birth - Born in state of residence (%) - Asian
Place of birth - Born in state of residence (%) - Hispanic or Latino
Place of birth - Born in state of residence (%) - American Indian and Alaska Native
Place of birth - Born in state of residence (%) - Multirace
Place of birth - Born in state of residence (%) - Other Race
Place of birth - Born in other state (%)
Place of birth - Born in other state (%) - White
Place of birth - Born in other state (%) - Black or African American
Place of birth - Born in other state (%) - Asian
Place of birth - Born in other state (%) - Hispanic or Latino
Place of birth - Born in other state (%) - American Indian and Alaska Native
Place of birth - Born in other state (%) - Multirace
Place of birth - Born in other state (%) - Other Race
Place of birth - Native, outside of US (%)
Place of birth - Native, outside of US (%) - White
Place of birth - Native, outside of US (%) - Black or African American
Place of birth - Native, outside of US (%) - Asian
Place of birth - Native, outside of US (%) - Hispanic or Latino
Place of birth - Native, outside of US (%) - American Indian and Alaska Native
Place of birth - Native, outside of US (%) - Multirace
Place of birth - Native, outside of US (%) - Other Race
Place of birth - Foreign born (%)
Place of birth - Foreign born (%) - White
Place of birth - Foreign born (%) - Black or African American
Place of birth - Foreign born (%) - Asian
Place of birth - Foreign born (%) - Hispanic or Latino
Place of birth - Foreign born (%) - American Indian and Alaska Native
Place of birth - Foreign born (%) - Multirace
Place of birth - Foreign born (%) - Other Race
Residents speaking English at home (%)
Residents speaking English at home - Born in the United States (%)
Residents speaking English at home - Native, born elsewhere (%)
Residents speaking English at home - Foreign born (%)
Residents speaking Spanish at home (%)
Residents speaking Spanish at home - Born in the United States (%)
Residents speaking Spanish at home - Native, born elsewhere (%)
Residents speaking Spanish at home - Foreign born (%)
Residents speaking other language at home (%)
Residents speaking other language at home - Born in the United States (%)
Residents speaking other language at home - Native, born elsewhere (%)
Residents speaking other language at home - Foreign born (%)
Marital status - Never married (%)
Marital status - Now married (%)
Marital status - Separated (%)
Marital status - Widowed (%)
Marital status - Divorced (%)
Ancestries Reported - Arab (%)
Ancestries Reported - Czech (%)
Ancestries Reported - Danish (%)
Ancestries Reported - Dutch (%)
Ancestries Reported - English (%)
Ancestries Reported - French (%)
Ancestries Reported - French Canadian (%)
Ancestries Reported - German (%)
Ancestries Reported - Greek (%)
Ancestries Reported - Hungarian (%)
Ancestries Reported - Irish (%)
Ancestries Reported - Italian (%)
Ancestries Reported - Lithuanian (%)
Ancestries Reported - Norwegian (%)
Ancestries Reported - Polish (%)
Ancestries Reported - Portuguese (%)
Ancestries Reported - Russian (%)
Ancestries Reported - Scotch-Irish (%)
Ancestries Reported - Scottish (%)
Ancestries Reported - Slovak (%)
Ancestries Reported - Subsaharan African (%)
Ancestries Reported - Swedish (%)
Ancestries Reported - Swiss (%)
Ancestries Reported - Ukrainian (%)
Ancestries Reported - United States (%)
Ancestries Reported - Welsh (%)
Ancestries Reported - West Indian (%)
Ancestries Reported - Other (%)
Geographical mobility - Same house 1 year ago (%)
Geographical mobility - Same house 1 year ago (%) - White
Geographical mobility - Same house 1 year ago (%) - Black or African American
Geographical mobility - Same house 1 year ago (%) - Asian
Geographical mobility - Same house 1 year ago (%) - Hispanic or Latino
Geographical mobility - Same house 1 year ago (%) - American Indian and Alaska Native
Geographical mobility - Same house 1 year ago (%) - Multirace
Geographical mobility - Same house 1 year ago (%) - Other Race
Geographical mobility - Moved within same county (%)
Geographical mobility - Moved within same county (%) - White
Geographical mobility - Moved within same county (%) - Black or African American
Geographical mobility - Moved within same county (%) - Asian
Geographical mobility - Moved within same county (%) - Hispanic or Latino
Geographical mobility - Moved within same county (%) - American Indian and Alaska Native
Geographical mobility - Moved within same county (%) - Multirace
Geographical mobility - Moved within same county (%) - Other Race
Geographical mobility - Moved from different county within same state (%)
Geographical mobility - Moved from different county within same state (%) - White
Geographical mobility - Moved from different county within same state (%) - Black or African American
Geographical mobility - Moved from different county within same state (%) - Asian
Geographical mobility - Moved from different county within same state (%) - Hispanic or Latino
Geographical mobility - Moved from different county within same state (%) - American Indian and Alaska Native
Geographical mobility - Moved from different county within same state (%) - Multirace
Geographical mobility - Moved from different county within same state (%) - Other Race
Geographical mobility - Moved from different state (%)
Geographical mobility - Moved from different state (%) - White
Geographical mobility - Moved from different state (%) - Black or African American
Geographical mobility - Moved from different state (%) - Asian
Geographical mobility - Moved from different state (%) - Hispanic or Latino
Geographical mobility - Moved from different state (%) - American Indian and Alaska Native
Geographical mobility - Moved from different state (%) - Multirace
Geographical mobility - Moved from different state (%) - Other Race
Geographical mobility - Moved from abroad (%)
Geographical mobility - Moved from abroad (%) - White
Geographical mobility - Moved from abroad (%) - Black or African American
Geographical mobility - Moved from abroad (%) - Asian
Geographical mobility - Moved from abroad (%) - Hispanic or Latino
Geographical mobility - Moved from abroad (%) - American Indian and Alaska Native
Geographical mobility - Moved from abroad (%) - Multirace
Geographical mobility - Moved from abroad (%) - Other Race
Place of birth for the foreign-born population - Ireland (%)
Place of birth for the foreign-born population - Denmark (%)
Place of birth for the foreign-born population - Norway (%)
Place of birth for the foreign-born population - Sweden (%)
Place of birth for the foreign-born population - United Kingdom (%)
Place of birth for the foreign-born population - England (%)
Place of birth for the foreign-born population - Scotland (%)
Place of birth for the foreign-born population - Other Northern Europe (%)
Place of birth for the foreign-born population - Austria (%)
Place of birth for the foreign-born population - Belgium (%)
Place of birth for the foreign-born population - France (%)
Place of birth for the foreign-born population - Germany (%)
Place of birth for the foreign-born population - Netherlands (%)
Place of birth for the foreign-born population - Switzerland (%)
Place of birth for the foreign-born population - Other Western Europe (%)
Place of birth for the foreign-born population - Greece (%)
Place of birth for the foreign-born population - Italy (%)
Place of birth for the foreign-born population - Portugal (%)
Place of birth for the foreign-born population - Spain (%)
Place of birth for the foreign-born population - Other Southern Europe (%)
Place of birth for the foreign-born population - Albania (%)
Place of birth for the foreign-born population - Belarus (%)
Place of birth for the foreign-born population - Bosnia and Herzegovina (%)
Place of birth for the foreign-born population - Bulgaria (%)
Place of birth for the foreign-born population - Croatia (%)
Place of birth for the foreign-born population - Czechoslovakia (%)
Place of birth for the foreign-born population - Hungary (%)
Place of birth for the foreign-born population - Latvia (%)
Place of birth for the foreign-born population - Lithuania (%)
Place of birth for the foreign-born population - North Macedonia (Macedonia) (%)
Place of birth for the foreign-born population - Moldova (%)
Place of birth for the foreign-born population - Poland (%)
Place of birth for the foreign-born population - Romania (%)
Place of birth for the foreign-born population - Russia (%)
Place of birth for the foreign-born population - Serbia (%)
Place of birth for the foreign-born population - Ukraine (%)
Place of birth for the foreign-born population - Other Eastern Europe (%)
Place of birth for the foreign-born population - China (%)
Place of birth for the foreign-born population - Hong Kong (%)
Place of birth for the foreign-born population - Taiwan (%)
Place of birth for the foreign-born population - Japan (%)
Place of birth for the foreign-born population - Korea (%)
Place of birth for the foreign-born population - Other Eastern Asia (%)
Place of birth for the foreign-born population - Afghanistan (%)
Place of birth for the foreign-born population - Bangladesh (%)
Place of birth for the foreign-born population - India (%)
Place of birth for the foreign-born population - Iran (%)
Place of birth for the foreign-born population - Kazakhstan (%)
Place of birth for the foreign-born population - Nepal (%)
Place of birth for the foreign-born population - Pakistan (%)
Place of birth for the foreign-born population - Sri Lanka (%)
Place of birth for the foreign-born population - Uzbekistan (%)
Place of birth for the foreign-born population - Other South Central Asia (%)
Place of birth for the foreign-born population - Burma (%)
Place of birth for the foreign-born population - Cambodia (%)
Place of birth for the foreign-born population - Indonesia (%)
Place of birth for the foreign-born population - Laos (%)
Place of birth for the foreign-born population - Malaysia (%)
Place of birth for the foreign-born population - Philippines (%)
Place of birth for the foreign-born population - Singapore (%)
Place of birth for the foreign-born population - Thailand (%)
Place of birth for the foreign-born population - Vietnam (%)
Place of birth for the foreign-born population - Other South Eastern Asia (%)
Place of birth for the foreign-born population - Armenia (%)
Place of birth for the foreign-born population - Iraq (%)
Place of birth for the foreign-born population - Israel (%)
Place of birth for the foreign-born population - Jordan (%)
Place of birth for the foreign-born population - Kuwait (%)
Place of birth for the foreign-born population - Lebanon (%)
Place of birth for the foreign-born population - Saudi Arabia (%)
Place of birth for the foreign-born population - Syria (%)
Place of birth for the foreign-born population - Turkey (%)
Place of birth for the foreign-born population - Yemen (%)
Place of birth for the foreign-born population - Other Western Asia (%)
Place of birth for the foreign-born population - Eritrea (%)
Place of birth for the foreign-born population - Ethiopia (%)
Place of birth for the foreign-born population - Kenya (%)
Place of birth for the foreign-born population - Somalia (%)
Place of birth for the foreign-born population - Uganda (%)
Place of birth for the foreign-born population - Zimbabwe (%)
Place of birth for the foreign-born population - Other Eastern Africa (%)
Place of birth for the foreign-born population - Cameroon (%)
Place of birth for the foreign-born population - Congo (%)
Place of birth for the foreign-born population - Democratic Republic of Congo (Zaire) (%)
Place of birth for the foreign-born population - Other Middle Africa (%)
Place of birth for the foreign-born population - Egypt (%)
Place of birth for the foreign-born population - Morocco (%)
Place of birth for the foreign-born population - Sudan (%)
Place of birth for the foreign-born population - Other Northern Africa (%)
Place of birth for the foreign-born population - South Africa (%)
Place of birth for the foreign-born population - Other Southern Africa (%)
Place of birth for the foreign-born population - Cabo Verde (%)
Place of birth for the foreign-born population - Ghana (%)
Place of birth for the foreign-born population - Liberia (%)
Place of birth for the foreign-born population - Nigeria (%)
Place of birth for the foreign-born population - Senegal (%)
Place of birth for the foreign-born population - Sierra Leone (%)
Place of birth for the foreign-born population - Other Western Africa (%)
Place of birth for the foreign-born population - Australia (%)
Place of birth for the foreign-born population - New Zealand (%)
Place of birth for the foreign-born population - Fiji (%)
Place of birth for the foreign-born population - Micronesia (%)
Place of birth for the foreign-born population - Bahamas (%)
Place of birth for the foreign-born population - Barbados (%)
Place of birth for the foreign-born population - Cuba (%)
Place of birth for the foreign-born population - Dominica (%)
Place of birth for the foreign-born population - Dominican Republic (%)
Place of birth for the foreign-born population - Grenada (%)
Place of birth for the foreign-born population - Haiti (%)
Place of birth for the foreign-born population - Jamaica (%)
Place of birth for the foreign-born population - St. Vincent and the Grenadines (%)
Place of birth for the foreign-born population - Trinidad and Tobago (%)
Place of birth for the foreign-born population - West Indies (%)
Place of birth for the foreign-born population - Other Caribbean (%)
Place of birth for the foreign-born population - Belize (%)
Place of birth for the foreign-born population - Costa Rica (%)
Place of birth for the foreign-born population - El Salvador (%)
Place of birth for the foreign-born population - Guatemala (%)
Place of birth for the foreign-born population - Honduras (%)
Place of birth for the foreign-born population - Mexico (%)
Place of birth for the foreign-born population - Nicaragua (%)
Place of birth for the foreign-born population - Panama (%)
Place of birth for the foreign-born population - Other Central America (%)
Place of birth for the foreign-born population - Argentina (%)
Place of birth for the foreign-born population - Bolivia (%)
Place of birth for the foreign-born population - Brazil (%)
Place of birth for the foreign-born population - Chile (%)
Place of birth for the foreign-born population - Colombia (%)
Place of birth for the foreign-born population - Ecuador (%)
Place of birth for the foreign-born population - Guyana (%)
Place of birth for the foreign-born population - Peru (%)
Place of birth for the foreign-born population - Uruguay (%)
Place of birth for the foreign-born population - Venezuela (%)
Place of birth for the foreign-born population - Other South America (%)
Place of birth for the foreign-born population - Canada (%)
Place of birth for the foreign-born population - Other Northern America (%)
Place of birth for the foreign-born population - Other (%)
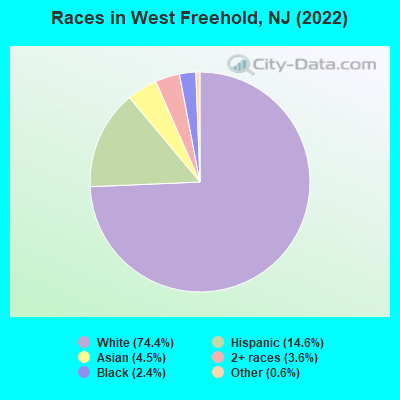
According to 2022 data, the most numerous races in West Freehold, NJ are White alone (10,764 residents), Hispanic (2,117 residents), and Black alone (343 residents). 82.5% of West Freehold residents speak English at home. 13.2% of West Freehold, NJ residents are foreign-born (4.7% born in Asia, 4.3% born in Latin America, 2.7% born in Europe), which is 74.4% less than the foreign-born rate of 23.0% across the entire state of New Jersey.
Race distribution in West Freehold
2000 2022
5,557,209 66.0% White alone 1,117,191 13.3% Hispanic 1,096,171 13.0% Black alone 477,012 5.7% Asian alone 133,689 1.6% Two or more races 19,565 0.2% Other race alone 11,338 0.1% American Indian alone 2,175 0.03% Native Hawaiian and Other
4,766,476 51.5% White alone 2,028,470 21.9% Hispanic 1,111,632 12.0% Black alone 923,546 10.0% Asian alone 332,237 3.6% Two or more races 89,847 1.0% Other race alone 8,557 0.09% American Indian alone 934 0.01% Native Hawaiian and Other
Income and house value in West Freehold Median household income in 2022 $121,381 White non-Hispanic householders$23,732 Black householdersover $200,000 Two or more races householders$198,250 Hispanic or Latino race householdersMedian 2022 house value $571,686 White Non-Hispanic householders$443,977 Black or African American householders $611,383 Asian householders$293,808 Some other race householders$662,310 Two or more races householders$572,992 Hispanic or Latino householders
Median age by race in West Freehold
42.2 Median age for White residents42.4 42.0 58.8 Median age for Black or African American residents54.7 67.3 -501,872,658.7 Median age for American Indian / Alaska Native residents-594,464,500.0 -447,596,532.3 51.1 Median age for Asian residents43.8 52.5 -804,177,544.9 Median age for Native Hawaiian / Pacific Islander residents-860,335,194.7 -713,070,378.3 32.9 Median age for Other race residents31.2 37.4 24.6 Median age for Two or more races residents41.5 13.9 42.4 Median age for White alone residents43.3 42.1 24.5 Median age for Hispanic or Latino residents28.4 23.0
Owner/renter occupied households by race in West Freehold
House owners and renters - White residents 4,124 88.2% Owner occupied552 11.8% Renter occupiedHouse owners and renters - Black or African American residents 143 87.9% Owner occupied20 12.1% Renter occupiedHouse owners and renters - Asian residents 250 83.0% Owner occupied51 17.0% Renter occupiedHouse owners and renters - Other race residents 76 100.0% Renter occupiedHouse owners and renters - Two or more races residents 425 95.8% Owner occupied19 4.2% Renter occupiedHouse owners and renters - White alone residents 4,065 90.1% Owner occupied445 9.9% Renter occupiedHouse owners and renters - Hispanic or Latino residents 375 66.2% Owner occupied192 33.8% Renter occupied
Language usage in West Freehold
English speakers - Total 82.5% of residents of West Freehold speak English at home.
5.6% of residents speak Spanish at home 493 61.9% Speak English very well303 38.1% Speak English less than very well11.9% of residents speak other language at home 1,022 61.1% Speak English very well652 38.9% Speak English less than very well
English speakers - Born in the United States 93.1% of residents of West Freehold speak English at home.
3.8% of residents speak Spanish at home 108 53.2% Speak English very well95 46.8% Speak English less than very well2.6% of residents speak other language at home 102 74.5% Speak English very well35 25.5% Speak English less than very well
English speakers - Native, born elsewhere 83.5% of residents of West Freehold speak English at home.
12.3% of residents speak Spanish at home 38 100.0% Speak English very well5.2% of residents speak other language at home 16 100.0% Speak English less than very well
English speakers - Foreign-born 10.8% of residents of West Freehold speak English at home.
21.5% of residents speak Spanish at home 195 47.3% Speak English very well217 52.7% Speak English less than very well69.8% of residents speak other language at home 752 56.3% Speak English very well584 43.7% Speak English less than very well
White (Caucasian) - Speak only English Native:
96.8% (9,746)Foreign-born:
7.8% (84)
White (Caucasian) - Speak another language Native:
3.4% (343)Foreign-born:
93.1% (1,009)
Black or African American - Speak only English Native:
89.6% (251)Foreign-born:
100.0% (65)
Asian - Speak only English Native:
43.9% (86)Foreign-born:
8.3% (39)
Asian - Speak another language Native:
58.1% (114)Foreign-born:
92.6% (437)
Other race - Speak another language Native:
53.4% (93)Foreign-born:
96.1% (117)
Two or more races - Speak another language Native:
6.6% (108)Foreign-born:
100.0% (25)
White alone - Speak only English Native:
97.7% (9,493)Foreign-born:
8.3% (72)
White alone - Speak another language Native:
2.4% (233)Foreign-born:
97.4% (843)
Hispanic or Latino - Speak only English Native:
82.9% (1,235)Foreign-born:
5.0% (23)
Hispanic or Latino - Speak another language Native:
20.6% (307)Foreign-born:
92.7% (425)
Foreign-born residents in West Freehold 1,908 residents are foreign born (4.7% Asia , 4.3% Latin America , 2.7% Europe ).
This city:
13.2%New Jersey:
23.2%
Marital status for residents in West Freehold Marital status - White (Caucasian) population 15 years and over
Males 28.0% Never married60.9% Now married0.9% Separated2.5% Widowed7.6% DivorcedFemales 23.8% Never married56.6% Now married0.4% Separated12.9% Widowed6.3% DivorcedWomen who gave birth in the past 12 months Now married:
100.0% (21)Unmarried:
0.0% (0)
Women who did not give birth in the past 12 months Now married:
57.1% (1,375)Unmarried:
42.9% (1,033)
Marital status - Black or African American population 15 years and over
Males 69.3% Never married20.3% Now married0.0% Separated0.0% Widowed10.3% DivorcedFemales 22.6% Never married36.5% Now married0.0% Separated24.8% Widowed16.1% DivorcedWomen who did not give birth in the past 12 months Now married:
0.0% (0)Unmarried:
100.0% (25)
Marital status - Asian population 15 years and over
Males 21.5% Never married76.1% Now married0.0% Separated2.4% Widowed0.0% DivorcedFemales 25.9% Never married47.0% Now married0.0% Separated3.0% Widowed24.1% DivorcedWomen who did not give birth in the past 12 months Now married:
31.9% (45)Unmarried:
68.1% (97)
Marital status - Other race population 15 years and over
Males 53.8% Never married46.2% Now married0.0% Separated0.0% Widowed0.0% DivorcedFemales 57.4% Never married37.7% Now married0.0% Separated4.9% Widowed0.0% DivorcedWomen who gave birth in the past 12 months Now married:
0.0% (0)Unmarried:
100.0% (36)
Women who did not give birth in the past 12 months Now married:
45.3% (61)Unmarried:
54.7% (74)
Marital status - Two or more races population 15 years and over
Males 14.8% Never married80.0% Now married0.0% Separated0.0% Widowed5.2% DivorcedFemales 25.3% Never married59.2% Now married0.0% Separated0.0% Widowed15.5% DivorcedWomen who did not give birth in the past 12 months Now married:
63.0% (189)Unmarried:
37.0% (111)
Marital status - White alone, not Hispanic / Latino population 15 years and over
Males 28.5% Never married59.6% Now married1.0% Separated2.7% Widowed8.2% DivorcedFemales 23.8% Never married55.4% Now married0.4% Separated13.9% Widowed6.5% DivorcedWomen who did not give birth in the past 12 months Now married:
57.3% (1,333)Unmarried:
42.7% (991)
Marital status - Hispanic or Latino population 15 years and over
Males 20.8% Never married79.2% Now married0.0% Separated0.0% Widowed0.0% DivorcedFemales 32.2% Never married57.7% Now married0.0% Separated1.1% Widowed9.0% DivorcedWomen who gave birth in the past 12 months Now married:
48.9% (23)Unmarried:
51.1% (24)
Women who did not give birth in the past 12 months Now married:
47.5% (157)Unmarried:
52.5% (174)
Ancestries in West Freehold
1,373 22.0% Italian710 11.4% American679 10.9% Irish326 5.2% Russian262 4.2% English187 3.0% Turkish181 2.9% European172 2.7% Polish141 2.3% Moroccan141 2.3% Eastern European116 1.9% Jamaican101 1.6% German69 1.1% Brazilian46 0.7% Egyptian41 0.7% Scotch-Irish38 0.6% Ukrainian26 0.4% Iraqi23 0.4% Norwegian21 0.3% Portuguese21 0.3% Trinidadian and Tobagonian18 0.3% Czechoslovakian17 0.3% Slovak12 0.2% Hungarian11 0.2% Syrian11 0.2% Scottish9 0.1% French Canadian3 0.05% British
Children Nativity (place of birth) in West Freehold
Children under 6 years - Living with two parents Both parents native 373 100.0% NativeBoth parents foreign-born 152 100.0% NativeOne native, one foreign-born parent 12 100.0% NativeChildren under 6 years - Living with one parent Native parent 44 100.0% NativeChildren 6 to 17 years - Living with two parents Both parents native 1,765 100.0% NativeBoth parents foreign-born 358 83.7% Native70 16.3% Foreign-bornOne native, one foreign-born parent 180 95.6% Native8 4.4% Foreign-bornChildren 6 to 17 years - Living with one parent Native parent 367 100.0% NativeForeign-born parent 20 48.9% Native21 51.1% Foreign-born
Grandparents responsible for own grandchildren in West Freehold
Grandparents (30 to 59 years) White / Caucasian 6 100.0% Not responsible for grandchildrenHispanic or Latino 9 100.0% Not responsible for grandchildrenGrandparents (60 years and over) White / Caucasian 20 14.5% Responsible for grandchildren119 85.5% Not responsible for grandchildren