Races in Wesley Chapel, Florida (FL) Detailed Stats
Data:
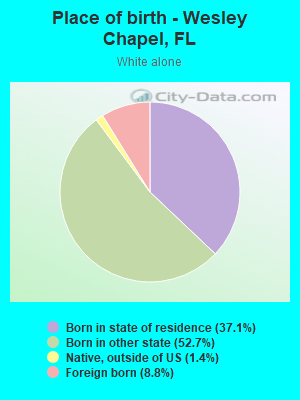
Races - White alone (%)
Races - White alone (% change since 2000)
Races - Black alone (%)
Races - Black alone (% change since 2000)
Races - American Indian alone (%)
Races - American Indian alone (% change since 2000)
Races - Asian alone (%)
Races - Asian alone (% change since 2000)
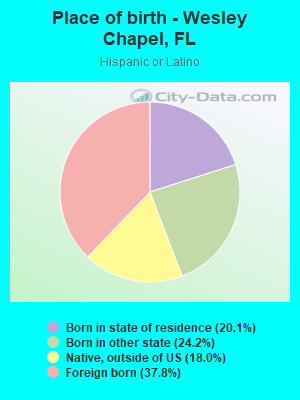
Races - Hispanic (%)
Races - Hispanic (% change since 2000)
Races - Native Hawaiian and Other Pacific Islander alone (%)
Races - Native Hawaiian and Other Pacific Islander alone (% change since 2000)
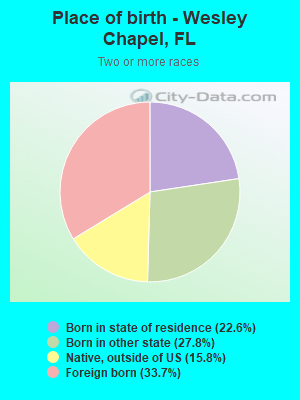
Races - Two or more races(%)
Races - Two or more races(% change since 2000)
Races - Other race alone (%)
Races - Other race alone (% change since 2000)
Racial diversity
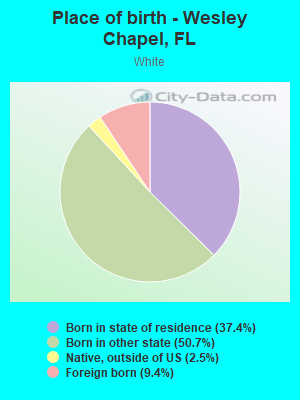
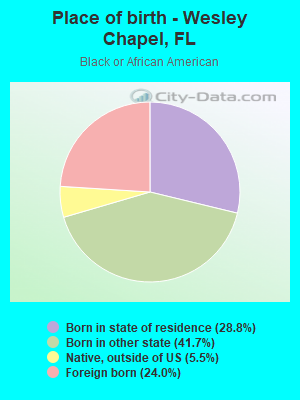
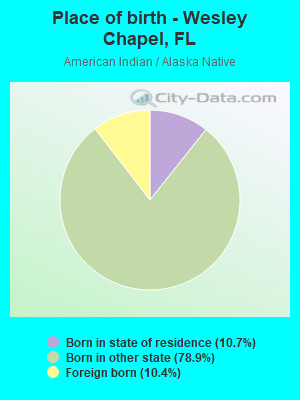
Place of birth - Born in state of residence (%)
Place of birth - Born in state of residence (%) - White
Place of birth - Born in state of residence (%) - Black or African American
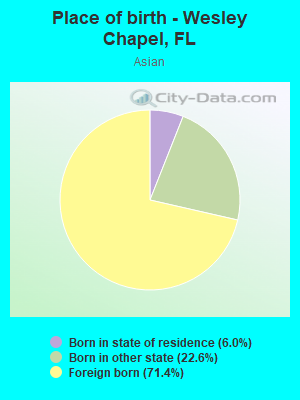
Place of birth - Born in state of residence (%) - Asian
Place of birth - Born in state of residence (%) - Hispanic or Latino
Place of birth - Born in state of residence (%) - American Indian and Alaska Native
Place of birth - Born in state of residence (%) - Multirace
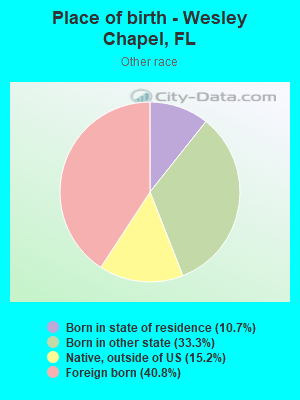
Place of birth - Born in state of residence (%) - Other Race
Place of birth - Born in other state (%)
Place of birth - Born in other state (%) - White
Place of birth - Born in other state (%) - Black or African American
Place of birth - Born in other state (%) - Asian
Place of birth - Born in other state (%) - Hispanic or Latino
Place of birth - Born in other state (%) - American Indian and Alaska Native
Place of birth - Born in other state (%) - Multirace
Place of birth - Born in other state (%) - Other Race
Place of birth - Native, outside of US (%)
Place of birth - Native, outside of US (%) - White
Place of birth - Native, outside of US (%) - Black or African American
Place of birth - Native, outside of US (%) - Asian
Place of birth - Native, outside of US (%) - Hispanic or Latino
Place of birth - Native, outside of US (%) - American Indian and Alaska Native
Place of birth - Native, outside of US (%) - Multirace
Place of birth - Native, outside of US (%) - Other Race
Place of birth - Foreign born (%)
Place of birth - Foreign born (%) - White
Place of birth - Foreign born (%) - Black or African American
Place of birth - Foreign born (%) - Asian
Place of birth - Foreign born (%) - Hispanic or Latino
Place of birth - Foreign born (%) - American Indian and Alaska Native
Place of birth - Foreign born (%) - Multirace
Place of birth - Foreign born (%) - Other Race
Residents speaking English at home (%)
Residents speaking English at home - Born in the United States (%)
Residents speaking English at home - Native, born elsewhere (%)
Residents speaking English at home - Foreign born (%)
Residents speaking Spanish at home (%)
Residents speaking Spanish at home - Born in the United States (%)
Residents speaking Spanish at home - Native, born elsewhere (%)
Residents speaking Spanish at home - Foreign born (%)
Residents speaking other language at home (%)
Residents speaking other language at home - Born in the United States (%)
Residents speaking other language at home - Native, born elsewhere (%)
Residents speaking other language at home - Foreign born (%)
Marital status - Never married (%)
Marital status - Now married (%)
Marital status - Separated (%)
Marital status - Widowed (%)
Marital status - Divorced (%)
Ancestries Reported - Arab (%)
Ancestries Reported - Czech (%)
Ancestries Reported - Danish (%)
Ancestries Reported - Dutch (%)
Ancestries Reported - English (%)
Ancestries Reported - French (%)
Ancestries Reported - French Canadian (%)
Ancestries Reported - German (%)
Ancestries Reported - Greek (%)
Ancestries Reported - Hungarian (%)
Ancestries Reported - Irish (%)
Ancestries Reported - Italian (%)
Ancestries Reported - Lithuanian (%)
Ancestries Reported - Norwegian (%)
Ancestries Reported - Polish (%)
Ancestries Reported - Portuguese (%)
Ancestries Reported - Russian (%)
Ancestries Reported - Scotch-Irish (%)
Ancestries Reported - Scottish (%)
Ancestries Reported - Slovak (%)
Ancestries Reported - Subsaharan African (%)
Ancestries Reported - Swedish (%)
Ancestries Reported - Swiss (%)
Ancestries Reported - Ukrainian (%)
Ancestries Reported - United States (%)
Ancestries Reported - Welsh (%)
Ancestries Reported - West Indian (%)
Ancestries Reported - Other (%)
Geographical mobility - Same house 1 year ago (%)
Geographical mobility - Same house 1 year ago (%) - White
Geographical mobility - Same house 1 year ago (%) - Black or African American
Geographical mobility - Same house 1 year ago (%) - Asian
Geographical mobility - Same house 1 year ago (%) - Hispanic or Latino
Geographical mobility - Same house 1 year ago (%) - American Indian and Alaska Native
Geographical mobility - Same house 1 year ago (%) - Multirace
Geographical mobility - Same house 1 year ago (%) - Other Race
Geographical mobility - Moved within same county (%)
Geographical mobility - Moved within same county (%) - White
Geographical mobility - Moved within same county (%) - Black or African American
Geographical mobility - Moved within same county (%) - Asian
Geographical mobility - Moved within same county (%) - Hispanic or Latino
Geographical mobility - Moved within same county (%) - American Indian and Alaska Native
Geographical mobility - Moved within same county (%) - Multirace
Geographical mobility - Moved within same county (%) - Other Race
Geographical mobility - Moved from different county within same state (%)
Geographical mobility - Moved from different county within same state (%) - White
Geographical mobility - Moved from different county within same state (%) - Black or African American
Geographical mobility - Moved from different county within same state (%) - Asian
Geographical mobility - Moved from different county within same state (%) - Hispanic or Latino
Geographical mobility - Moved from different county within same state (%) - American Indian and Alaska Native
Geographical mobility - Moved from different county within same state (%) - Multirace
Geographical mobility - Moved from different county within same state (%) - Other Race
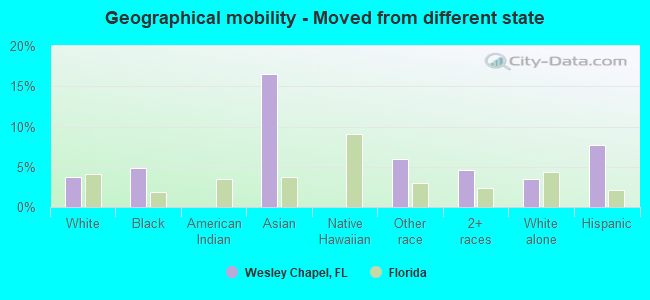
Geographical mobility - Moved from different state (%)
Geographical mobility - Moved from different state (%) - White
Geographical mobility - Moved from different state (%) - Black or African American
Geographical mobility - Moved from different state (%) - Asian
Geographical mobility - Moved from different state (%) - Hispanic or Latino
Geographical mobility - Moved from different state (%) - American Indian and Alaska Native
Geographical mobility - Moved from different state (%) - Multirace
Geographical mobility - Moved from different state (%) - Other Race
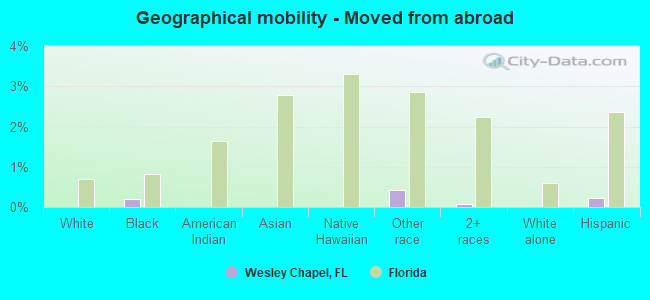
Geographical mobility - Moved from abroad (%)
Geographical mobility - Moved from abroad (%) - White
Geographical mobility - Moved from abroad (%) - Black or African American
Geographical mobility - Moved from abroad (%) - Asian
Geographical mobility - Moved from abroad (%) - Hispanic or Latino
Geographical mobility - Moved from abroad (%) - American Indian and Alaska Native
Geographical mobility - Moved from abroad (%) - Multirace
Geographical mobility - Moved from abroad (%) - Other Race
Place of birth for the foreign-born population - Ireland (%)
Place of birth for the foreign-born population - Denmark (%)
Place of birth for the foreign-born population - Norway (%)
Place of birth for the foreign-born population - Sweden (%)
Place of birth for the foreign-born population - United Kingdom (%)
Place of birth for the foreign-born population - England (%)
Place of birth for the foreign-born population - Scotland (%)
Place of birth for the foreign-born population - Other Northern Europe (%)
Place of birth for the foreign-born population - Austria (%)
Place of birth for the foreign-born population - Belgium (%)
Place of birth for the foreign-born population - France (%)
Place of birth for the foreign-born population - Germany (%)
Place of birth for the foreign-born population - Netherlands (%)
Place of birth for the foreign-born population - Switzerland (%)
Place of birth for the foreign-born population - Other Western Europe (%)
Place of birth for the foreign-born population - Greece (%)
Place of birth for the foreign-born population - Italy (%)
Place of birth for the foreign-born population - Portugal (%)
Place of birth for the foreign-born population - Spain (%)
Place of birth for the foreign-born population - Other Southern Europe (%)
Place of birth for the foreign-born population - Albania (%)
Place of birth for the foreign-born population - Belarus (%)
Place of birth for the foreign-born population - Bosnia and Herzegovina (%)
Place of birth for the foreign-born population - Bulgaria (%)
Place of birth for the foreign-born population - Croatia (%)
Place of birth for the foreign-born population - Czechoslovakia (%)
Place of birth for the foreign-born population - Hungary (%)
Place of birth for the foreign-born population - Latvia (%)
Place of birth for the foreign-born population - Lithuania (%)
Place of birth for the foreign-born population - North Macedonia (Macedonia) (%)
Place of birth for the foreign-born population - Moldova (%)
Place of birth for the foreign-born population - Poland (%)
Place of birth for the foreign-born population - Romania (%)
Place of birth for the foreign-born population - Russia (%)
Place of birth for the foreign-born population - Serbia (%)
Place of birth for the foreign-born population - Ukraine (%)
Place of birth for the foreign-born population - Other Eastern Europe (%)
Place of birth for the foreign-born population - China (%)
Place of birth for the foreign-born population - Hong Kong (%)
Place of birth for the foreign-born population - Taiwan (%)
Place of birth for the foreign-born population - Japan (%)
Place of birth for the foreign-born population - Korea (%)
Place of birth for the foreign-born population - Other Eastern Asia (%)
Place of birth for the foreign-born population - Afghanistan (%)
Place of birth for the foreign-born population - Bangladesh (%)
Place of birth for the foreign-born population - India (%)
Place of birth for the foreign-born population - Iran (%)
Place of birth for the foreign-born population - Kazakhstan (%)
Place of birth for the foreign-born population - Nepal (%)
Place of birth for the foreign-born population - Pakistan (%)
Place of birth for the foreign-born population - Sri Lanka (%)
Place of birth for the foreign-born population - Uzbekistan (%)
Place of birth for the foreign-born population - Other South Central Asia (%)
Place of birth for the foreign-born population - Burma (%)
Place of birth for the foreign-born population - Cambodia (%)
Place of birth for the foreign-born population - Indonesia (%)
Place of birth for the foreign-born population - Laos (%)
Place of birth for the foreign-born population - Malaysia (%)
Place of birth for the foreign-born population - Philippines (%)
Place of birth for the foreign-born population - Singapore (%)
Place of birth for the foreign-born population - Thailand (%)
Place of birth for the foreign-born population - Vietnam (%)
Place of birth for the foreign-born population - Other South Eastern Asia (%)
Place of birth for the foreign-born population - Armenia (%)
Place of birth for the foreign-born population - Iraq (%)
Place of birth for the foreign-born population - Israel (%)
Place of birth for the foreign-born population - Jordan (%)
Place of birth for the foreign-born population - Kuwait (%)
Place of birth for the foreign-born population - Lebanon (%)
Place of birth for the foreign-born population - Saudi Arabia (%)
Place of birth for the foreign-born population - Syria (%)
Place of birth for the foreign-born population - Turkey (%)
Place of birth for the foreign-born population - Yemen (%)
Place of birth for the foreign-born population - Other Western Asia (%)
Place of birth for the foreign-born population - Eritrea (%)
Place of birth for the foreign-born population - Ethiopia (%)
Place of birth for the foreign-born population - Kenya (%)
Place of birth for the foreign-born population - Somalia (%)
Place of birth for the foreign-born population - Uganda (%)
Place of birth for the foreign-born population - Zimbabwe (%)
Place of birth for the foreign-born population - Other Eastern Africa (%)
Place of birth for the foreign-born population - Cameroon (%)
Place of birth for the foreign-born population - Congo (%)
Place of birth for the foreign-born population - Democratic Republic of Congo (Zaire) (%)
Place of birth for the foreign-born population - Other Middle Africa (%)
Place of birth for the foreign-born population - Egypt (%)
Place of birth for the foreign-born population - Morocco (%)
Place of birth for the foreign-born population - Sudan (%)
Place of birth for the foreign-born population - Other Northern Africa (%)
Place of birth for the foreign-born population - South Africa (%)
Place of birth for the foreign-born population - Other Southern Africa (%)
Place of birth for the foreign-born population - Cabo Verde (%)
Place of birth for the foreign-born population - Ghana (%)
Place of birth for the foreign-born population - Liberia (%)
Place of birth for the foreign-born population - Nigeria (%)
Place of birth for the foreign-born population - Senegal (%)
Place of birth for the foreign-born population - Sierra Leone (%)
Place of birth for the foreign-born population - Other Western Africa (%)
Place of birth for the foreign-born population - Australia (%)
Place of birth for the foreign-born population - New Zealand (%)
Place of birth for the foreign-born population - Fiji (%)
Place of birth for the foreign-born population - Micronesia (%)
Place of birth for the foreign-born population - Bahamas (%)
Place of birth for the foreign-born population - Barbados (%)
Place of birth for the foreign-born population - Cuba (%)
Place of birth for the foreign-born population - Dominica (%)
Place of birth for the foreign-born population - Dominican Republic (%)
Place of birth for the foreign-born population - Grenada (%)
Place of birth for the foreign-born population - Haiti (%)
Place of birth for the foreign-born population - Jamaica (%)
Place of birth for the foreign-born population - St. Vincent and the Grenadines (%)
Place of birth for the foreign-born population - Trinidad and Tobago (%)
Place of birth for the foreign-born population - West Indies (%)
Place of birth for the foreign-born population - Other Caribbean (%)
Place of birth for the foreign-born population - Belize (%)
Place of birth for the foreign-born population - Costa Rica (%)
Place of birth for the foreign-born population - El Salvador (%)
Place of birth for the foreign-born population - Guatemala (%)
Place of birth for the foreign-born population - Honduras (%)
Place of birth for the foreign-born population - Mexico (%)
Place of birth for the foreign-born population - Nicaragua (%)
Place of birth for the foreign-born population - Panama (%)
Place of birth for the foreign-born population - Other Central America (%)
Place of birth for the foreign-born population - Argentina (%)
Place of birth for the foreign-born population - Bolivia (%)
Place of birth for the foreign-born population - Brazil (%)
Place of birth for the foreign-born population - Chile (%)
Place of birth for the foreign-born population - Colombia (%)
Place of birth for the foreign-born population - Ecuador (%)
Place of birth for the foreign-born population - Guyana (%)
Place of birth for the foreign-born population - Peru (%)
Place of birth for the foreign-born population - Uruguay (%)
Place of birth for the foreign-born population - Venezuela (%)
Place of birth for the foreign-born population - Other South America (%)
Place of birth for the foreign-born population - Canada (%)
Place of birth for the foreign-born population - Other Northern America (%)
Place of birth for the foreign-born population - Other (%)
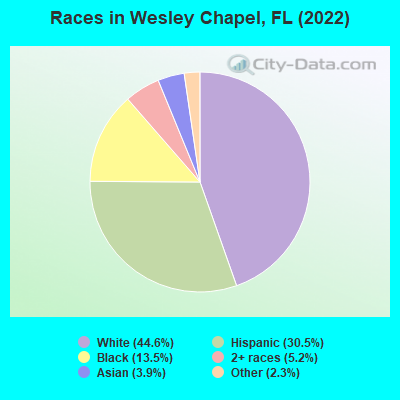
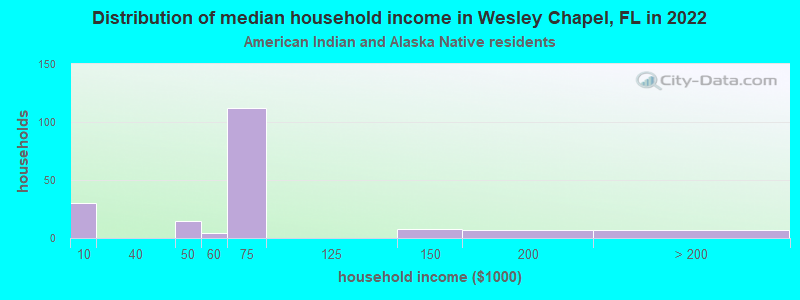
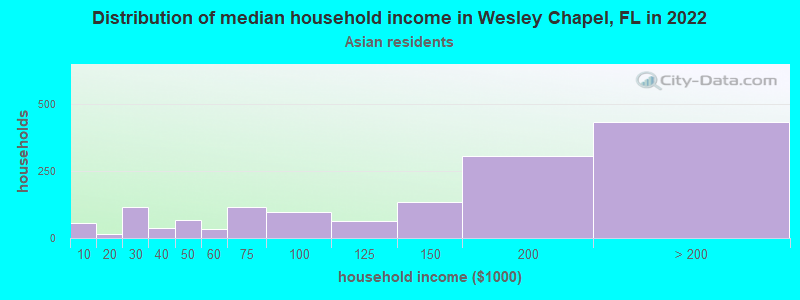
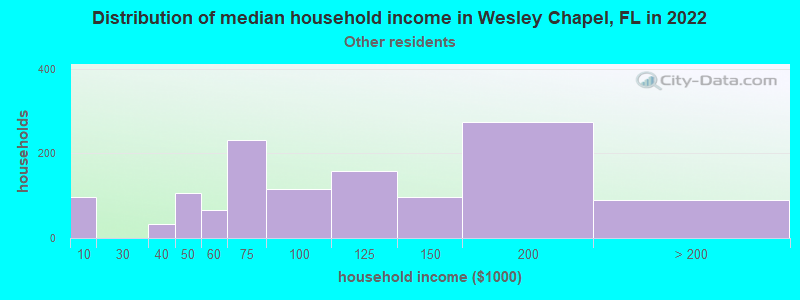
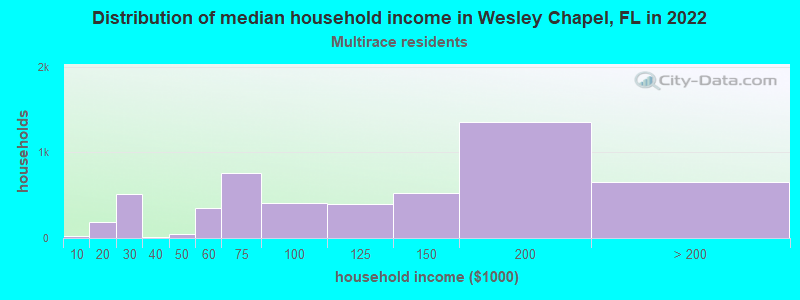
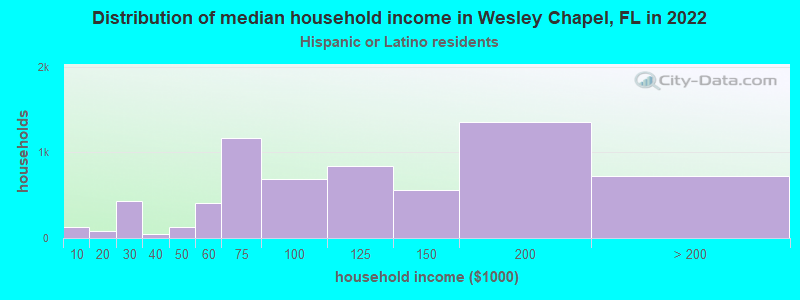
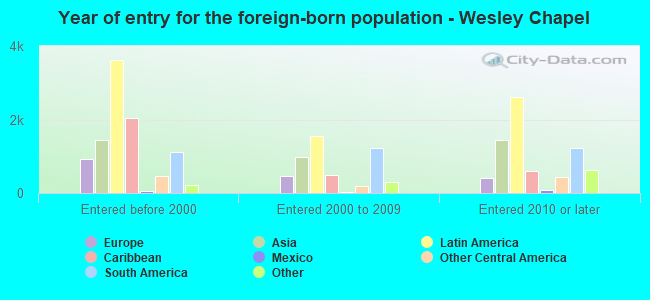
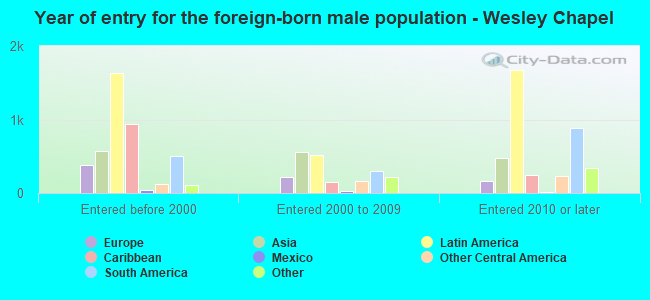
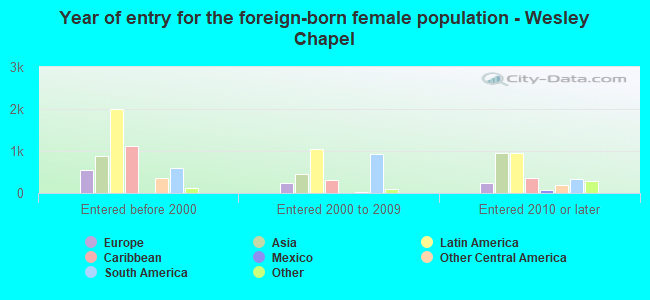
According to 2022 data, the most numerous races in Wesley Chapel, FL are White alone (36,329 residents), Hispanic (24,807 residents), and Black alone (11,001 residents). 67.4% of Wesley Chapel residents speak English at home. 17.5% of Wesley Chapel, FL residents are foreign-born (8.7% born in Latin America, 5.4% born in Asia, 2.2% born in Europe), which is 20.3% less than the foreign-born rate of 21.0% across the entire state of Florida.
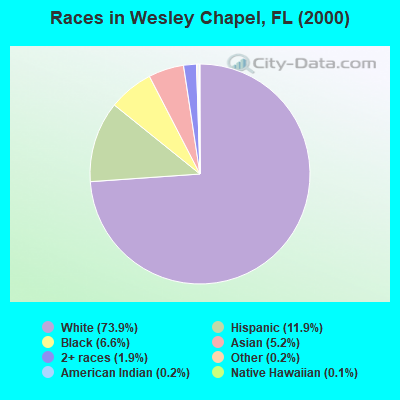
Race distribution in Wesley Chapel
2000 2022
10,458,509 65.4% White alone 2,682,715 16.8% Hispanic 2,264,268 14.2% Black alone 261,693 1.6% Asian alone 236,954 1.5% Two or more races 42,358 0.3% American Indian alone 28,994 0.2% Other race alone 6,887 0.04% Native Hawaiian and Other
11,309,403 50.8% White alone 6,025,039 27.1% Hispanic 3,241,015 14.6% Black alone 861,630 3.9% Two or more races 623,692 2.8% Asian alone 152,054 0.7% Other race alone 22,504 0.1% American Indian alone 9,486 0.04% Native Hawaiian and Other
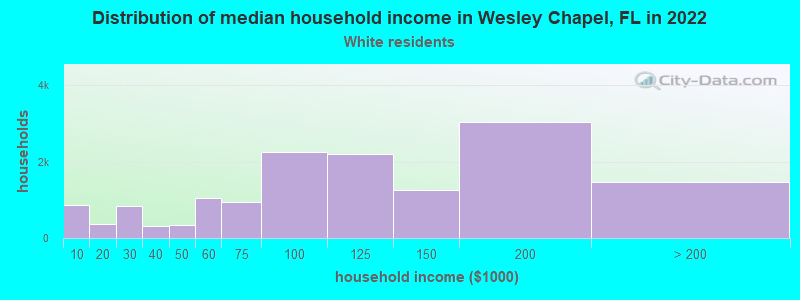
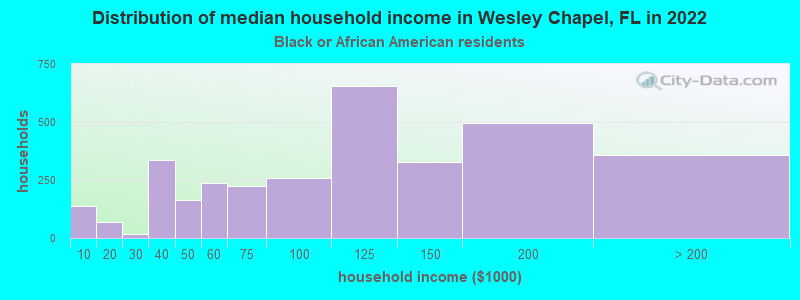
Income and house value in Wesley Chapel Median household income in 2022 $105,340 White non-Hispanic householders$91,027 Black householders$186,975 Asian householders$99,205 Some other race householders$89,654 Two or more races householders$89,827 Hispanic or Latino race householdersMedian 2022 house value $417,983 White Non-Hispanic householders$481,514 Black or African American householders $398,798 Asian householders$462,015 Some other race householders$407,605 Two or more races householders$422,072 Hispanic or Latino householders
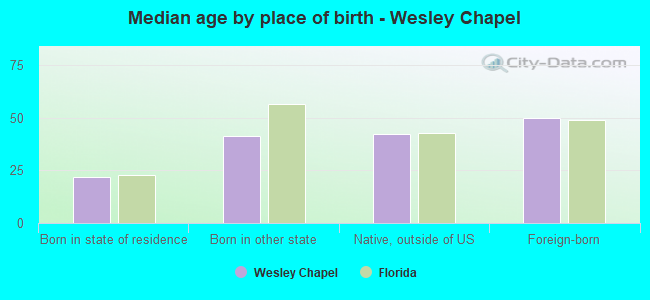
Median age by race in Wesley Chapel
41.6 Median age for White residents40.3 42.3 37.9 Median age for Black or African American residents31.8 43.2 -666,666,666.0 Median age for American Indian / Alaska Native residents-666,666,666.0 -666,666,666.0 41.5 Median age for Asian residents36.4 55.2 -666,666,666.0 Median age for Native Hawaiian / Pacific Islander residents-666,666,666.0 -666,666,666.0 40.5 Median age for Other race residents34.0 44.8 34.8 Median age for Two or more races residents36.4 28.9 41.4 Median age for White alone residents40.6 41.9 36.7 Median age for Hispanic or Latino residents35.7 37.9
Owner/renter occupied households by race in Wesley Chapel
House owners and renters - White residents 11,456 76.5% Owner occupied3,511 23.5% Renter occupiedHouse owners and renters - Black or African American residents 2,588 62.6% Owner occupied1,547 37.4% Renter occupiedHouse owners and renters - American Indian / Alaska Native residents 137 96.1% Owner occupied6 3.9% Renter occupiedHouse owners and renters - Asian residents 1,801 97.3% Owner occupied51 2.7% Renter occupiedHouse owners and renters - Other race residents 1,803 71.0% Owner occupied736 29.0% Renter occupiedHouse owners and renters - Two or more races residents 3,256 65.6% Owner occupied1,704 34.4% Renter occupiedHouse owners and renters - White alone residents 10,269 74.8% Owner occupied3,453 25.2% Renter occupiedHouse owners and renters - Hispanic or Latino residents 5,509 73.6% Owner occupied1,972 26.4% Renter occupied
Language usage in Wesley Chapel
English speakers - Total 67.4% of residents of Wesley Chapel speak English at home.
22.1% of residents speak Spanish at home 11,559 66.6% Speak English very well5,789 33.4% Speak English less than very well10.5% of residents speak other language at home 6,812 82.4% Speak English very well1,452 17.6% Speak English less than very well
English speakers - Born in the United States 87.9% of residents of Wesley Chapel speak English at home.
10.0% of residents speak Spanish at home 2,938 89.7% Speak English very well339 10.3% Speak English less than very well2.1% of residents speak other language at home 678 100.0% Speak English very well
English speakers - Native, born elsewhere 33.9% of residents of Wesley Chapel speak English at home.
63.0% of residents speak Spanish at home 2,666 73.0% Speak English very well987 27.0% Speak English less than very well3.2% of residents speak other language at home 185 100.0% Speak English very well
English speakers - Foreign-born 17.8% of residents of Wesley Chapel speak English at home.
46.4% of residents speak Spanish at home 5,112 59.4% Speak English very well3,490 40.6% Speak English less than very well35.9% of residents speak other language at home 5,200 78.2% Speak English very well1,452 21.8% Speak English less than very well
White (Caucasian) - Speak only English Native:
95.1% (33,023)Foreign-born:
15.0% (555)
White (Caucasian) - Speak another language Native:
4.9% (1,704)Foreign-born:
85.0% (3,150)
Black or African American - Speak only English Native:
95.1% (8,363)Foreign-born:
55.4% (1,580)
Black or African American - Speak another language Native:
4.9% (429)Foreign-born:
44.6% (1,273)
American Indian / Alaska Native - Speak another language Native:
94.6% (310)Foreign-born:
100.0% (33)
Asian - Speak only English Native:
48.3% (785)Foreign-born:
12.9% (461)
Asian - Speak another language Native:
42.7% (694)Foreign-born:
84.6% (3,030)
Native Hawaiian / Pacific Islander - Speak only English Native:
87.6% (10)Foreign-born:
100.0% (2)
Other race - Speak only English Native:
47.9% (2,668)Foreign-born:
13.0% (508)
Other race - Speak another language Native:
52.1% (2,901)Foreign-born:
87.0% (3,412)
Two or more races - Speak only English Native:
53.6% (5,446)Foreign-born:
11.4% (657)
Two or more races - Speak another language Native:
46.4% (4,711)Foreign-born:
88.6% (5,081)
White alone - Speak only English Native:
96.4% (30,802)Foreign-born:
15.8% (507)
White alone - Speak another language Native:
3.6% (1,158)Foreign-born:
84.2% (2,699)
Hispanic or Latino - Speak only English Native:
44.7% (6,520)Foreign-born:
8.3% (780)
Hispanic or Latino - Speak another language Native:
55.3% (8,080)Foreign-born:
91.7% (8,596)
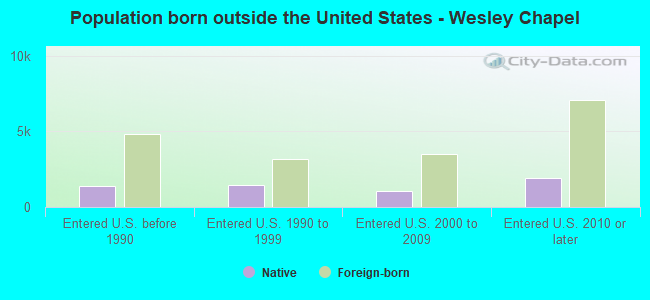
Foreign-born residents in Wesley Chapel 12,845 residents are foreign born (8.7% Latin America , 5.4% Asia , 2.2% Europe ).
This city:
17.5%Florida:
21.1%
Marital status for residents in Wesley Chapel Marital status - White (Caucasian) population 15 years and over
Males 30.8% Never married52.8% Now married0.0% Separated1.4% Widowed15.0% DivorcedFemales 26.4% Never married47.4% Now married1.0% Separated6.4% Widowed18.9% DivorcedWomen who gave birth in the past 12 months Now married:
100.0% (302)Unmarried:
0.0% (0)
Women who did not give birth in the past 12 months Now married:
44.3% (4,635)Unmarried:
55.7% (5,820)
Marital status - Black or African American population 15 years and over
Males 45.3% Never married45.6% Now married0.0% Separated5.0% Widowed4.1% DivorcedFemales 37.5% Never married38.4% Now married7.3% Separated2.4% Widowed14.4% DivorcedWomen who gave birth in the past 12 months Now married:
73.7% (93)Unmarried:
26.3% (33)
Women who did not give birth in the past 12 months Now married:
38.2% (806)Unmarried:
61.8% (1,305)
Marital status - American Indian / Alaska Native population 15 years and over
Males 9.6% Never married3.8% Now married0.0% Separated0.0% Widowed86.5% DivorcedFemales 62.8% Never married14.7% Now married4.7% Separated0.0% Widowed17.8% DivorcedWomen who did not give birth in the past 12 months Now married:
27.3% (10)Unmarried:
72.7% (26)
Marital status - Asian population 15 years and over
Males 31.4% Never married67.3% Now married0.0% Separated0.5% Widowed0.7% DivorcedFemales 13.5% Never married69.6% Now married0.0% Separated7.2% Widowed9.7% DivorcedWomen who gave birth in the past 12 months Now married:
100.0% (34)Unmarried:
0.0% (0)
Women who did not give birth in the past 12 months Now married:
71.5% (908)Unmarried:
28.5% (362)
Marital status - Native Hawaiian / Pacific Islander population 15 years and over
Males 0.0% Never married100.0% Now married0.0% Separated0.0% Widowed0.0% DivorcedFemales 0.0% Never married100.0% Now married0.0% Separated0.0% Widowed0.0% DivorcedMarital status - Other race population 15 years and over
Males 43.8% Never married54.2% Now married0.0% Separated0.0% Widowed2.0% DivorcedFemales 35.4% Never married47.8% Now married1.4% Separated3.7% Widowed11.8% DivorcedWomen who did not give birth in the past 12 months Now married:
40.8% (768)Unmarried:
59.2% (1,116)
Marital status - Two or more races population 15 years and over
Males 36.3% Never married57.7% Now married1.3% Separated0.6% Widowed4.1% DivorcedFemales 30.1% Never married52.6% Now married0.5% Separated1.8% Widowed14.9% DivorcedWomen who gave birth in the past 12 months Now married:
100.0% (40)Unmarried:
0.0% (0)
Women who did not give birth in the past 12 months Now married:
33.2% (1,510)Unmarried:
66.8% (3,042)
Marital status - White alone, not Hispanic / Latino population 15 years and over
Males 31.7% Never married51.3% Now married0.0% Separated1.2% Widowed15.8% DivorcedFemales 27.0% Never married45.4% Now married1.0% Separated6.8% Widowed19.8% DivorcedWomen who gave birth in the past 12 months Now married:
100.0% (302)Unmarried:
0.0% (0)
Women who did not give birth in the past 12 months Now married:
40.7% (3,953)Unmarried:
59.3% (5,748)
Marital status - Hispanic or Latino population 15 years and over
Males 38.2% Never married56.5% Now married0.8% Separated0.8% Widowed3.7% DivorcedFemales 23.6% Never married60.4% Now married2.2% Separated1.3% Widowed12.5% DivorcedWomen who gave birth in the past 12 months Now married:
32.5% (29)Unmarried:
67.5% (60)
Women who did not give birth in the past 12 months Now married:
43.3% (2,394)Unmarried:
56.7% (3,134)
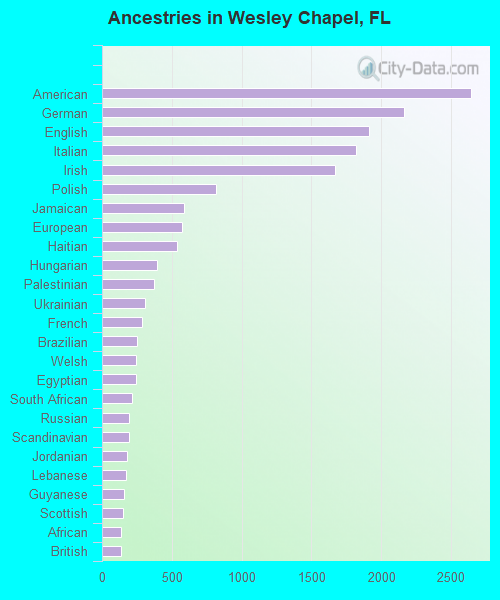
Ancestries in Wesley Chapel
2,642 7.1% American2,168 5.8% German1,911 5.1% English1,822 4.9% Italian1,667 4.5% Irish814 2.2% Polish586 1.6% Jamaican570 1.5% European540 1.5% Haitian397 1.1% Hungarian374 1.0% Palestinian307 0.8% Ukrainian289 0.8% French251 0.7% Brazilian246 0.7% Welsh243 0.7% Egyptian216 0.6% South African197 0.5% Russian192 0.5% Scandinavian177 0.5% Jordanian170 0.5% Lebanese161 0.4% Guyanese152 0.4% Scottish139 0.4% African133 0.4% British131 0.4% Scotch-Irish90 0.2% Albanian87 0.2% Canadian85 0.2% Turkish77 0.2% Eastern European71 0.2% West Indian70 0.2% Slovak68 0.2% French Canadian54 0.1% Austrian53 0.1% Greek52 0.1% Romanian52 0.1% Trinidadian and Tobagonian49 0.1% Norwegian48 0.1% Swedish47 0.1% Afghan47 0.1% Iranian45 0.1% Bermudan42 0.1% Bulgarian42 0.1% British West Indian39 0.1% Australian36 0.10% Yugoslavian36 0.10% Dutch32 0.09% Syrian26 0.07% Finnish24 0.06% Portuguese23 0.06% Nigerian20 0.05% Barbadian18 0.05% Bahamian17 0.05% Moroccan16 0.04% Belizean15 0.04% Ghanaian15 0.04% Armenian14 0.04% Belgian13 0.03% Croatian11 0.03% Czechoslovakian11 0.03% Arab7 0.02% Senegalese7 0.02% Estonian
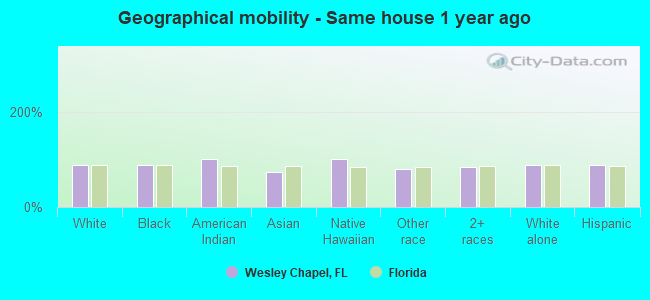
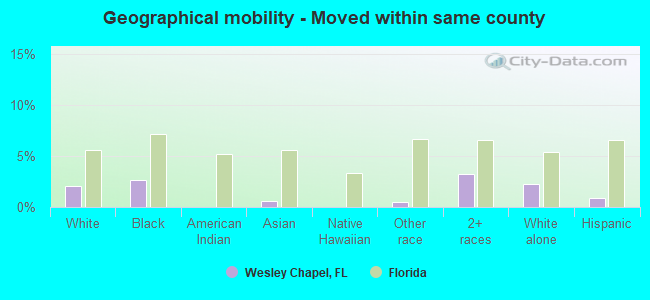
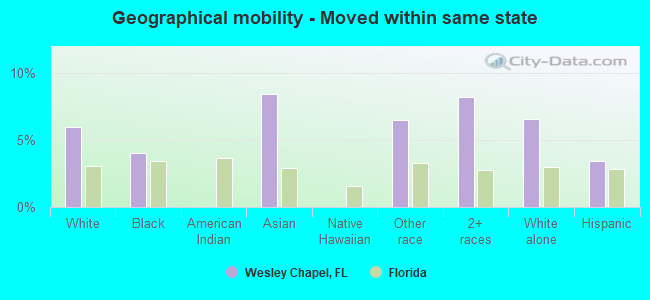
Geographical mobility in Wesley Chapel Same house 1 year ago 34,832 88.3% White (Caucasian)8,303 88.5% Black or African American421 100.0% American Indian / Alaska Native4,026 74.2% Asian15 100.0% Native Hawaiian / Pacific Islander4,985 80.3% Other race12,745 83.5% Two or more races31,775 87.8% White alone, not Hispanic / Latino21,705 87.8% Hispanic or LatinoMoved within same county 808 2.0% White / Caucasian251 2.7% Black or African American30 0.6% Asian32 0.5% Other race501 3.3% Two or more races808 2.2% White alone, not Hispanic / Latino226 0.9% Hispanic or LatinoMoved within same state 2,361 6.0% White / Caucasian375 4.0% Black or African American455 8.4% Asian401 6.5% Other race1,253 8.2% Two or more races2,361 6.5% White alone, not Hispanic / Latino844 3.4% Hispanic or LatinoMoved from different state 1,456 3.7% White / Caucasian449 4.8% Black or African American899 16.6% Asian367 5.9% Other race700 4.6% Two or more races1,247 3.4% White alone, not Hispanic / Latino1,899 7.7% Hispanic or LatinoMoved from abroad 19 0.2% Black or African American26 0.4% Other race13 0.1% Two or more races54 0.2% Hispanic or Latino
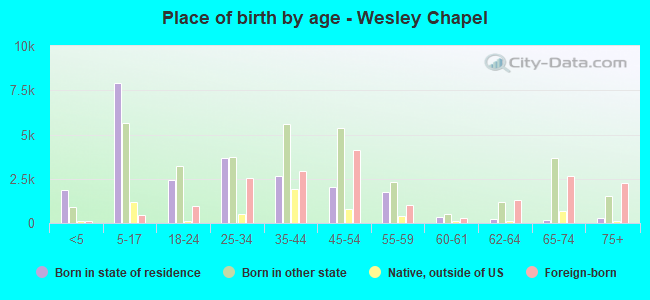
Children Nativity (place of birth) in Wesley Chapel
Children under 6 years - Living with two parents Both parents native 1,802 100.0% NativeBoth parents foreign-born 430 100.0% NativeOne native, one foreign-born parent 620 100.0% NativeChildren under 6 years - Living with one parent Native parent 375 100.0% NativeForeign-born parent 104 100.0% NativeChildren 6 to 17 years - Living with two parents Both parents native 6,271 99.0% Native64 1.0% Foreign-bornBoth parents foreign-born 506 55.2% Native410 44.8% Foreign-bornOne native, one foreign-born parent 2,327 100.0% NativeChildren 6 to 17 years - Living with one parent Native parent 3,984 100.0% NativeForeign-born parent 380 50.0% Native380 50.0% Foreign-born
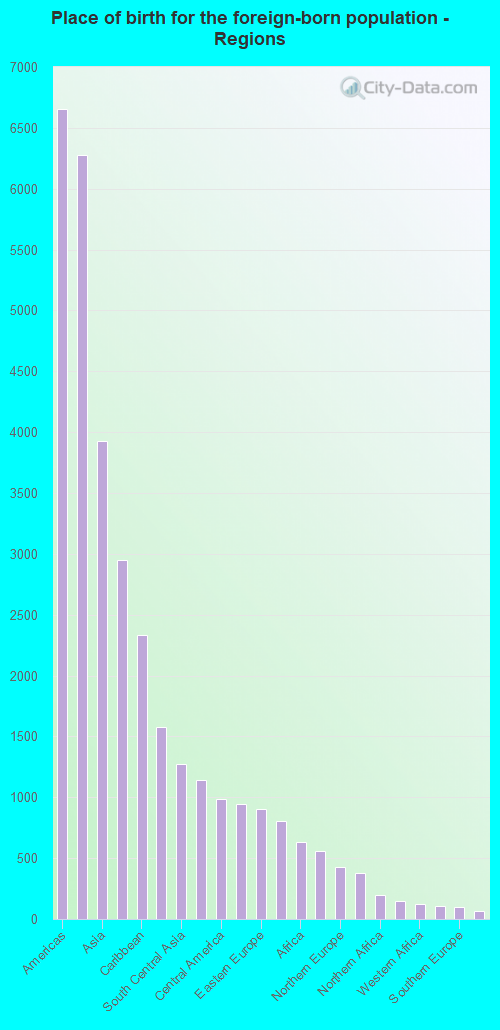
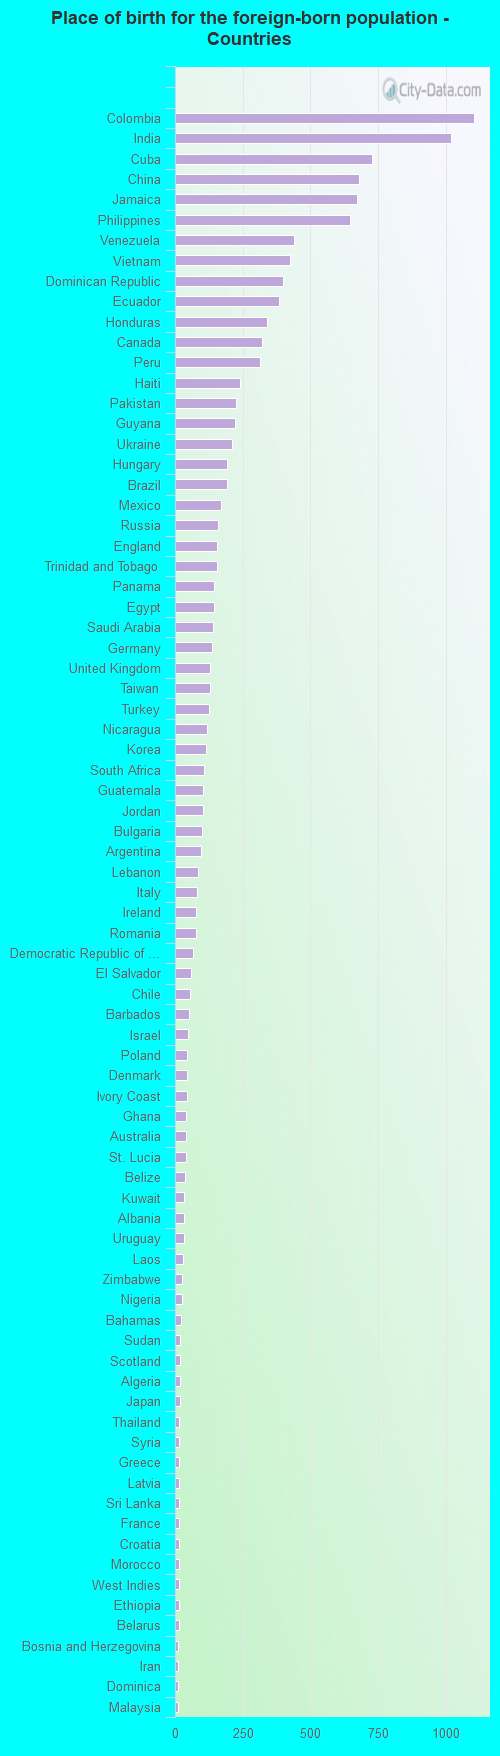
Place of birth for residents in Wesley Chapel 6,658 Americas6,276 Latin America3,925 Asia2,953 South America2,336 Caribbean1,580 Europe1,273 South Central Asia1,138 South Eastern Asia985 Central America941 Eastern Asia904 Eastern Europe809 China633 Africa559 Western Asia428 Northern Europe382 Northern America195 Northern Africa150 Western Europe127 Western Africa109 Southern Africa96 Southern Europe68 Middle Africa46 Eastern Africa46 Oceania42 Australia and New Zealand Subregion1,105 Colombia1,019 India729 Cuba681 China671 Jamaica647 Philippines441 Venezuela426 Vietnam400 Dominican Republic386 Ecuador341 Honduras320 Canada315 Peru239 Haiti225 Pakistan221 Guyana212 Ukraine192 Hungary191 Brazil170 Mexico159 Russia154 England154 Trinidad and Tobago143 Panama143 Egypt142 Saudi Arabia135 Germany130 United Kingdom128 Taiwan127 Turkey119 Nicaragua113 Korea109 South Africa103 Guatemala102 Jordan100 Bulgaria96 Argentina86 Lebanon81 Italy78 Ireland76 Romania68 Democratic Republic of Congo (Zaire)60 El Salvador55 Chile53 Barbados48 Israel46 Poland45 Denmark45 Ivory Coast42 Ghana42 Australia41 St. Lucia38 Belize35 Kuwait32 Albania32 Uruguay30 Laos27 Zimbabwe26 Nigeria21 Bahamas20 Sudan18 Scotland17 Algeria17 Japan16 Thailand16 Syria15 Greece15 Latvia15 Sri Lanka14 France14 Croatia14 Morocco13 West Indies13 Ethiopia13 Belarus12 Bosnia and Herzegovina12 Iran11 Dominica11 Malaysia9 Costa Rica5 Singapore5 Tanzania4 Micronesia
Grandparents responsible for own grandchildren in Wesley Chapel
Grandparents (30 to 59 years) White / Caucasian 102 29.3% Responsible for grandchildren245 70.7% Not responsible for grandchildrenBlack or African American 121 57.0% Responsible for grandchildren92 43.0% Not responsible for grandchildrenOther race 42 100.0% Not responsible for grandchildrenTwo or more races 13 100.0% Not responsible for grandchildrenWhite alone, not Hispanic / Latino 107 34.1% Responsible for grandchildren207 65.9% Not responsible for grandchildrenHispanic or Latino 48 100.0% Not responsible for grandchildrenGrandparents (60 years and over) White / Caucasian 180 41.7% Responsible for grandchildren252 58.3% Not responsible for grandchildrenBlack or African American 22 91.9% Responsible for grandchildren2 8.1% Not responsible for grandchildrenOther race 62 38.2% Responsible for grandchildren100 61.8% Not responsible for grandchildrenTwo or more races 14 8.4% Responsible for grandchildren149 91.6% Not responsible for grandchildrenWhite alone, not Hispanic / Latino 176 42.0% Responsible for grandchildren243 58.0% Not responsible for grandchildrenHispanic or Latino 19 8.6% Responsible for grandchildren202 91.4% Not responsible for grandchildren