Races in Wekiwa Springs, Florida (FL) Detailed Stats
Data:
Races - White alone (%)
Races - White alone (% change since 2000)
Races - Black alone (%)
Races - Black alone (% change since 2000)
Races - American Indian alone (%)
Races - American Indian alone (% change since 2000)
Races - Asian alone (%)
Races - Asian alone (% change since 2000)
Races - Hispanic (%)
Races - Hispanic (% change since 2000)
Races - Native Hawaiian and Other Pacific Islander alone (%)
Races - Native Hawaiian and Other Pacific Islander alone (% change since 2000)
Races - Two or more races(%)
Races - Two or more races(% change since 2000)
Races - Other race alone (%)
Races - Other race alone (% change since 2000)
Racial diversity
Place of birth - Born in state of residence (%)
Place of birth - Born in state of residence (%) - White
Place of birth - Born in state of residence (%) - Black or African American
Place of birth - Born in state of residence (%) - Asian
Place of birth - Born in state of residence (%) - Hispanic or Latino
Place of birth - Born in state of residence (%) - American Indian and Alaska Native
Place of birth - Born in state of residence (%) - Multirace
Place of birth - Born in state of residence (%) - Other Race
Place of birth - Born in other state (%)
Place of birth - Born in other state (%) - White
Place of birth - Born in other state (%) - Black or African American
Place of birth - Born in other state (%) - Asian
Place of birth - Born in other state (%) - Hispanic or Latino
Place of birth - Born in other state (%) - American Indian and Alaska Native
Place of birth - Born in other state (%) - Multirace
Place of birth - Born in other state (%) - Other Race
Place of birth - Native, outside of US (%)
Place of birth - Native, outside of US (%) - White
Place of birth - Native, outside of US (%) - Black or African American
Place of birth - Native, outside of US (%) - Asian
Place of birth - Native, outside of US (%) - Hispanic or Latino
Place of birth - Native, outside of US (%) - American Indian and Alaska Native
Place of birth - Native, outside of US (%) - Multirace
Place of birth - Native, outside of US (%) - Other Race
Place of birth - Foreign born (%)
Place of birth - Foreign born (%) - White
Place of birth - Foreign born (%) - Black or African American
Place of birth - Foreign born (%) - Asian
Place of birth - Foreign born (%) - Hispanic or Latino
Place of birth - Foreign born (%) - American Indian and Alaska Native
Place of birth - Foreign born (%) - Multirace
Place of birth - Foreign born (%) - Other Race
Residents speaking English at home (%)
Residents speaking English at home - Born in the United States (%)
Residents speaking English at home - Native, born elsewhere (%)
Residents speaking English at home - Foreign born (%)
Residents speaking Spanish at home (%)
Residents speaking Spanish at home - Born in the United States (%)
Residents speaking Spanish at home - Native, born elsewhere (%)
Residents speaking Spanish at home - Foreign born (%)
Residents speaking other language at home (%)
Residents speaking other language at home - Born in the United States (%)
Residents speaking other language at home - Native, born elsewhere (%)
Residents speaking other language at home - Foreign born (%)
Marital status - Never married (%)
Marital status - Now married (%)
Marital status - Separated (%)
Marital status - Widowed (%)
Marital status - Divorced (%)
Ancestries Reported - Arab (%)
Ancestries Reported - Czech (%)
Ancestries Reported - Danish (%)
Ancestries Reported - Dutch (%)
Ancestries Reported - English (%)
Ancestries Reported - French (%)
Ancestries Reported - French Canadian (%)
Ancestries Reported - German (%)
Ancestries Reported - Greek (%)
Ancestries Reported - Hungarian (%)
Ancestries Reported - Irish (%)
Ancestries Reported - Italian (%)
Ancestries Reported - Lithuanian (%)
Ancestries Reported - Norwegian (%)
Ancestries Reported - Polish (%)
Ancestries Reported - Portuguese (%)
Ancestries Reported - Russian (%)
Ancestries Reported - Scotch-Irish (%)
Ancestries Reported - Scottish (%)
Ancestries Reported - Slovak (%)
Ancestries Reported - Subsaharan African (%)
Ancestries Reported - Swedish (%)
Ancestries Reported - Swiss (%)
Ancestries Reported - Ukrainian (%)
Ancestries Reported - United States (%)
Ancestries Reported - Welsh (%)
Ancestries Reported - West Indian (%)
Ancestries Reported - Other (%)
Geographical mobility - Same house 1 year ago (%)
Geographical mobility - Same house 1 year ago (%) - White
Geographical mobility - Same house 1 year ago (%) - Black or African American
Geographical mobility - Same house 1 year ago (%) - Asian
Geographical mobility - Same house 1 year ago (%) - Hispanic or Latino
Geographical mobility - Same house 1 year ago (%) - American Indian and Alaska Native
Geographical mobility - Same house 1 year ago (%) - Multirace
Geographical mobility - Same house 1 year ago (%) - Other Race
Geographical mobility - Moved within same county (%)
Geographical mobility - Moved within same county (%) - White
Geographical mobility - Moved within same county (%) - Black or African American
Geographical mobility - Moved within same county (%) - Asian
Geographical mobility - Moved within same county (%) - Hispanic or Latino
Geographical mobility - Moved within same county (%) - American Indian and Alaska Native
Geographical mobility - Moved within same county (%) - Multirace
Geographical mobility - Moved within same county (%) - Other Race
Geographical mobility - Moved from different county within same state (%)
Geographical mobility - Moved from different county within same state (%) - White
Geographical mobility - Moved from different county within same state (%) - Black or African American
Geographical mobility - Moved from different county within same state (%) - Asian
Geographical mobility - Moved from different county within same state (%) - Hispanic or Latino
Geographical mobility - Moved from different county within same state (%) - American Indian and Alaska Native
Geographical mobility - Moved from different county within same state (%) - Multirace
Geographical mobility - Moved from different county within same state (%) - Other Race
Geographical mobility - Moved from different state (%)
Geographical mobility - Moved from different state (%) - White
Geographical mobility - Moved from different state (%) - Black or African American
Geographical mobility - Moved from different state (%) - Asian
Geographical mobility - Moved from different state (%) - Hispanic or Latino
Geographical mobility - Moved from different state (%) - American Indian and Alaska Native
Geographical mobility - Moved from different state (%) - Multirace
Geographical mobility - Moved from different state (%) - Other Race
Geographical mobility - Moved from abroad (%)
Geographical mobility - Moved from abroad (%) - White
Geographical mobility - Moved from abroad (%) - Black or African American
Geographical mobility - Moved from abroad (%) - Asian
Geographical mobility - Moved from abroad (%) - Hispanic or Latino
Geographical mobility - Moved from abroad (%) - American Indian and Alaska Native
Geographical mobility - Moved from abroad (%) - Multirace
Geographical mobility - Moved from abroad (%) - Other Race
Place of birth for the foreign-born population - Ireland (%)
Place of birth for the foreign-born population - Denmark (%)
Place of birth for the foreign-born population - Norway (%)
Place of birth for the foreign-born population - Sweden (%)
Place of birth for the foreign-born population - United Kingdom (%)
Place of birth for the foreign-born population - England (%)
Place of birth for the foreign-born population - Scotland (%)
Place of birth for the foreign-born population - Other Northern Europe (%)
Place of birth for the foreign-born population - Austria (%)
Place of birth for the foreign-born population - Belgium (%)
Place of birth for the foreign-born population - France (%)
Place of birth for the foreign-born population - Germany (%)
Place of birth for the foreign-born population - Netherlands (%)
Place of birth for the foreign-born population - Switzerland (%)
Place of birth for the foreign-born population - Other Western Europe (%)
Place of birth for the foreign-born population - Greece (%)
Place of birth for the foreign-born population - Italy (%)
Place of birth for the foreign-born population - Portugal (%)
Place of birth for the foreign-born population - Spain (%)
Place of birth for the foreign-born population - Other Southern Europe (%)
Place of birth for the foreign-born population - Albania (%)
Place of birth for the foreign-born population - Belarus (%)
Place of birth for the foreign-born population - Bosnia and Herzegovina (%)
Place of birth for the foreign-born population - Bulgaria (%)
Place of birth for the foreign-born population - Croatia (%)
Place of birth for the foreign-born population - Czechoslovakia (%)
Place of birth for the foreign-born population - Hungary (%)
Place of birth for the foreign-born population - Latvia (%)
Place of birth for the foreign-born population - Lithuania (%)
Place of birth for the foreign-born population - North Macedonia (Macedonia) (%)
Place of birth for the foreign-born population - Moldova (%)
Place of birth for the foreign-born population - Poland (%)
Place of birth for the foreign-born population - Romania (%)
Place of birth for the foreign-born population - Russia (%)
Place of birth for the foreign-born population - Serbia (%)
Place of birth for the foreign-born population - Ukraine (%)
Place of birth for the foreign-born population - Other Eastern Europe (%)
Place of birth for the foreign-born population - China (%)
Place of birth for the foreign-born population - Hong Kong (%)
Place of birth for the foreign-born population - Taiwan (%)
Place of birth for the foreign-born population - Japan (%)
Place of birth for the foreign-born population - Korea (%)
Place of birth for the foreign-born population - Other Eastern Asia (%)
Place of birth for the foreign-born population - Afghanistan (%)
Place of birth for the foreign-born population - Bangladesh (%)
Place of birth for the foreign-born population - India (%)
Place of birth for the foreign-born population - Iran (%)
Place of birth for the foreign-born population - Kazakhstan (%)
Place of birth for the foreign-born population - Nepal (%)
Place of birth for the foreign-born population - Pakistan (%)
Place of birth for the foreign-born population - Sri Lanka (%)
Place of birth for the foreign-born population - Uzbekistan (%)
Place of birth for the foreign-born population - Other South Central Asia (%)
Place of birth for the foreign-born population - Burma (%)
Place of birth for the foreign-born population - Cambodia (%)
Place of birth for the foreign-born population - Indonesia (%)
Place of birth for the foreign-born population - Laos (%)
Place of birth for the foreign-born population - Malaysia (%)
Place of birth for the foreign-born population - Philippines (%)
Place of birth for the foreign-born population - Singapore (%)
Place of birth for the foreign-born population - Thailand (%)
Place of birth for the foreign-born population - Vietnam (%)
Place of birth for the foreign-born population - Other South Eastern Asia (%)
Place of birth for the foreign-born population - Armenia (%)
Place of birth for the foreign-born population - Iraq (%)
Place of birth for the foreign-born population - Israel (%)
Place of birth for the foreign-born population - Jordan (%)
Place of birth for the foreign-born population - Kuwait (%)
Place of birth for the foreign-born population - Lebanon (%)
Place of birth for the foreign-born population - Saudi Arabia (%)
Place of birth for the foreign-born population - Syria (%)
Place of birth for the foreign-born population - Turkey (%)
Place of birth for the foreign-born population - Yemen (%)
Place of birth for the foreign-born population - Other Western Asia (%)
Place of birth for the foreign-born population - Eritrea (%)
Place of birth for the foreign-born population - Ethiopia (%)
Place of birth for the foreign-born population - Kenya (%)
Place of birth for the foreign-born population - Somalia (%)
Place of birth for the foreign-born population - Uganda (%)
Place of birth for the foreign-born population - Zimbabwe (%)
Place of birth for the foreign-born population - Other Eastern Africa (%)
Place of birth for the foreign-born population - Cameroon (%)
Place of birth for the foreign-born population - Congo (%)
Place of birth for the foreign-born population - Democratic Republic of Congo (Zaire) (%)
Place of birth for the foreign-born population - Other Middle Africa (%)
Place of birth for the foreign-born population - Egypt (%)
Place of birth for the foreign-born population - Morocco (%)
Place of birth for the foreign-born population - Sudan (%)
Place of birth for the foreign-born population - Other Northern Africa (%)
Place of birth for the foreign-born population - South Africa (%)
Place of birth for the foreign-born population - Other Southern Africa (%)
Place of birth for the foreign-born population - Cabo Verde (%)
Place of birth for the foreign-born population - Ghana (%)
Place of birth for the foreign-born population - Liberia (%)
Place of birth for the foreign-born population - Nigeria (%)
Place of birth for the foreign-born population - Senegal (%)
Place of birth for the foreign-born population - Sierra Leone (%)
Place of birth for the foreign-born population - Other Western Africa (%)
Place of birth for the foreign-born population - Australia (%)
Place of birth for the foreign-born population - New Zealand (%)
Place of birth for the foreign-born population - Fiji (%)
Place of birth for the foreign-born population - Micronesia (%)
Place of birth for the foreign-born population - Bahamas (%)
Place of birth for the foreign-born population - Barbados (%)
Place of birth for the foreign-born population - Cuba (%)
Place of birth for the foreign-born population - Dominica (%)
Place of birth for the foreign-born population - Dominican Republic (%)
Place of birth for the foreign-born population - Grenada (%)
Place of birth for the foreign-born population - Haiti (%)
Place of birth for the foreign-born population - Jamaica (%)
Place of birth for the foreign-born population - St. Vincent and the Grenadines (%)
Place of birth for the foreign-born population - Trinidad and Tobago (%)
Place of birth for the foreign-born population - West Indies (%)
Place of birth for the foreign-born population - Other Caribbean (%)
Place of birth for the foreign-born population - Belize (%)
Place of birth for the foreign-born population - Costa Rica (%)
Place of birth for the foreign-born population - El Salvador (%)
Place of birth for the foreign-born population - Guatemala (%)
Place of birth for the foreign-born population - Honduras (%)
Place of birth for the foreign-born population - Mexico (%)
Place of birth for the foreign-born population - Nicaragua (%)
Place of birth for the foreign-born population - Panama (%)
Place of birth for the foreign-born population - Other Central America (%)
Place of birth for the foreign-born population - Argentina (%)
Place of birth for the foreign-born population - Bolivia (%)
Place of birth for the foreign-born population - Brazil (%)
Place of birth for the foreign-born population - Chile (%)
Place of birth for the foreign-born population - Colombia (%)
Place of birth for the foreign-born population - Ecuador (%)
Place of birth for the foreign-born population - Guyana (%)
Place of birth for the foreign-born population - Peru (%)
Place of birth for the foreign-born population - Uruguay (%)
Place of birth for the foreign-born population - Venezuela (%)
Place of birth for the foreign-born population - Other South America (%)
Place of birth for the foreign-born population - Canada (%)
Place of birth for the foreign-born population - Other Northern America (%)
Place of birth for the foreign-born population - Other (%)
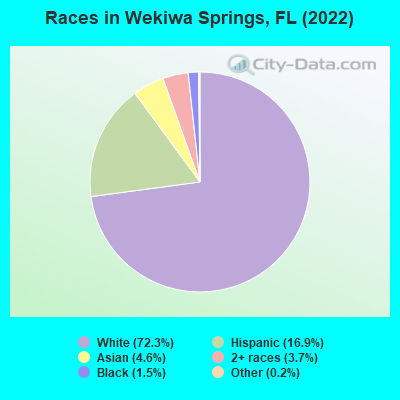
According to 2022 data, the most numerous races in Wekiwa Springs, FL are White alone (17,822 residents), Hispanic (4,162 residents), and Black alone (358 residents). 84.4% of Wekiwa Springs residents speak English at home. 12.6% of Wekiwa Springs, FL residents are foreign-born (6.8% born in Latin America, 3.4% born in Asia, 1.3% born in Europe), which is 67.3% less than the foreign-born rate of 21.0% across the entire state of Florida.
Race distribution in Wekiwa Springs
2000 2022
10,458,509 65.4% White alone 2,682,715 16.8% Hispanic 2,264,268 14.2% Black alone 261,693 1.6% Asian alone 236,954 1.5% Two or more races 42,358 0.3% American Indian alone 28,994 0.2% Other race alone 6,887 0.04% Native Hawaiian and Other
11,309,403 50.8% White alone 6,025,039 27.1% Hispanic 3,241,015 14.6% Black alone 861,630 3.9% Two or more races 623,692 2.8% Asian alone 152,054 0.7% Other race alone 22,504 0.1% American Indian alone 9,486 0.04% Native Hawaiian and Other
Income and house value in Wekiwa Springs Median household income in 2022 $105,628 White non-Hispanic householders$97,626 Black householders$80,011 Some other race householders$111,869 Two or more races householders$100,442 Hispanic or Latino race householdersMedian 2022 house value $455,308 White Non-Hispanic householders$468,821 Black or African American householders $513,222 Asian householders$379,194 Some other race householders$301,700 Two or more races householders$499,984 Hispanic or Latino householders
Median age by race in Wekiwa Springs
49.1 Median age for White residents47.4 49.8 52.2 Median age for Black or African American residents55.6 48.6 -544,061,302.1 Median age for American Indian / Alaska Native residents-541,955,349.7 -503,171,246.9 52.4 Median age for Asian residents45.2 58.9 -679,849,340.2 Median age for Native Hawaiian / Pacific Islander residents-858,307,848.3 -443,298,968.6 33.2 Median age for Other race residents35.3 33.4 39.3 Median age for Two or more races residents42.0 31.2 49.1 Median age for White alone residents48.9 49.7 38.5 Median age for Hispanic or Latino residents37.1 41.2
Owner/renter occupied households by race in Wekiwa Springs
House owners and renters - White residents 6,135 79.8% Owner occupied1,556 20.2% Renter occupiedHouse owners and renters - Black or African American residents 115 61.1% Owner occupied73 38.9% Renter occupiedHouse owners and renters - Asian residents 255 93.8% Owner occupied17 6.2% Renter occupiedHouse owners and renters - Native Hawaiian / Pacific Islander residents 9 100.0% Owner occupiedHouse owners and renters - Other race residents 66 40.8% Owner occupied96 59.2% Renter occupiedHouse owners and renters - Two or more races residents 761 62.6% Owner occupied455 37.4% Renter occupiedHouse owners and renters - White alone residents 6,009 80.1% Owner occupied1,490 19.9% Renter occupiedHouse owners and renters - Hispanic or Latino residents 785 60.3% Owner occupied516 39.7% Renter occupied
Language usage in Wekiwa Springs
English speakers - Total 84.4% of residents of Wekiwa Springs speak English at home.
9.6% of residents speak Spanish at home 1,930 84.9% Speak English very well344 15.1% Speak English less than very well5.5% of residents speak other language at home 915 70.2% Speak English very well389 29.8% Speak English less than very well
English speakers - Born in the United States 95.2% of residents of Wekiwa Springs speak English at home.
3.9% of residents speak Spanish at home 458 95.0% Speak English very well24 5.0% Speak English less than very well1.0% of residents speak other language at home 100 83.3% Speak English very well20 16.7% Speak English less than very well
English speakers - Native, born elsewhere 54.0% of residents of Wekiwa Springs speak English at home.
45.9% of residents speak Spanish at home 266 80.1% Speak English very well66 19.9% Speak English less than very well5.4% of residents speak other language at home 39 100.0% Speak English very well
English speakers - Foreign-born 26.4% of residents of Wekiwa Springs speak English at home.
41.0% of residents speak Spanish at home 1,090 83.3% Speak English very well218 16.7% Speak English less than very well31.7% of residents speak other language at home 663 65.4% Speak English very well350 34.6% Speak English less than very well
White (Caucasian) - Speak only English Native:
98.6% (16,619)Foreign-born:
33.7% (367)
White (Caucasian) - Speak another language Native:
3.0% (503)Foreign-born:
64.5% (704)
Black or African American - Speak only English Native:
91.2% (257)Foreign-born:
61.7% (52)
Black or African American - Speak another language Native:
9.5% (27)Foreign-born:
29.0% (25)
Asian - Speak only English Native:
82.8% (292)Foreign-born:
20.8% (164)
Asian - Speak another language Native:
14.7% (52)Foreign-born:
78.1% (616)
Other race - Speak only English Native:
49.4% (183)Foreign-born:
9.7% (17)
Other race - Speak another language Native:
53.7% (199)Foreign-born:
100.0% (171)
Two or more races - Speak only English Native:
82.4% (1,698)Foreign-born:
27.1% (254)
Two or more races - Speak another language Native:
15.7% (323)Foreign-born:
74.5% (698)
White alone - Speak only English Native:
97.5% (16,044)Foreign-born:
44.7% (350)
White alone - Speak another language Native:
2.5% (416)Foreign-born:
43.2% (338)
Hispanic or Latino - Speak only English Native:
72.2% (1,812)Foreign-born:
10.3% (146)
Hispanic or Latino - Speak another language Native:
32.9% (825)Foreign-born:
89.8% (1,270)
Foreign-born residents in Wekiwa Springs 3,095 residents are foreign born (6.8% Latin America , 3.4% Asia , 1.3% Europe ).
This city:
12.6%Florida:
21.1%
Marital status for residents in Wekiwa Springs Marital status - White (Caucasian) population 15 years and over
Males 24.3% Never married66.4% Now married0.7% Separated1.0% Widowed7.5% DivorcedFemales 21.6% Never married55.8% Now married0.3% Separated9.7% Widowed12.6% DivorcedWomen who gave birth in the past 12 months Now married:
100.0% (107)Unmarried:
0.0% (0)
Women who did not give birth in the past 12 months Now married:
47.5% (1,825)Unmarried:
52.5% (2,015)
Marital status - Black or African American population 15 years and over
Males 17.1% Never married65.1% Now married17.8% Separated0.0% Widowed0.0% DivorcedFemales 42.1% Never married42.8% Now married0.0% Separated15.1% Widowed0.0% DivorcedWomen who did not give birth in the past 12 months Now married:
12.3% (8)Unmarried:
87.7% (60)
Marital status - Asian population 15 years and over
Males 38.4% Never married59.6% Now married0.0% Separated2.0% Widowed0.0% DivorcedFemales 5.9% Never married48.7% Now married0.0% Separated11.2% Widowed34.1% DivorcedWomen who did not give birth in the past 12 months Now married:
27.3% (42)Unmarried:
72.7% (112)
Marital status - Other race population 15 years and over
Males 36.2% Never married63.8% Now married0.0% Separated0.0% Widowed0.0% DivorcedFemales 31.9% Never married63.7% Now married0.0% Separated4.4% Widowed0.0% DivorcedWomen who gave birth in the past 12 months Now married:
100.0% (2)Unmarried:
0.0% (0)
Women who did not give birth in the past 12 months Now married:
61.1% (81)Unmarried:
38.9% (52)
Marital status - Two or more races population 15 years and over
Males 26.9% Never married60.9% Now married0.0% Separated4.4% Widowed7.8% DivorcedFemales 38.4% Never married47.9% Now married1.2% Separated0.6% Widowed11.9% DivorcedWomen who gave birth in the past 12 months Now married:
0.0% (0)Unmarried:
100.0% (36)
Women who did not give birth in the past 12 months Now married:
46.6% (321)Unmarried:
53.4% (368)
Marital status - White alone, not Hispanic / Latino population 15 years and over
Males 24.0% Never married67.2% Now married0.6% Separated1.1% Widowed7.1% DivorcedFemales 20.1% Never married56.9% Now married0.3% Separated10.3% Widowed12.3% DivorcedWomen who gave birth in the past 12 months Now married:
100.0% (90)Unmarried:
0.0% (0)
Women who did not give birth in the past 12 months Now married:
48.8% (1,753)Unmarried:
51.2% (1,840)
Marital status - Hispanic or Latino population 15 years and over
Males 27.7% Never married59.1% Now married0.7% Separated2.5% Widowed10.1% DivorcedFemales 36.1% Never married47.6% Now married0.0% Separated3.5% Widowed12.7% DivorcedWomen who gave birth in the past 12 months Now married:
100.0% (30)Unmarried:
0.0% (0)
Women who did not give birth in the past 12 months Now married:
42.6% (456)Unmarried:
57.4% (616)
Ancestries in Wekiwa Springs
3,285 25.0% American1,176 8.9% English854 6.5% Irish660 5.0% Italian578 4.4% German454 3.5% Russian288 2.2% European244 1.9% French142 1.1% Polish137 1.0% Jamaican107 0.8% Scottish86 0.7% Egyptian86 0.7% British85 0.6% Dutch76 0.6% Scotch-Irish65 0.5% Finnish63 0.5% Scandinavian48 0.4% French Canadian44 0.3% Iranian42 0.3% Eastern European41 0.3% Danish40 0.3% Hungarian40 0.3% Swedish39 0.3% Canadian37 0.3% Greek34 0.3% Norwegian33 0.3% Brazilian30 0.2% Austrian30 0.2% Lebanese29 0.2% Bulgarian29 0.2% Guyanese28 0.2% Ukrainian19 0.1% Haitian17 0.1% Lithuanian15 0.1% Cypriot15 0.1% Northern European15 0.1% Portuguese10 0.08% Israeli9 0.07% Palestinian8 0.06% Croatian7 0.05% Estonian7 0.05% Icelander6 0.05% Slovene6 0.05% Czech5 0.04% Welsh4 0.03% Pennsylvania German4 0.03% Dutch West Indian
Children Nativity (place of birth) in Wekiwa Springs
Children under 6 years - Living with two parents Both parents native 721 100.0% NativeBoth parents foreign-born 101 48.5% Native107 51.5% Foreign-bornOne native, one foreign-born parent 104 100.0% NativeChildren under 6 years - Living with one parent Native parent 120 100.0% NativeChildren 6 to 17 years - Living with two parents Both parents native 2,223 98.8% Native28 1.2% Foreign-bornBoth parents foreign-born 90 51.5% Native85 48.5% Foreign-bornOne native, one foreign-born parent 324 93.6% Native22 6.4% Foreign-bornChildren 6 to 17 years - Living with one parent Native parent 587 100.0% NativeForeign-born parent 105 52.2% Native96 47.8% Foreign-born
Grandparents responsible for own grandchildren in Wekiwa Springs
Grandparents (30 to 59 years) White / Caucasian 6 8.1% Responsible for grandchildren63 91.9% Not responsible for grandchildrenWhite alone, not Hispanic / Latino 1 1.5% Responsible for grandchildren78 98.5% Not responsible for grandchildrenHispanic or Latino 6 100.0% Responsible for grandchildrenGrandparents (60 years and over) White / Caucasian 26 15.5% Responsible for grandchildren140 84.5% Not responsible for grandchildrenWhite alone, not Hispanic / Latino 27 18.9% Responsible for grandchildren117 81.1% Not responsible for grandchildrenHispanic or Latino 31 100.0% Not responsible for grandchildren